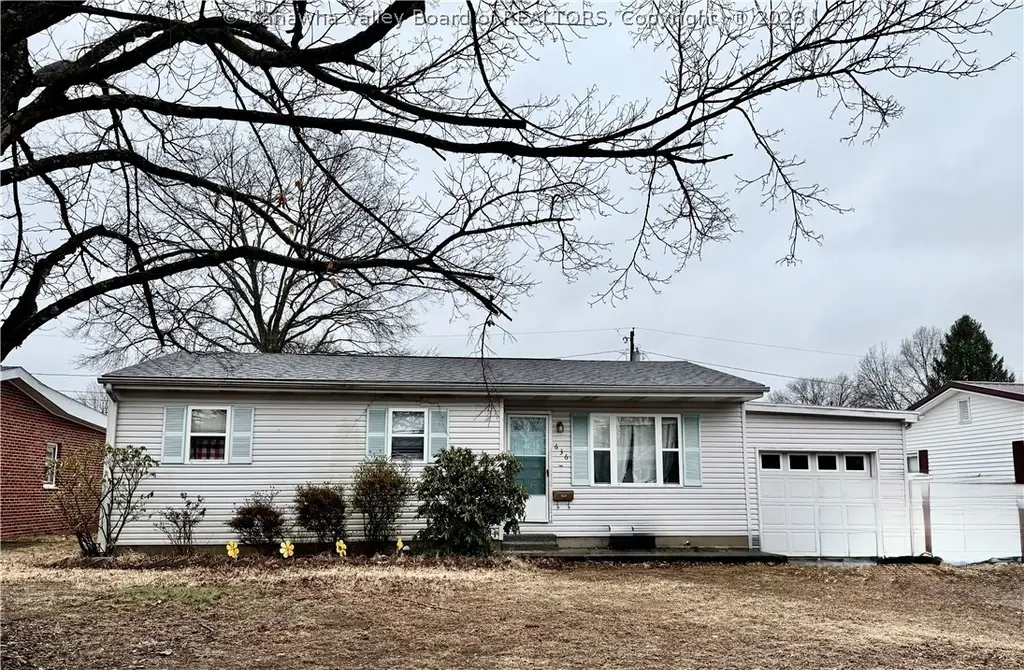
636 Douglas Ave · Ravenswood, WV
Flood risk 1/10 · Minimal
- FEMA flood zone
- X (unshaded)
- Chance of flooding over 30 yrs
- 0.0%
- Est. flood insurance / yr
- $507 – $1,088
Fire risk 3/10 · Minor
- Est. fire insurance / yr
- $787 – $1,461
Heat risk 5/10 · Moderate
- Hot days now (above 102°F)
- 7 days/yr
- Hot days in 30 yrs
- 19 days/yr
Wind risk 2/10 · Minimal
- Chance of severe wind over 30 yrs
- 1.0%
Air-quality risk 2/10 · Minimal
- Unhealthy air days now
- 0 days/yr
- Unhealthy air days in 30 yrs
- 1 days/yr
Risk factors via First Street. Map © Google.
Why this score? — see what drove the C+ grade
The composite is a weighted blend of 9 inputs, each scored 0–100. Each bar is that input's sub-score; the figure is the points it added to the 100-point composite (weight × sub-score).
- Cash flow +19.9/30.0
- ARV discount +15.0/15.0
- DSCR +6.3/10.0
- Appreciation +5.6/10.0
- 1% rule +4.8/10.0
- Schools +3.5/10.0
- Livability +3.2/5.0
- Rent growth +2.5/5.0
- Condition / age +2.5/5.0
$120,000
🖨 Deal sheet 📄 Offer letter ✓ Due diligence
Listing remarks
Low-maintenance vinyl siding Ranch with 3 bedrooms, 1 bath, nice size family room with fireplace opens onto the covered back porch is great to relax and watch the kids play in the spacious fenced back yard! The heart of this home is the kitchen/dining where everyone gathers! Appliances included with this home too! Carrier Forced Air Gas Heat & Central A/C! Yard barn for lawn mower and tools!
Key facts
- 7,405 sq ft lot
- Garage
- Built 1963
Neighborhood map
What this means for you Summary
Snapshot
- This is a 3-bed/1.0-bath single-family listed at $120k.
Deal economics
- At list price, monthly cash flow is $144 ($2k/yr) — positive.
- The deal already cash-flows at list — no discount required.
- To meet the 1% rule (rent ≥ 1% of price), the offer needs to be $117k (2.1% below list).
- Recommended offer: $117k (2.1% below list) — sets the bar for 1% rule.
Location & tenants
- Location reads 64/100 on livability (#137 in WV) — a middle-class / working-renter tenant base. Strengths: crime A+, cost of living A+, housing A-; Watch: health & safety D, amenities F, commute F.
- Jackson County Schools (town): math 38% / reading 45% proficiency, ranked #4 of 55 in WV (top 7%) — families likely to look elsewhere, expect single-tenant / working-renter base with shorter leases.
- Zoned schools: Henry J Kaiser Elementary School (278 students, 0% FRL); Ravenswood Middle School (math 38% / reading 43%, grade F, #16 of 109 statewide, top 16%, 321 students, 0% FRL); Ravenswood High School (math 12% / reading 47%, grade F, #69 of 110 statewide, top 71%, 429 students, 0% FRL) — zoned schools average 0% FRL vs 41% district-wide (41 pts lower); this property's tenant base skews higher-income than the district average.
- Market conditions: 34 active listings in the ZIP; 1 units permitted in Jackson County in 2024 (0 in 5+ unit buildings).
Forward outlook
- In year one you build about $2k of equity ($830 loan paydown + $1k appreciation (1.1% local appreciation)).
- Jackson County population projected at -12% by 2050 — secular population decline; favor cash flow + early exit over multi-decade hold.
- At projected returns (1.1% appreciation + 3.0% rent growth), your $34k cash investment doubles in ~7 years — after that, you're playing with house money.
Negotiation context
- Only 0 days on market — expect competitive offers; lowballing is unlikely to land.
Risks & watch-outs
- Climate carrying-cost: extreme-heat days projected 7→19/yr by 2055 (HVAC capex compounding) — expect insurance premiums to compound above CPI over the hold.
Questions for the listing agent
- Built in 1963 — when were the roof, HVAC, electrical panel, plumbing, and water heater last replaced?
- Is there a deadline driving the sale (1031 exchange, divorce, estate, relocation)? That informs how much negotiation room exists.
- What's the average days-on-market for RENTAL listings here right now (not sales)? A rising rental-DOM trend means longer vacancies and softer asking-rent achievability than the comps imply.
- What's the recent tenant-quality profile in this submarket — average credit score on applications, eviction rate, late-payment / NSF rate, and stable-employment percentage? A property-management company in the area should have these aggregated.
- How much new for-sale + rental construction is in the pipeline within 1–3 miles? Heavy new supply typically softens prices + rents 12–24 months out; constrained supply supports both.
Investment metrics
- 1% rule
- 0.98% ✗
- Cap rate
- 7.74%
- Cash-on-cash
- 5.16%
- DSCR
- 1.23
- GRM
- 8.5
CMA / ARV
- ARV (on-the-fly)
- $152,160
- Comps found
- 10
Show comp detail 10 sales within ~0.75 mi
| Address | Dist | Beds/Ba | Sqft | Sold | Price | $/sf | Match |
|---|---|---|---|---|---|---|---|
| 622 Long Ave | 0.13mi | 3/1.0 | 1,094 (-14%) | 3mo | $129,000 | $118 | 69 |
| 637 Douglas Ave | 0.03mi | 3/2.0 | 1,163 (-8%) | 15mo | $205,000 | $176 | 69 |
| 307 Brown St | 0.32mi | 3/1.0 | 1,240 (-2%) | 16mo | $147,500 | $119 | 68 |
| 409 Wood St | 0.33mi | 3/1.0 | 1,142 (-10%) | 1mo | $182,500 | $160 | 67 |
| 1108 Henrietta St | 0.36mi | 3/1.5 | 1,320 (+4%) | 13mo | $164,000 | $124 | 64 |
| 423 Harpold Ave | 0.15mi | 3/1.5 | 1,406 (+11%) | 21mo | $179,500 | $128 | 55 |
| 1117 Race St | 0.53mi | 3/2.0 | 1,328 (+5%) | 13mo | $160,000 | $120 | 53 |
| 710 Cherry St | 0.65mi | 3/1.5 | 1,258 (-1%) | 20mo | $135,000 | $107 | 50 |
| 712 Cherry St | 0.65mi | 3/2.0 | 1,326 (+5%) | 15mo | $135,000 | $102 | 46 |
| 706 S Ritchie Ave | 0.54mi | 3/1.5 | 1,440 (+14%) | 12mo | $88,000 | $61 | 40 |
Match score weights: distance 35% · size 25% · config 20% · recency 20%. Top-matched comps best support the ARV.
Projected returns pro-forma
1.12% appreciation · 3.0% rent growth · sell at horizon
- IRR
- 7.1%
- Equity multiple
- 1.36×
- Total profit
- $12,158
- Equity at exit
- $41,744
- IRR
- 11.1%
- Equity multiple
- 2.36×
- Total profit
- $45,823
- Equity at exit
- $56,081
Cash invested: $33,600 (down + closing). Projections, not guarantees.
Landlord ↔ Tenant lean methodology
- Overall (STATE)
- 83 Strongly Landlord-Friendly
- State West Virginia
- 83 Strongly Landlord-Friendly · R+22
- County
- — inherits STATE
- City
- — inherits STATE
ZIP-level market 26164
- Home prices YoY
- 0.6%
- Active inventory
- 34
- Price-to-rent
- 8.5×
Monthly cashflow live
- Estimated rent
- $1,175 medium interval (Pro) →
- Mortgage (P&I)
- −$629
- Tax from tax record
- −$104 /mo · $1,253/yr
- Insurance
- −$50
- HOA
- −$0
- Vacancy / Maint / Mgmt
- −$247
- Net cashflow
- $144
Break-even live
UW: 25.0% down · 7.5% · 30yr · 1.5% tax · 5.0% vac · 8.0% maint · 8.0% mgmt
Financing live
Cash to close
- Down payment
- $30,000
- Closing costs
- $3,600
- Reserves months
- —
- Total cash needed
- —
Loan-product check · same deal, 3 products live
Conventional
25% down · 7.5% · 30yr
- Down + closing
- —
- Monthly P&I
- —
- Monthly cashflow
- —
- DSCR
- —
- Eligible?
- —
Personal DTI + credit; lowest rate.
DSCR
20% down · 8.5% · 30yr
- Down + closing
- —
- Monthly P&I
- —
- Monthly cashflow
- —
- DSCR
- —
- Eligible?
- —
No personal income docs; deal must DSCR.
Hard money
10% down · 12.0% · 12mo
- Down + closing
- —
- Monthly P&I
- —
- Monthly cashflow
- —
- DSCR
- —
- Eligible?
- —
Short-term bridge; refi at stabilization.
Listing history 2 events
-
2026-03-25historical
-
2026-03-24$120,000
ⓘ Source: listings_history table (triggers on properties + properties_extension) + one-shot
backfill from property_details.listing_events for pre-trigger history.
Tax reassessment forecast WV · Resets to sale price
- Current annual tax
- $1,253 · $104/mo
- Projected year-2 tax
- $1,253 · $104/mo
- Expected delta
- $0/yr ($0/mo · 0.0%)
ⓘ Screening estimate from a state-policy table — verify with the county assessor before closing.
Climate risk First Street
- Flood 1/10 Low FEMA zone X (unshaded) · 0% chance over 30 yrs
- Wildfire 3/10 Moderate
- Heat 5/10 Major 7 d/yr ≥102°F today · 19 d/yr by 30 yrs out
- Wind 2/10 Low 100% chance of damaging wind over 30 yrs
- Air quality 2/10 Low 0 unhealthy d/yr today · 1 by 30 yrs out
Nearby sold comps map
Loading sold comps map…
Walkable amenities ~0.75 mi
Loading nearby amenities…
Taxation est. · year 1
- Rental income
- $14,097
- − Mortgage interest
- −$6,722
- − Property taxes
- −$1,253
- − Insurance
- −$600
- − Repairs & maintenance
- −$1,128
- − Management
- −$1,128
- − Depreciation
- −$3,491
- Taxable loss
- −$224
- Est. tax savings @ 24.0%
- +$54
- After-tax cash flow
- $1,786/yr
For passive investors: Depreciation is non-cash, so a rental often shows a tax loss while cash-flowing — sheltering income. Rental losses are passive: they offset passive income freely, and up to $25,000/yr can offset ordinary (W-2) income if you actively participate and your MAGI is under $100k (phasing out to $0 by $150k); unused losses carry forward. On sale, claimed depreciation is recaptured at up to 25%, and gains may owe capital-gains tax (a 1031 exchange can defer both). Figures are a year-1 estimate at your 24.0% rate — not tax advice; consult a CPA.
Schools (NCES district)
- District
- Jackson County Schools
- NCES district ID
- 5400540
- Math proficiency
- 38% ▼ -6.00%
- Reading proficiency
- 45% ▼ -6.00%
- Median HH income
- $41,632
- Composite
- 34.92/100
- National rank
- #5070
- State rank
- #4 of 55 in WV
Livability — Ravenswood
- Score
- 64/100
- State rank
- #137
- US rank
- #13910
Category grades
Schools grade is shown separately in the Schools card above.
Census & demographics
- Census place
- Ravenswood, WV
- Population (ZIP)
- 7,342
Population outlook (Jackson County) Hauer SSP2
- Today (2025)
- 28,752 people
- By 2030
- 28,271 · -1.7%
- By 2040
- 26,970 · -6.2%
- By 2050
- 25,248 · -12.2%
- By 2075
- 20,926 · -27.2%
- By 2100
- 15,573 · -45.8%
Race, ethnicity, and origin ACS 2023
- Neighborhood character
- Predominantly White (97%)
- Race & ethnicity
- White 97% Two or more races 2%
- Common ancestry
- Slovak 2% Lithuanian 1% Iranian 1%
- Foreign-born
- 2%
- Languages at home
- 98% English-only · Spanish 1% Tagalog/Filipino 1%
Political lean MEDSL · Jackson
- 2024 margin
- Solid R (+56.2) · D 21.1% · R 77.3% · Other 1.7%
- 2008→2024 swing
- -37.5pp toward R · 2008: -18.7pp · 2024: -56.2pp
- All cycles
- 2024: R+56.2 2020: R+51.0 2016: R+52.1 2012: R+30.9 2008: R+18.7
Not yet ingested
- Civics
- —
Market trends
- HPI YoY
- ▲ 1.12%
- Current HPI
- 184.9166
- Rent YoY
- —
- Metro
- —
- State GDP YoY
- —
- F500 in state
- 0
Price history
2 events — show timeline
- 2026-03-25 Delisted — KVBOR
- 2026-03-24 Listed $120,000 KVBOR
Property tax history
+1.1%/yrLatest (2025): $1,253 · +0.3% YoY. Source: county tax records.
Cash-flow waterfall
monthlySold comps — $/sqft
last 12 mo · ≤1 miLoading sold comps…