3632 N 9th · Ceres, CA
Flood risk 1/10 · Minimal
- FEMA flood zone
- X (unshaded)
- Chance of flooding over 30 yrs
- 0.0%
- Est. flood insurance / yr
- $507 – $1,088
Fire risk 6/10 · Moderate
- Est. fire insurance / yr
- $659 – $1,223
Heat risk 7/10 · Major
- Hot days now (above 102°F)
- 7 days/yr
- Hot days in 30 yrs
- 15 days/yr
Wind risk 1/10 · Minimal
- Chance of severe wind over 30 yrs
- —
Air-quality risk 10/10 · Severe
- Unhealthy air days now
- 34 days/yr
- Unhealthy air days in 30 yrs
- 37 days/yr
Risk factors via First Street. Map © Google.
Why this score? — see what drove the D grade
The composite is a weighted blend of 9 inputs, each scored 0–100. Each bar is that input's sub-score; the figure is the points it added to the 100-point composite (weight × sub-score).
- Cash flow +15.0/30.0
- ARV discount +7.5/15.0
- 1% rule +5.0/10.0
- DSCR +5.0/10.0
- Schools +2.8/10.0
- Livability +2.7/5.0
- Rent growth +2.5/5.0
- Condition / age +2.5/5.0
- Appreciation +0.0/10.0
$26,000
🖨 Deal sheet (PDF) 📄 Offer letter ✓ Due diligence
Listing remarks
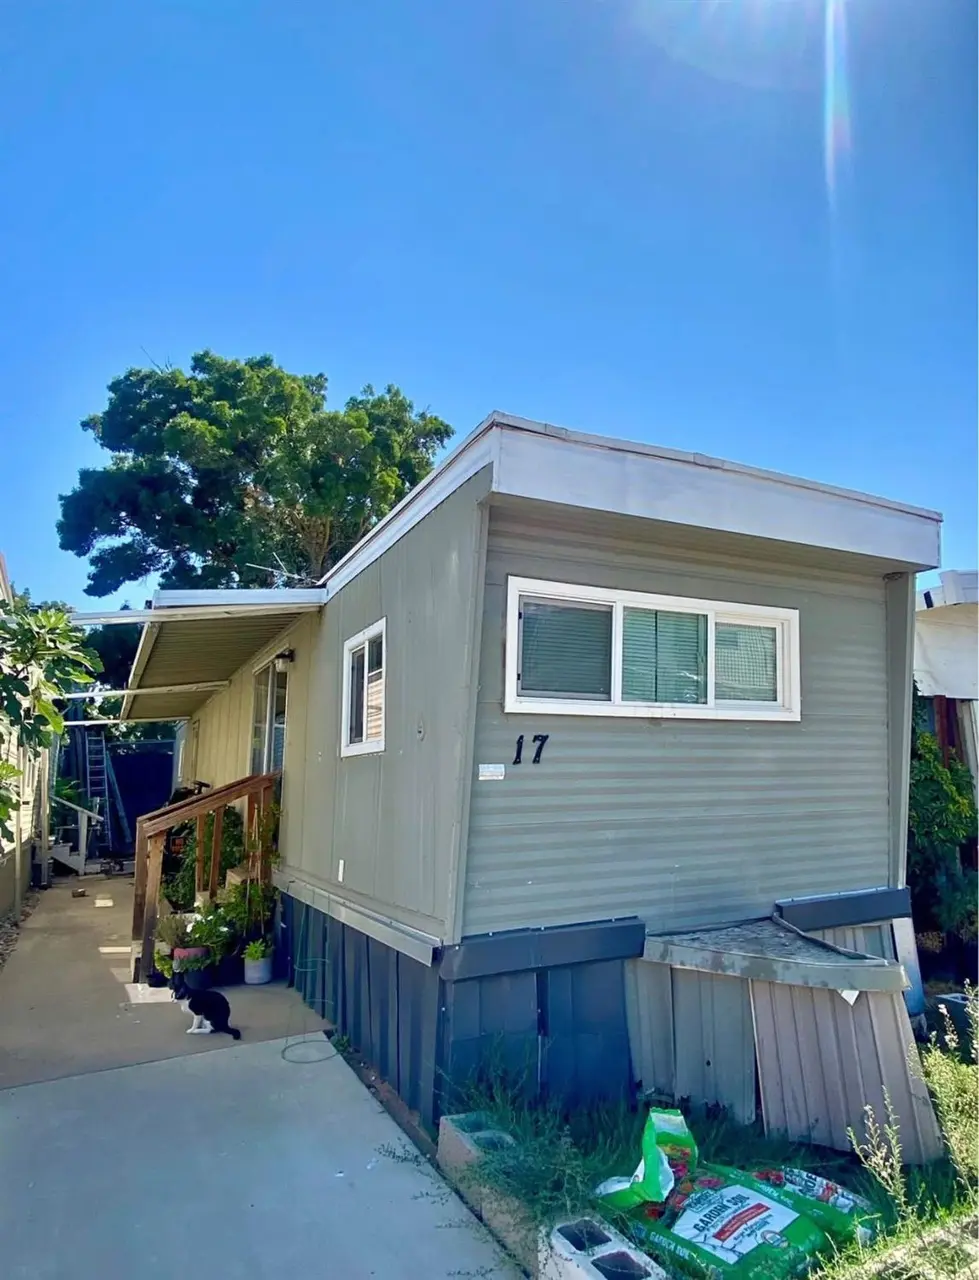
Welcome to Space #17 in Little Orchard Mobile Home Park, located in the heart of Ceres, CA. This charming 1967 single-wide mobile home offers 1 bedroom, 1 bathroom, and approximately 850 sq. ft. of comfortable living space perfect for those looking to customize, downsize, or invest. Inside, you'll find an updated kitchen and a bright, open layout filled with natural light. Enjoy relaxing on the covered front porch with planter space, along with the convenience of private driveway parking, an attached awning, and extra storage with a small yard area. The park is an all-ages community in central Ceres, with an application and approval required for purchase. With low space rent of only $700 pe
Key facts
- Covered porch
- Small yard area
- Community amenities
Tags
Neighborhood map
What this means for you Summary
Snapshot
- This is a 4-bed/2.0-bath land listed at $26k.
Deal economics
- At list price, monthly cash flow is $2k ($22k/yr) — positive.
- The deal already cash-flows at list — no discount required.
- Meets the 1% rule at list price ($3k rent vs $26k).
- Recommended offer: $23k (12.0% below list) — sets the bar for market timing.
- Cap rate 90.8% vs local median 3.8% in Ceres — top-decile yield for the area; either an underpriced asset or a hidden risk that comps aren't pricing in. Stress-test before assuming the spread holds.
Location & tenants
- Location reads 54/100 on livability (#923 in CA) — a working-class tenant base; expect higher turnover. Strengths: housing A+; Watch: employment C-, crime D+, schools D-.
- Ceres Unified (suburban): math 15% / reading 50% proficiency, ranked #303 of 517 in CA (top 59%) — families likely to look elsewhere, expect single-tenant / working-renter base with shorter leases; 69% free/reduced lunch — lower-income household profile, screen leases tightly.
- Market conditions: 90 active listings in the ZIP; 1 comparable units currently listed for rent nearby; solid renter incomes; 923 units permitted in Stanislaus County in 2024 (63 in 5+ unit buildings).
- This rent runs 38% of the median local income ($81k/yr) — at the standard rent-burdened threshold; future hikes will face affordability resistance.
Forward outlook
- Local home prices are declining (-3.0%/yr); year-one equity from $180 of loan paydown is wiped out by about $780 of value loss. Plan a longer hold.
- Stanislaus County population projected at +14% by 2050 — modest demand growth; plan on rents tracking national, not racing it.
- At projected returns (-3.0% appreciation + 3.0% rent growth), your $7k cash investment doubles in ~1 year — after that, you're playing with house money.
Negotiation context
- It's been on market 337 days — a 12% lower offer ($23k) is reasonable based on typical stale-listing flexibility.
Risks & watch-outs
- Climate carrying-cost: major wildfire risk; extreme-heat days projected 7→15/yr by 2055 (HVAC capex compounding) — expect insurance premiums to compound above CPI over the hold.
Questions for the listing agent
- It's been on market 337 days. Have you received any prior offers? Is the seller open to a 12% concession, seller financing, or rate buy-down credit?
- Built in 1964 — when were the roof, HVAC, electrical panel, plumbing, and water heater last replaced?
- Why hasn't it sold? Are there any deal-killer items the seller is aware of (foundation, flood, title, zoning, code violations)?
- Is there a deadline driving the sale (1031 exchange, divorce, estate, relocation)? That informs how much negotiation room exists.
- Schools are D-rated, which usually means shorter tenancies and higher turnover. Who's the typical renter profile here, and what's been the actual vacancy rate?
- Crime grade is D in this area — have there been break-ins, vandalism, or insurance claims at this property in the last 3 years? What carrier currently insures it and at what premium?
- The area grade is low — what's the realistic commute time and amenity access for the typical tenant pool here? Any planned neighborhood developments (good or bad) we should know about?
- What's the average days-on-market for RENTAL listings here right now (not sales)? A rising rental-DOM trend means longer vacancies and softer asking-rent achievability than the comps imply.
- What's the recent tenant-quality profile in this submarket — average credit score on applications, eviction rate, late-payment / NSF rate, and stable-employment percentage? A property-management company in the area should have these aggregated.
- How much new for-sale + rental construction is in the pipeline within 1–3 miles? Heavy new supply typically softens prices + rents 12–24 months out; constrained supply supports both.
Investment metrics
- 1% rule
- 9.79% ✓
- Cap rate
- 90.85%
- Cash-on-cash
- 301.99%
- DSCR
- 14.44
- GRM
- 0.9
CMA / ARV
- ARV (median comp)
- $56,128
- List price
- $26,000
- Delta
- -53.68%
- Verdict
- UNDERPRICED
- Comps
- 4 within 1.0 mi
Projected returns pro-forma
-3.0% appreciation · 3.0% rent growth · sell at horizon
- IRR
- —
- Equity multiple
- 16.45×
- Total profit
- $112,510
- Equity at exit
- $3,877
- IRR
- —
- Equity multiple
- 35.12×
- Total profit
- $248,378
- Equity at exit
- $2,248
Cash invested: $7,280 (down + closing). Projections, not guarantees.
Landlord ↔ Tenant lean methodology
- Overall (STATE)
- 18 Strongly Tenant-Friendly
- State California
- 18 Strongly Tenant-Friendly · D+13
- County
- — inherits STATE
- City
- — inherits STATE
ZIP-level market 95307
- Active inventory
- 90
- Price-to-rent
- 0.9×
Monthly cashflow live
- Estimated rent
- $2,546 medium interval (Pro) →
- Mortgage (P&I)
- −$136
- Tax est. 1.5%
- −$32 /mo · $390/yr
- Insurance
- −$11
- HOA
- −$0
- Vacancy / Maint / Mgmt
- −$535
- Net cashflow
- $1,832
Break-even live
Sensitivity live
| Price | -10% $1,850 | -5% $1,841 | +0% $1,832 | +5% $1,823 | +10% $1,814 |
|---|---|---|---|---|---|
| Rent | -10% $1,631 | -5% $1,731 | +0% $1,832 | +5% $1,933 | +10% $2,033 |
| Rate | -1.0pp $1,845 | -0.5pp $1,839 | base $1,832 | +0.5pp $1,825 | +1.0pp $1,818 |
UW: 25.0% down · 7.5% · 30yr · 1.5% tax · 5.0% vac · 8.0% maint · 8.0% mgmt
Financing live
Cash to close
- Down payment
- $6,500
- Closing costs
- $780
- Reserves months
- —
- Total cash needed
- —
Loan-product check · same deal, 3 products live
Conventional
25% down · 7.5% · 30yr
- Down + closing
- —
- Monthly P&I
- —
- Monthly cashflow
- —
- DSCR
- —
- Eligible?
- —
Personal DTI + credit; lowest rate.
DSCR
20% down · 8.5% · 30yr
- Down + closing
- —
- Monthly P&I
- —
- Monthly cashflow
- —
- DSCR
- —
- Eligible?
- —
No personal income docs; deal must DSCR.
Hard money
10% down · 12.0% · 12mo
- Down + closing
- —
- Monthly P&I
- —
- Monthly cashflow
- —
- DSCR
- —
- Eligible?
- —
Short-term bridge; refi at stabilization.
Rent comps 1 comps
| Address | Beds | Baths | Sqft | Rent | $/sqft | DOM | Units | Dist |
|---|---|---|---|---|---|---|---|---|
| 2029 Venus Dr Ceres, CA | 3.0 | 2.0 | 1336 | $2,500 | $1.87 | 24d | 1 | 1.26mi |
Listing history 18 events
-
2026-06-21days on market $26,000 Active 337 DOM
-
2026-06-18days on market $26,000 Active 334 DOM
-
2026-06-17days on market $26,000 Active 333 DOM
-
2026-06-16days on market $26,000 Active 332 DOM
-
2026-06-15days on market $26,000 Active 331 DOM
-
2026-06-14days on market $26,000 Active 329 DOM
-
2026-06-13days on market $26,000 Active 328 DOM
-
2026-06-10days on market $26,000 Active 326 DOM
-
2026-06-09days on market $26,000 Active 325 DOM
-
2026-06-08days on market $26,000 Active 324 DOM
-
2026-06-07days on market $26,000 Active 323 DOM
-
2026-06-05days on market $26,000 Active 320 DOM
-
2026-06-03days on market $26,000 Active 319 DOM
-
2026-06-02days on market $26,000 Active 318 DOM
-
2026-06-01days on market $26,000 Active 317 DOM
-
2026-05-31days on market $26,000 Active 316 DOM
-
2026-05-30days on market $26,000 Active 315 DOM
-
1990-02-01soldstatus $550,000
ⓘ Source: listings_history table (triggers on properties + properties_extension) + one-shot
backfill from property_details.listing_events for pre-trigger history.
Climate risk First Street
- Flood 1/10 Low FEMA zone X (unshaded) · 0% chance over 30 yrs
- Wildfire 6/10 Major
- Heat 7/10 Severe 7 d/yr ≥102°F today · 15 d/yr by 30 yrs out
- Wind 1/10 Low
- Air quality 10/10 Extreme 34 unhealthy d/yr today · 37 by 30 yrs out
Nearby sold comps map
Loading sold comps map…
Walkable amenities ~0.75 mi
Loading nearby amenities…
Taxation est. · year 1
- Rental income
- $30,558
- − Mortgage interest
- −$1,456
- − Property taxes
- −$390
- − Insurance
- −$130
- − Repairs & maintenance
- −$2,445
- − Management
- −$2,445
- − Depreciation
- −$756
- Taxable income
- $22,936
- Est. tax owed @ 24.0%
- −$5,505
- After-tax cash flow
- $16,480/yr
For passive investors: Depreciation is non-cash, so a rental often shows a tax loss while cash-flowing — sheltering income. Rental losses are passive: they offset passive income freely, and up to $25,000/yr can offset ordinary (W-2) income if you actively participate and your MAGI is under $100k (phasing out to $0 by $150k); unused losses carry forward. On sale, claimed depreciation is recaptured at up to 25%, and gains may owe capital-gains tax (a 1031 exchange can defer both). Figures are a year-1 estimate at your 24.0% rate — not tax advice; consult a CPA.
Schools (NCES district)
- District
- Ceres Unified
- NCES district ID
- 0608130
- Math proficiency
- 15% ▼ -9.00%
- Reading proficiency
- 50% ▲ 12.00%
- Median HH income
- $48,178
- Composite
- 27.96/100
- National rank
- #6858
- State rank
- #303 of 517 in CA
Livability — Ceres
- Score
- 54/100
- State rank
- #923
- US rank
- #24224
Category grades
Schools grade is shown separately in the Schools card above.
Census & demographics
- Census place
- Ceres, CA
- County
- Stanislaus County · 445,786 people
- City population
- 46,310
- Metro
- Modesto, CA
- Population (ZIP)
- 46,310
- Household income
- $80,627
- Rent vs Own
- Severe rent burden
- 1102.0
Population outlook (Stanislaus County) Hauer SSP2
- Today (2025)
- 579,493 people
- By 2030
- 598,000 · +3.2%
- By 2040
- 630,930 · +8.9%
- By 2050
- 658,300 · +13.6%
- By 2075
- 712,363 · +22.9%
- By 2100
- 719,805 · +24.2%
Race, ethnicity, and origin ACS 2023
- Neighborhood character
- Majority Hispanic (64%)
- Race & ethnicity
- Hispanic / Latino 64% Two or more races 34% White 23% Asian 8% Black 1%
- Hispanic origin (detail)
- Mexican 61%
- Common ancestry
- Russian 3% Lithuanian 1% Italian 1%
- Foreign-born
- 27% · Canada, China
- Languages at home
- 41% English-only · Spanish 49% Other Indo-European 7% Arabic 1%
Political lean MEDSL · Stanislaus
- 2024 margin
- R (+11.0) · D 43.2% · R 54.2% · Other 2.6%
- 2008→2024 swing
- -12.7pp toward R · 2008: 1.7pp · 2024: -11.0pp
- All cycles
- 2024: R+11.0 2020: D+0.8 2016: D+0.6 2012: D+0.7 2008: D+1.7
Not yet ingested
- Civics
- —
Market trends
- HPI YoY
- ▼ -362.75%
- Current HPI
- 307.5192
- Rent YoY
- —
- Metro
- Modesto, CA
- State GDP YoY
- ▲ 3.21%
- F500 in state
- 116
Industry mix (Fortune 500 HQ in CA)
| Industry | F500 HQs | Revenue |
|---|---|---|
| Technology | 27 | $1,492B |
|
||
| Financial Services | 3 | $174B |
|
||
| Retail | 3 | $44B |
|
||
| Insurance | 3 | $26B |
|
||
| Media / Entertainment | 2 | $115B |
|
||
| Pharmaceuticals / Biotech | 2 | $62B |
|
||
Price history
1 event — show timeline
- 1990-02-01 Sold (Public Records) $550,000 Public Records
Property tax history
+4.8%/yrLatest (2025): $14,488 · +6.7% YoY. Source: county tax records.
Cash-flow waterfall
monthlySold comps — $/sqft
last 12 mo · ≤1 miLoading sold comps…