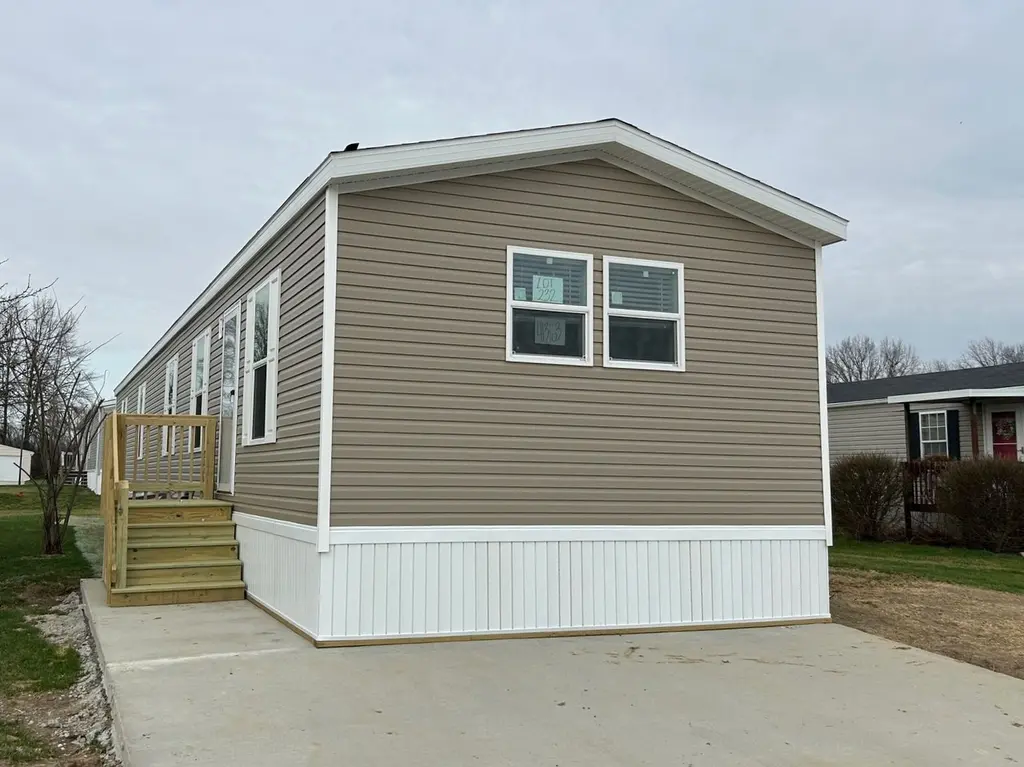
232 Buckingham Dr #232 · Lima, OH
Flood risk 1/10 · Minimal
- FEMA flood zone
- X (unshaded)
- Chance of flooding over 30 yrs
- 0.0%
- Est. flood insurance / yr
- $473 – $860
Fire risk 1/10 · Minimal
- Est. fire insurance / yr
- $713 – $1,323
Heat risk 4/10 · Minor
- Hot days now (above 100°F)
- 7 days/yr
- Hot days in 30 yrs
- 18 days/yr
Wind risk 2/10 · Minimal
- Chance of severe wind over 30 yrs
- —
Air-quality risk 2/10 · Minimal
- Unhealthy air days now
- 1 days/yr
- Unhealthy air days in 30 yrs
- 2 days/yr
Risk factors via First Street. Map © Google.
Why this score? — see what drove the A- grade
The composite is a weighted blend of 9 inputs, each scored 0–100. Each bar is that input's sub-score; the figure is the points it added to the 100-point composite (weight × sub-score).
- Cash flow +30.0/30.0
- 1% rule +10.0/10.0
- DSCR +10.0/10.0
- Appreciation +10.0/10.0
- ARV discount +6.9/15.0
- Schools +5.0/10.0
- Condition / age +4.8/5.0
- Livability +3.2/5.0
- Rent growth +2.5/5.0
$58,300
🖨 Deal sheet 📄 Offer letter ✓ Due diligence
Listing remarks
Your brand new 3 bedroom, 2 bathroom home is waiting for you to move in! This comfortable home features premium entry doors, a modern bathroom, as well as new brand name appliances. In the community, enjoy with your friends and family all the amenities we have to offer such as community events, a clubhouse, and a playground. This home won't be on the market long, so call us today for more information or to schedule a tour. Deposits & Fees are subject to change.
Key facts
- Clubhouse
- Modern bathroom
- Premium entry doors
Tags
Neighborhood map
What this means for you Summary
Snapshot
- This is a 3-bed/2.0-bath manufactured listed at $58k. Condition is rated excellent.
Deal economics
- At list price, monthly cash flow is $889 ($11k/yr) — positive.
- The deal already cash-flows at list — no discount required.
- Meets the 1% rule at list price ($2k rent vs $58k).
- Cap rate 24.6% vs local median 7.7% in Lima — top-decile yield for the area; either an underpriced asset or a hidden risk that comps aren't pricing in. Stress-test before assuming the spread holds.
Location & tenants
- Location reads 64/100 on livability (#787 in OH) — a middle-class / working-renter tenant base. Strengths: cost of living A+, housing A+, health & safety A-; Watch: crime F, amenities F, commute F.
- Elida Local (rural): math 59% / reading 59% proficiency, ranked #311 of 656 in OH (top 47%) — acceptable for families but not a draw, mixed tenant base, ~2y average lease.
- Market conditions: 53 active listings in the ZIP; 88 units permitted in Allen County in 2024 (0 in 5+ unit buildings).
Forward outlook
- In year one you build about $6k of equity ($403 loan paydown + $6k appreciation (10.0% local appreciation)).
- Allen County population projected at -14% by 2050 — secular population decline; favor cash flow + early exit over multi-decade hold.
- At projected returns (10.0% appreciation + 3.0% rent growth), your $16k cash investment doubles in ~1 year — after that, you're playing with house money.
- By year 6, paydown + projected appreciation supports a ~$37k cash-out refi (75% LTV) — recoverable capital for the next deal without selling this one.
Negotiation context
- Only 9 days on market — expect competitive offers; lowballing is unlikely to land.
Questions for the listing agent
- Is there a deadline driving the sale (1031 exchange, divorce, estate, relocation)? That informs how much negotiation room exists.
- Crime grade is F in this area — have there been break-ins, vandalism, or insurance claims at this property in the last 3 years? What carrier currently insures it and at what premium?
- What's the average days-on-market for RENTAL listings here right now (not sales)? A rising rental-DOM trend means longer vacancies and softer asking-rent achievability than the comps imply.
- What's the recent tenant-quality profile in this submarket — average credit score on applications, eviction rate, late-payment / NSF rate, and stable-employment percentage? A property-management company in the area should have these aggregated.
- How much new for-sale + rental construction is in the pipeline within 1–3 miles? Heavy new supply typically softens prices + rents 12–24 months out; constrained supply supports both.
Investment metrics
- 1% rule
- 2.80% ✓
- Cap rate
- 24.58%
- Cash-on-cash
- 65.32%
- DSCR
- 3.91
- GRM
- 3.0
CMA / ARV
- ARV (median comp)
- $57,500
- List price
- $58,300
- Delta
- 1.39%
- Verdict
- FAIR
- Comps
- 5 within 1.0 mi
Show comp detail 4 sales within ~0.75 mi
| Address | Dist | Beds/Ba | Sqft | Sold | Price | $/sf | Match |
|---|---|---|---|---|---|---|---|
| 166 Saddlebrook Dr | 0.08mi | 3/2.0 | 1,287 (+6%) | 2mo | $89,000 | $69 | 85 |
| 14 Deer Run | 0.06mi | 3/2.0 | 1,144 (-6%) | 4mo | $57,500 | $50 | 84 |
| 162 Saddlebrook Dr | 0.10mi | 3/2.0 | 1,350 (+11%) | 7mo | $70,000 | $52 | 71 |
| 231 Buckingham Dr | 0.02mi | 2/2.0 (-1) | 1,180 (-3%) | 22mo | $47,500 | $40 | 71 |
Match score weights: distance 35% · size 25% · config 20% · recency 20%. Top-matched comps best support the ARV.
Projected returns pro-forma
10.0% appreciation · 3.0% rent growth · sell at horizon
- IRR
- 76.9%
- Equity multiple
- 6.41×
- Total profit
- $88,369
- Equity at exit
- $52,521
- IRR
- 70.9%
- Equity multiple
- 14.22×
- Total profit
- $215,778
- Equity at exit
- $113,264
Cash invested: $16,324 (down + closing). Projections, not guarantees.
Landlord ↔ Tenant lean methodology
- Overall (STATE)
- 73 Landlord-Friendly
- State Ohio
- 73 Landlord-Friendly · R+6
- County
- — inherits STATE
- City
- — inherits STATE
ZIP-level market 45807
- Home prices YoY
- 8.5%
- Active inventory
- 53
- Price-to-rent
- 3.0×
Monthly cashflow live
- Estimated rent
- $1,635 medium interval (Pro) →
- Mortgage (P&I)
- −$306
- Tax est. 1.5%
- −$73 /mo · $874/yr
- Insurance
- −$24
- HOA
- −$0
- Vacancy / Maint / Mgmt
- −$343
- Net cashflow
- $889
Break-even live
UW: 25.0% down · 7.5% · 30yr · 1.5% tax · 5.0% vac · 8.0% maint · 8.0% mgmt
Financing live
Cash to close
- Down payment
- $14,575
- Closing costs
- $1,749
- Reserves months
- —
- Total cash needed
- —
Loan-product check · same deal, 3 products live
Conventional
25% down · 7.5% · 30yr
- Down + closing
- —
- Monthly P&I
- —
- Monthly cashflow
- —
- DSCR
- —
- Eligible?
- —
Personal DTI + credit; lowest rate.
DSCR
20% down · 8.5% · 30yr
- Down + closing
- —
- Monthly P&I
- —
- Monthly cashflow
- —
- DSCR
- —
- Eligible?
- —
No personal income docs; deal must DSCR.
Hard money
10% down · 12.0% · 12mo
- Down + closing
- —
- Monthly P&I
- —
- Monthly cashflow
- —
- DSCR
- —
- Eligible?
- —
Short-term bridge; refi at stabilization.
Listing history 7 events
-
2026-06-01price $58,300 Active 9 DOM
-
2026-06-01days on market $57,800 Active 9 DOM
-
2026-05-31days on market $57,800 Active 8 DOM
-
2026-05-31days on market $57,800 Active 7 DOM
-
2026-05-18status Active 471-char remark
-
2026-05-05historical 471-char remark
-
2026-05-02$57,800 Active 471-char remark
ⓘ Source: listings_history table (triggers on properties + properties_extension) + one-shot
backfill from property_details.listing_events for pre-trigger history.
Climate risk First Street
- Flood 1/10 Low FEMA zone X (unshaded) · 0% chance over 30 yrs
- Wildfire 1/10 Low
- Heat 4/10 Moderate 7 d/yr ≥100°F today · 18 d/yr by 30 yrs out
- Wind 2/10 Low
- Air quality 2/10 Low 1 unhealthy d/yr today · 2 by 30 yrs out
Nearby sold comps map
Loading sold comps map…
Walkable amenities ~0.75 mi
Loading nearby amenities…
Taxation est. · year 1
- Rental income
- $19,617
- − Mortgage interest
- −$3,266
- − Property taxes
- −$874
- − Insurance
- −$292
- − Repairs & maintenance
- −$1,569
- − Management
- −$1,569
- − Depreciation
- −$1,696
- Taxable income
- $10,351
- Est. tax owed @ 24.0%
- −$2,484
- After-tax cash flow
- $8,179/yr
For passive investors: Depreciation is non-cash, so a rental often shows a tax loss while cash-flowing — sheltering income. Rental losses are passive: they offset passive income freely, and up to $25,000/yr can offset ordinary (W-2) income if you actively participate and your MAGI is under $100k (phasing out to $0 by $150k); unused losses carry forward. On sale, claimed depreciation is recaptured at up to 25%, and gains may owe capital-gains tax (a 1031 exchange can defer both). Figures are a year-1 estimate at your 24.0% rate — not tax advice; consult a CPA.
Condition & rehab AI · 13 photos
This brand new 3-bedroom, 2-bathroom manufactured home is move-in ready with excellent condition and no visible repairs needed. It offers a modern and comfortable living space with premium features and amenities.
Value-add opportunities
- Both Painting the exterior siding — Fresh paint can enhance curb appeal and add value.
- Both Landscaping improvements — Enhanced landscaping can improve curb appeal and attract potential buyers/tenants.
- Both Adding smart home features — Smart home features can increase both resale and rental value by making the home more modern and convenient.
Renovation cost estimate screening
Value-add ROI direction
- Both Painting the exterior siding — Fresh paint can enhance curb appeal and add value. ↑
- Both Landscaping improvements — Enhanced landscaping can improve curb appeal and attract potential buyers/tenants. ↑
- Both Adding smart home features — Smart home features can increase both resale and rental value by making the home more modern and convenient. ↑
ⓘ Cost ranges are severity-bucket heuristics (US national rule-of-thumb). Get contractor quotes + a written scope before underwriting a rehab budget.
Schools (NCES district)
- District
- Elida Local
- NCES district ID
- 3904577
- Math proficiency
- 59% ▼ -11.00%
- Reading proficiency
- 59% ▼ -7.00%
- Median HH income
- $46,632
- Composite
- 49.93/100
- National rank
- #1934
- State rank
- #311 of 656 in OH
Livability — Lima
- Score
- 64/100
- State rank
- #787
- US rank
- #14288
Category grades
Schools grade is shown separately in the Schools card above.
Census & demographics
- County
- Allen · 98,169 people
- City population
- 21,739
- Metro
- Lima, OH
- Population (ZIP)
- 11,631
- Household income
- $74,387
- Rent vs Own
- Severe rent burden
- 6.3
Population outlook (Allen County) Hauer SSP2
- Today (2025)
- 100,321 people
- By 2030
- 97,693 · -2.6%
- By 2040
- 91,802 · -8.5%
- By 2050
- 86,152 · -14.1%
- By 2075
- 73,659 · -26.6%
- By 2100
- 58,716 · -41.5%
Race, ethnicity, and origin ACS 2023
- Neighborhood character
- Predominantly White (90%)
- Race & ethnicity
- White 90% Black 5% Two or more races 4% Hispanic / Latino 2%
- Common ancestry
- Lithuanian 2% Iranian 1% Romanian 1%
- Foreign-born
- 2% · Canada, South Korea
- Languages at home
- 98% English-only · Spanish 1%
Political lean MEDSL · Allen
- 2024 margin
- Solid R (+44.1) · D 27.5% · R 71.6%
- 2008→2024 swing
- -23.4pp toward R · 2008: -20.7pp · 2024: -44.1pp
- All cycles
- 2024: R+44.1 2020: R+39.5 2016: R+38.2 2012: R+25.7 2008: R+20.7
Not yet ingested
- Civics
- —
Market trends
- HPI YoY
- ▲ 36.64%
- Current HPI
- 468.59
- Rent YoY
- —
- Metro
- —
- State GDP YoY
- ▲ 1.98%
- F500 in state
- 48
Industry mix (Fortune 500 HQ in OH)
| Industry | F500 HQs | Revenue |
|---|---|---|
| Insurance | 3 | $145B |
|
||
| Industrial Machinery | 3 | $49B |
|
||
| Financial Services | 3 | $24B |
|
||
| Consumer Goods | 2 | $93B |
|
||
| Aerospace / Defense | 2 | $47B |
|
||
| Utilities | 2 | $33B |
|
||
Cash-flow waterfall
monthlySold comps — $/sqft
last 12 mo · ≤1 miLoading sold comps…