 🌊 Lakefront
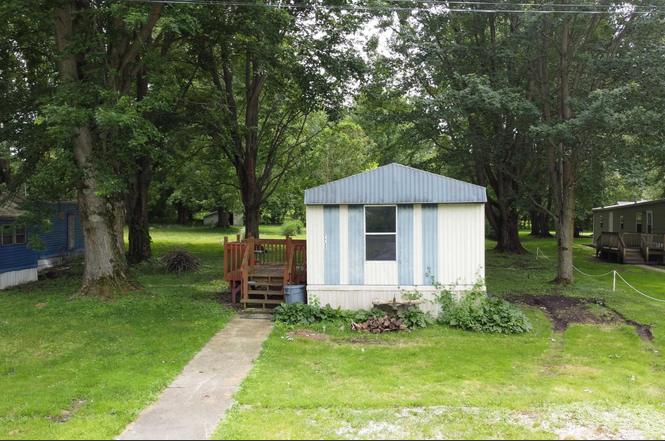
7735 W Swick Rd Rd · Beaver Dam, IN
Flood risk 1/10 · Minimal
- FEMA flood zone
- X (unshaded)
- Chance of flooding over 30 yrs
- 0.0%
- Est. flood insurance / yr
- $507 – $1,088
Fire risk 3/10 · Minor
- Est. fire insurance / yr
- $717 – $1,331
Heat risk 2/10 · Minimal
- Hot days now (above 100°F)
- 7 days/yr
- Hot days in 30 yrs
- 16 days/yr
Wind risk 2/10 · Minimal
- Chance of severe wind over 30 yrs
- —
Air-quality risk 3/10 · Minor
- Unhealthy air days now
- 2 days/yr
- Unhealthy air days in 30 yrs
- 3 days/yr
Risk factors via First Street. Map © Google.
Why this score? — see what drove the B- grade
The composite is a weighted blend of 9 inputs, each scored 0–100. Each bar is that input's sub-score; the figure is the points it added to the 100-point composite (weight × sub-score).
- Cash flow +30.0/30.0
- DSCR +10.0/10.0
- 1% rule +7.9/10.0
- ARV discount +7.5/15.0
- Schools +3.5/10.0
- Rent growth +2.5/5.0
- Livability +2.5/5.0
- Condition / age +2.5/5.0
- Appreciation +0.0/10.0
$69,000
🖨 Deal sheet (PDF) 📄 Offer letter ✓ Due diligence
Listing remarks MLS
Looking for a place at the lake with a nice view but something affordable with NO LOT RENT? This is it! Beautiful view of Beaver Dam Lake located directly across the road at the end of a quiet, private, no outlet road. Beautifully updated 1988 single wide manufactured home with newer kitchen cabinets, countertops and flooring. Newer bathroom updates. Nice deck for sitting in the evenings and relaxing. Nice lot size at 56' X 254' with room to expand or add on. Home features gas forced air. Central air could easily be added. Home comes with range, refrigerator, window air conditioner, washer and dryer. This is the perfect place for weekends, or to live in all year. Could also be used as a rental. Public boat launch is about 5 minutes away. Ski from 1pm to 4pm. There is no rentable dock space on this lake. Swimming is at the public boat launch.
Key facts
- Lake front
- Public access
- Storage shed
Tags
Property features AI
Finance
- Other: Lot dimensions approximately 56 x 254 (0.34 acre)
- HOA & community: No association amenities
Exterior
- Parking: Gravel parking
- Utilities: Private well water; Septic tank; Cable connected
- Home design: Manufactured home; Single-story
- Construction: Vinyl siding; Metal roof; Built as manufactured/mobile home
- Exterior features: Deck; Shed(s); Level, wooded lot with views; Lake privileges on Beaver Dam Lake; Lake view
Interior
- Kitchen: Gas cooktop; Gas oven; Microwave; Refrigerator; Exhaust fan
- Bedrooms: Master on main level
- Flooring: Carpet; Laminate
- Bathrooms: 1 full bathroom (main level)
- Heating & cooling: Natural gas heating; Electric heating; Wall-mounted cooling unit
- Interior features: Eat-in kitchen; Laminate countertops; Master bedroom on main level; One fireplace (noneoperative/not specified)
- Laundry & utility: Washer hookup (main level); Electric dryer hookup (main level); Washer included; Dryer included; Water heater (electric); Water softener (rented)
Neighborhood map
What this means for you Summary
Snapshot
- This is a 2-bed/1.0-bath manufactured listed at $69k.
Deal economics
- At list price, monthly cash flow is $275 ($3k/yr) — positive.
- The deal already cash-flows at list — no discount required.
- Meets the 1% rule at list price ($889 rent vs $69k).
Location & tenants
- Location reads: area grade B — affects rentability + tenant quality, not the cash-flow math above.
- Tippecanoe Valley School Corporation (rural): math 40% / reading 42% proficiency, ranked #126 of 301 in IN (top 42%) — families likely to look elsewhere, expect single-tenant / working-renter base with shorter leases.
- Zoned schools: Akron Elementary School (math 37% / reading 37%, grade F, #550 of 994 statewide, top 57%, 385 students, 56% FRL).
- Market conditions: 8 active listings in the ZIP; 261 units permitted in Kosciusko County in 2024 (10 in 5+ unit buildings).
Forward outlook
- Local home prices are declining (-3.0%/yr); year-one equity from $477 of loan paydown is wiped out by about $2k of value loss. Plan a longer hold.
- Kosciusko County population projected at +3% by 2050 — modest demand growth; plan on rents tracking national, not racing it.
- At projected returns (-3.0% appreciation + 3.0% rent growth), your $19k cash investment doubles in ~8 years — after that, you're playing with house money.
Negotiation context
- Only 1 days on market — expect competitive offers; lowballing is unlikely to land.
- 2 sale attempts since 3y ago with the ask held roughly flat each time — persistent listings suggest the price (not the market) is what's stuck; bring a comps-based counter.
- Current owner paid $48k; 45% above their basis — modest negotiation headroom, anchor on the comps not their cost.
Questions for the listing agent
- Is there a deadline driving the sale (1031 exchange, divorce, estate, relocation)? That informs how much negotiation room exists.
- This sits on a lake — are riparian / water-frontage rights deeded with the parcel? Any dock permits, shoreline easements, or HOA water-use restrictions?
- What's the documented flood / surge / shoreline-erosion history here (FEMA AND non-FEMA — e.g., storm surge, creek backup, septic-field saturation)?
- Any water-quality or seasonal algae-bloom issues that affect tenant satisfaction or short-term-rental demand?
- What's the average days-on-market for RENTAL listings here right now (not sales)? A rising rental-DOM trend means longer vacancies and softer asking-rent achievability than the comps imply.
- What's the recent tenant-quality profile in this submarket — average credit score on applications, eviction rate, late-payment / NSF rate, and stable-employment percentage? A property-management company in the area should have these aggregated.
- How much new for-sale + rental construction is in the pipeline within 1–3 miles? Heavy new supply typically softens prices + rents 12–24 months out; constrained supply supports both.
Investment metrics
- 1% rule
- 1.29% ✓
- Cap rate
- 11.08%
- Cash-on-cash
- 17.08%
- DSCR
- 1.76
- GRM
- 6.5
CMA / ARV
No comps found within radius.
Projected returns pro-forma
-3.0% appreciation · 3.0% rent growth · sell at horizon
- IRR
- 8.3%
- Equity multiple
- 1.33×
- Total profit
- $6,315
- Equity at exit
- $10,288
- IRR
- 17.6%
- Equity multiple
- 2.45×
- Total profit
- $27,980
- Equity at exit
- $5,966
Cash invested: $19,320 (down + closing). Projections, not guarantees.
Landlord ↔ Tenant lean methodology
- Overall (STATE)
- 90 Strongly Landlord-Friendly
- State Indiana
- 90 Strongly Landlord-Friendly · R+11
- County
- — inherits STATE
- City
- — inherits STATE
ZIP-level market 46510
- Home prices YoY
- -7.4%
- Active inventory
- 8
- Price-to-rent
- 6.5×
Monthly cashflow live
- Estimated rent
- $889 medium interval (Pro) →
- Mortgage (P&I)
- −$362
- Tax from tax record
- −$36 /mo · $437/yr
- Insurance
- −$29
- HOA
- −$0
- Vacancy / Maint / Mgmt
- −$187
- Net cashflow
- $275
Break-even live
Sensitivity live
| Price | -10% $314 | -5% $295 | +0% $275 | +5% $255 | +10% $236 |
|---|---|---|---|---|---|
| Rent | -10% $205 | -5% $240 | +0% $275 | +5% $310 | +10% $345 |
| Rate | -1.0pp $310 | -0.5pp $293 | base $275 | +0.5pp $257 | +1.0pp $239 |
UW: 25.0% down · 7.5% · 30yr · 1.5% tax · 5.0% vac · 8.0% maint · 8.0% mgmt
Financing live
Cash to close
- Down payment
- $17,250
- Closing costs
- $2,070
- Reserves months
- —
- Total cash needed
- —
Loan-product check · same deal, 3 products live
Conventional
25% down · 7.5% · 30yr
- Down + closing
- —
- Monthly P&I
- —
- Monthly cashflow
- —
- DSCR
- —
- Eligible?
- —
Personal DTI + credit; lowest rate.
DSCR
20% down · 8.5% · 30yr
- Down + closing
- —
- Monthly P&I
- —
- Monthly cashflow
- —
- DSCR
- —
- Eligible?
- —
No personal income docs; deal must DSCR.
Hard money
10% down · 12.0% · 12mo
- Down + closing
- —
- Monthly P&I
- —
- Monthly cashflow
- —
- DSCR
- —
- Eligible?
- —
Short-term bridge; refi at stabilization.
Listing history 2 events
-
2026-06-18remarks 699-char remark
-
2026-06-18$69,000 Active 1 DOM
ⓘ Source: listings_history table (triggers on properties + properties_extension) + one-shot
backfill from property_details.listing_events for pre-trigger history.
Tax reassessment forecast IN · Partial reset (capped growth)
- Current annual tax
- $437 · $36/mo
- Projected year-2 tax
- $512 · $43/mo
- Expected delta
- +$75/yr (+$6/mo · 17.2%)
ⓘ Screening estimate from a state-policy table — verify with the county assessor before closing.
Climate risk First Street
- Flood 1/10 Low FEMA zone X (unshaded) · 0% chance over 30 yrs
- Wildfire 3/10 Moderate
- Heat 2/10 Low 7 d/yr ≥100°F today · 16 d/yr by 30 yrs out
- Wind 2/10 Low
- Air quality 3/10 Moderate 2 unhealthy d/yr today · 3 by 30 yrs out
Nearby sold comps map
Loading sold comps map…
Walkable amenities ~0.75 mi
Loading nearby amenities…
Taxation est. · year 1
- Rental income
- $10,663
- − Mortgage interest
- −$3,865
- − Property taxes
- −$437
- − Insurance
- −$345
- − Repairs & maintenance
- −$853
- − Management
- −$853
- − Depreciation
- −$2,007
- Taxable income
- $2,303
- Est. tax owed @ 24.0%
- −$553
- After-tax cash flow
- $2,747/yr
For passive investors: Depreciation is non-cash, so a rental often shows a tax loss while cash-flowing — sheltering income. Rental losses are passive: they offset passive income freely, and up to $25,000/yr can offset ordinary (W-2) income if you actively participate and your MAGI is under $100k (phasing out to $0 by $150k); unused losses carry forward. On sale, claimed depreciation is recaptured at up to 25%, and gains may owe capital-gains tax (a 1031 exchange can defer both). Figures are a year-1 estimate at your 24.0% rate — not tax advice; consult a CPA.
Schools (NCES district)
- District
- Tippecanoe Valley School Corporation
- NCES district ID
- 1811370
- Math proficiency
- 40% ▼ -9.00%
- Reading proficiency
- 42% ▼ -5.00%
- Median HH income
- $49,697
- Composite
- 35.29/100
- National rank
- #4969
- State rank
- #126 of 301 in IN
Livability — Beaver Dam
No livability data for this city. (Only ~50 U.S. cities are tracked.)
Census & demographics
- Census place
- Beaver Dam, IN
- Population (ZIP)
- 3,154
Population outlook (Kosciusko County) Hauer SSP2
- Today (2025)
- 81,747 people
- By 2030
- 82,878 · +1.4%
- By 2040
- 84,270 · +3.1%
- By 2050
- 84,191 · +3.0%
- By 2075
- 82,918 · +1.4%
- By 2100
- 74,808 · -8.5%
Race, ethnicity, and origin ACS 2023
- Neighborhood character
- Predominantly White (91%)
- Race & ethnicity
- White 91% Hispanic / Latino 6% Two or more races 6%
- Hispanic origin (detail)
- Mexican 4%
- Common ancestry
- Iranian 6% Romanian 2% Slovak 2%
- Foreign-born
- 2% · Canada
- Languages at home
- 98% English-only · Spanish 2%
Political lean MEDSL · Kosciusko
- 2024 margin
- Solid R (+52.3) · D 22.9% · R 75.2% · Other 1.9%
- 2008→2024 swing
- -14.9pp toward R · 2008: -37.3pp · 2024: -52.3pp
- All cycles
- 2024: R+52.3 2020: R+50.7 2016: R+55.1 2012: R+52.2 2008: R+37.3
Not yet ingested
- Civics
- —
Market trends
- HPI YoY
- ▼ -21.80%
- Current HPI
- 273.6282
- Rent YoY
- —
- Metro
- —
- State GDP YoY
- ▲ 2.90%
- F500 in state
- 18
Industry mix (Fortune 500 HQ in IN)
| Industry | F500 HQs | Revenue |
|---|---|---|
| Industrial Machinery | 2 | $37B |
|
||
| Healthcare | 1 | $177B |
|
||
| Pharmaceuticals | 1 | $45B |
|
||
| Metals / Steel | 1 | $18B |
|
||
| Agriculture | 1 | $17B |
|
||
| Packaging | 1 | $12B |
|
||
Price history
+15.2% since first listed7 events — show timeline
- 2026-06-17 Listed $69,000 IRMLS
- 2023-05-05 Sold (MLS) $47,500 IRMLS
- 2023-04-27 Pending — IRMLS
- 2023-04-21 Contingent — IRMLS
- 2023-04-11 Pending — IRMLS
- 2023-04-05 Price Changed $57,500 IRMLS
- 2023-03-16 Listed $59,900 IRMLS
Property tax history
+9.4%/yrLatest (2024): $437 · +328.3% YoY. Source: county tax records.
Cash-flow waterfall
monthlySold comps — $/sqft
last 12 mo · ≤1 miLoading sold comps…