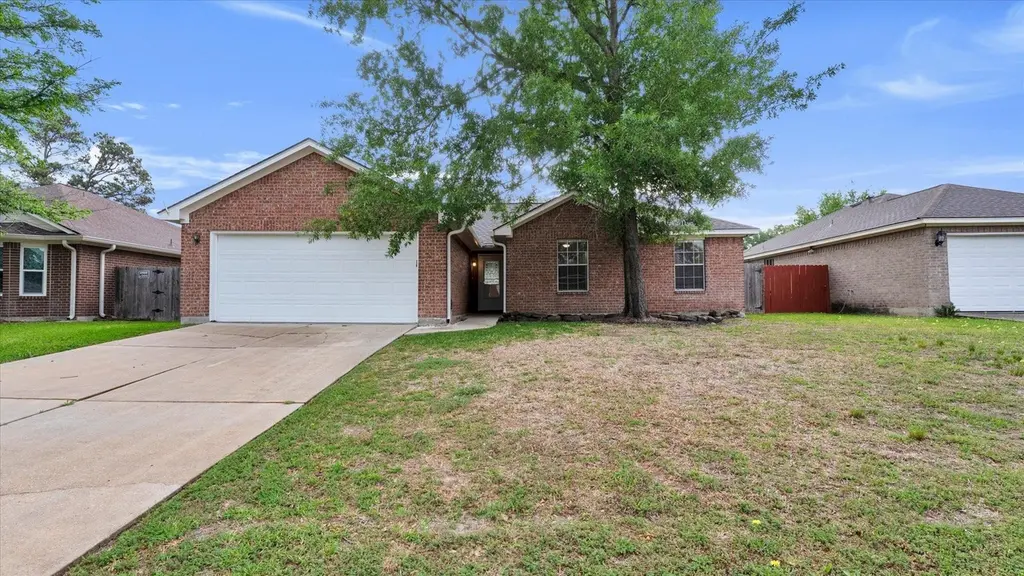
16895 Bob White · The Woodlands, TX
Flood risk 1/10 · Minimal
- FEMA flood zone
- X (unshaded)
- Chance of flooding over 30 yrs
- 0.0%
- Est. flood insurance / yr
- $507 – $1,088
Fire risk 4/10 · Minor
- Est. fire insurance / yr
- $1,222 – $2,270
Heat risk 9/10 · Severe
- Hot days now (above 111°F)
- 7 days/yr
- Hot days in 30 yrs
- 26 days/yr
Wind risk 8/10 · Major
- Chance of severe wind over 30 yrs
- 99.0%
Air-quality risk 3/10 · Minor
- Unhealthy air days now
- 2 days/yr
- Unhealthy air days in 30 yrs
- 3 days/yr
Risk factors via First Street. Map © Google.
Why this score? — see what drove the D- grade
The composite is a weighted blend of 9 inputs, each scored 0–100. Each bar is that input's sub-score; the figure is the points it added to the 100-point composite (weight × sub-score).
- Cash flow +10.4/30.0
- ARV discount +5.1/15.0
- Schools +5.1/10.0
- Livability +4.5/5.0
- 1% rule +3.5/10.0
- Rent growth +3.5/5.0
- DSCR +3.0/10.0
- Condition / age +2.5/5.0
- Appreciation +0.0/10.0
$235,000
🖨 Deal sheet (PDF) 📄 Offer letter ✓ Due diligence
Listing remarks
UPDATES! UPDATES! Come and see this newly renovated home. New interior paint. New appliances in the kitchen: Stainless steel Refrigerator, Stove, Microwave, and stainless-steel dishwasher. The home has been updated with new countertops in the kitchen, breakfast bar, and bathrooms. New flooring throughout the home. Faux wood in the living area, new tile in the kitchen, bathrooms, and laundry room. New carpet in Bedrooms. New interior paint, faux wood blinds on windows. New lighting fixtures. New back door and screen door. The new AC compressor in the backyard was replaced in 2022. New smart thermostat installed in August of 2025. Water heater in garage replaced in 2022. The roof was replaced
Key facts
- 6,403 sq ft lot
- 2 garage spots
- Community pool
Property features AI
Finance
- Other: Municipal Utility District disclosure; Seller disclosure
- HOA & community: Has association (Gleneagles Community Association); Association amenities include pool; Association fee includes recreation facilities; Community features: community pool, curbs
Exterior
- Parking: Attached 2-car garage; Driveway; Garage door opener
- Security: Smoke detector(s)
- Utilities: Public water; Public sewer
- Home design: Residential property; Faces west; Full ownership; Slab foundation; Built in 2001
- Construction: Brick and cement siding exterior; Composition roof
- Exterior features: Fenced backyard; Tennis court(s); Association pool
Interior
- Kitchen: Dishwasher; Electric cooktop; Electric oven; Disposal; Ice maker; Microwave; ENERGY STAR qualified appliances; Refrigerator
- Bedrooms: 3 possible bedrooms
- Flooring: Carpet; Plank; Tile; Vinyl
- Bathrooms: 2 full bathrooms
- Heating & cooling: Central heating (electric); Central air (electric); Has heating; Has cooling
- Interior features: Breakfast bar; Double vanity; High ceilings; Kitchen/family room combo; Window treatments; Ceiling fan(s); Window coverings
- Laundry & utility: Washer hookup; Electric dryer hookup
Neighborhood map
What this means for you Summary
Snapshot
- This is a 3-bed/2.0-bath single-family listed at $235k.
Deal economics
- At list price, monthly cash flow is $-124 ($-1k/yr) — negative.
- To cash-flow at today's rent, offer at most $213k (9.4% below list).
- To meet the 1% rule (rent ≥ 1% of price), the offer needs to be $199k (15.5% below list).
- Recommended offer: $199k (15.5% below list) — sets the bar for 1% rule.
- Cap rate 5.7% vs local median 2.3% in The Woodlands — top-decile yield for the area; either an underpriced asset or a hidden risk that comps aren't pricing in. Stress-test before assuming the spread holds.
Location & tenants
- Location reads 91/100 on livability (#1 in TX, #47 nationally) — a professional / high-income tenant draw. Strengths: amenities A+, commute A+, employment A+; Watch: cost of living D-.
- Conroe ISD (other): math 57% / reading 57% proficiency, ranked #69 of 826 in TX (top 8%) — acceptable for families but not a draw, mixed tenant base, ~2y average lease.
- Zoned schools: Oak Ridge El (math 47% / reading 42%, grade F, #1,155 of 4,322 statewide, top 29%, 624 students, 66% FRL); Oak Ridge H S (math 48% / reading 62%, grade C, #373 of 1,632 statewide, top 23%, 2,672 students, 42% FRL) — zoned schools average 54% FRL vs 34% district-wide (20 pts higher); higher-poverty schools than district average — tighter screening recommended.
- Market conditions: Rents rising (+3.9%/yr); 316 active listings in the ZIP; 4 comparable units currently listed for rent nearby; rentals leasing fast (median 8d on market — plan ~1-2 weeks tenant-placement turnaround); high-income renter base; 13,259 units permitted in Montgomery County in 2024 (1,402 in 5+ unit buildings).
Forward outlook
- Local home prices are declining (-3.0%/yr); year-one equity from $2k of loan paydown is wiped out by about $7k of value loss. Plan a longer hold.
- Montgomery County population projected at +65% by 2050 — long-run rental-demand tailwind backs the buy-and-hold thesis.
Negotiation context
- Only 5 days on market — expect competitive offers; lowballing is unlikely to land.
- 2 sale attempts with the ask held roughly flat each time — persistent listings suggest the price (not the market) is what's stuck; bring a comps-based counter.
Risks & watch-outs
- Climate carrying-cost: severe wind risk, 99% chance of damaging wind over 30y; extreme-heat days projected 7→26/yr by 2055 (HVAC capex compounding) — expect insurance premiums to compound above CPI over the hold.
Questions for the listing agent
- What do current leases actually rent for vs. the listed asking? Can we see a recent rent roll and the last 12 months of T-12 income?
- Is there a deadline driving the sale (1031 exchange, divorce, estate, relocation)? That informs how much negotiation room exists.
- Schools are A-rated — typically a magnet for longer-tenancy family renters. What's the average tenant stay here, and is there a school-zone premium baked into asking?
- The area grade is low — what's the realistic commute time and amenity access for the typical tenant pool here? Any planned neighborhood developments (good or bad) we should know about?
- What's the average days-on-market for RENTAL listings here right now (not sales)? A rising rental-DOM trend means longer vacancies and softer asking-rent achievability than the comps imply.
- What's the recent tenant-quality profile in this submarket — average credit score on applications, eviction rate, late-payment / NSF rate, and stable-employment percentage? A property-management company in the area should have these aggregated.
- How much new for-sale + rental construction is in the pipeline within 1–3 miles? Heavy new supply typically softens prices + rents 12–24 months out; constrained supply supports both.
Investment metrics
- 1% rule
- 0.85% ✗
- Cap rate
- 5.66%
- Cash-on-cash
- -2.27%
- DSCR
- 0.90
- GRM
- 9.9
CMA / ARV
- ARV (on-the-fly)
- $222,870
- Comps found
- 12
Show comp detail 12 sales within ~0.75 mi
| Address | Dist | Beds/Ba | Sqft | Sold | Price | $/sf | Match |
|---|---|---|---|---|---|---|---|
| 16947 Hummingbird | 0.16mi | 3/2.0 | 1,302 (-1%) | 3mo | $200,000 | $154 | 89 |
| 16926 Hummingbird | 0.10mi | 3/2.0 | 1,328 (+1%) | 13mo | $229,990 | $173 | 83 |
| 9809 Wren Ct | 0.13mi | 3/2.0 | 1,403 (+7%) | 1mo | $229,000 | $163 | 82 |
| 9813 Wren Ct | 0.11mi | 3/2.0 | 1,352 (+3%) | 14mo | $230,000 | $170 | 78 |
| 16942 Meadowlark St | 0.16mi | 3/2.0 | 1,357 (+4%) | 10mo | $205,000 | $151 | 78 |
| 9808 Wren Ct | 0.14mi | 3/2.0 | 1,372 (+5%) | 16mo | $225,000 | $164 | 72 |
| 16947 Meadowlark St | 0.16mi | 4/2.0 (+1) | 1,273 (-3%) | 13mo | $225,000 | $177 | 72 |
| 9807 Toucan Ln | 0.14mi | 4/2.0 (+1) | 1,434 (+9%) | 6mo | $220,000 | $153 | 68 |
| 16886 Canary St | 0.09mi | 3/2.0 | 1,144 (-13%) | 9mo | $250,000 | $219 | 67 |
| 16838 Gleneagle Dr N | 0.26mi | 3/2.0 | 1,217 (-7%) | 11mo | $235,000 | $193 | 66 |
| 9836 Oriole | 0.27mi | 3/2.0 | 1,244 (-5%) | 19mo | $219,000 | $176 | 63 |
| 16742 Gleneagle Dr N | 0.53mi | 3/2.0 | 1,470 (+12%) | 16mo | $194,000 | $132 | 42 |
Match score weights: distance 35% · size 25% · config 20% · recency 20%. Top-matched comps best support the ARV.
Projected returns pro-forma
-3.0% appreciation · 3.88% rent growth · sell at horizon
- IRR
- -19.0%
- Equity multiple
- 0.33×
- Total profit
- $-44,155
- Equity at exit
- $35,039
- IRR
- -9.7%
- Equity multiple
- 0.38×
- Total profit
- $-40,941
- Equity at exit
- $20,319
Cash invested: $65,800 (down + closing). Projections, not guarantees.
Landlord ↔ Tenant lean methodology
- Overall (STATE)
- 87 Strongly Landlord-Friendly
- State Texas
- 87 Strongly Landlord-Friendly · R+5
- County
- — inherits STATE
- City
- — inherits STATE
ZIP-level market 77385
- Home prices YoY
- -27.5%
- Rents YoY
- 3.9%
- Active inventory
- 316
- Price-to-rent
- 9.9×
Monthly cashflow live
- Estimated rent
- $1,987 medium interval (Pro) →
- Mortgage (P&I)
- −$1,232
- Tax from tax record
- −$364 /mo · $4,364/yr
- Insurance
- −$98
- HOA
- −$0
- Vacancy / Maint / Mgmt
- −$417
- Net cashflow
- $-124
Break-even live
Sensitivity live
| Price | -10% $9 | -5% $-58 | +0% $-124 | +5% $-191 | +10% $-257 |
|---|---|---|---|---|---|
| Rent | -10% $-281 | -5% $-203 | +0% $-124 | +5% $-46 | +10% $33 |
| Rate | -1.0pp $-6 | -0.5pp $-65 | base $-124 | +0.5pp $-185 | +1.0pp $-247 |
UW: 25.0% down · 7.5% · 30yr · 1.5% tax · 5.0% vac · 8.0% maint · 8.0% mgmt
Financing live
Cash to close
- Down payment
- $58,750
- Closing costs
- $7,050
- Reserves months
- —
- Total cash needed
- —
Loan-product check · same deal, 3 products live
Conventional
25% down · 7.5% · 30yr
- Down + closing
- —
- Monthly P&I
- —
- Monthly cashflow
- —
- DSCR
- —
- Eligible?
- —
Personal DTI + credit; lowest rate.
DSCR
20% down · 8.5% · 30yr
- Down + closing
- —
- Monthly P&I
- —
- Monthly cashflow
- —
- DSCR
- —
- Eligible?
- —
No personal income docs; deal must DSCR.
Hard money
10% down · 12.0% · 12mo
- Down + closing
- —
- Monthly P&I
- —
- Monthly cashflow
- —
- DSCR
- —
- Eligible?
- —
Short-term bridge; refi at stabilization.
Rent comps 4 comps
| Address | Beds | Baths | Sqft | Rent | $/sqft | DOM | Units | Dist |
|---|---|---|---|---|---|---|---|---|
| 9819 Kiwi Ln Conroe, TX | 4.0 | 2.0 | 1434 | $1,826 | $1.27 | 7d | 1 | 0.14mi |
| 17116 Harpers Trce Conroe, TX | 1.0–3.0 | 1.0–2.0 | 1083 | $1,948 | $1.80 | 2d | 28 | 0.52mi |
| 17011 Harpers Way Conroe, TX | 1.0–2.0 | 1.0–2.0 | 922 | $1,683 | $1.83 | 2d | 14 | 0.78mi |
| 17011 Harper's Way Unit 17068 Conroe, TX | 2.0 | 2.0 | 1073 | $1,475 | $1.37 | 44d | 1 | 0.78mi |
Listing history 6 events
-
2026-06-18days on market $235,000 Active 5 DOM
-
2026-06-17days on market $235,000 Active 4 DOM
-
2026-06-16days on market $235,000 Active 3 DOM
-
2026-06-15days on market $235,000 Active 2 DOM
-
2026-06-13remarks 699-char remark
-
2026-06-13$235,000 Active 1 DOM
ⓘ Source: listings_history table (triggers on properties + properties_extension) + one-shot
backfill from property_details.listing_events for pre-trigger history.
Tax reassessment forecast TX · Resets to sale price
- Current annual tax
- $4,364 · $364/mo
- Projected year-2 tax
- $4,364 · $364/mo
- Expected delta
- $0/yr ($0/mo · 0.0%)
ⓘ Screening estimate from a state-policy table — verify with the county assessor before closing.
Climate risk First Street
- Flood 1/10 Low FEMA zone X (unshaded) · 0% chance over 30 yrs
- Wildfire 4/10 Moderate
- Heat 9/10 Extreme 7 d/yr ≥111°F today · 26 d/yr by 30 yrs out
- Wind 8/10 Severe 99% chance of damaging wind over 30 yrs
- Air quality 3/10 Moderate 2 unhealthy d/yr today · 3 by 30 yrs out
Nearby sold comps map
Loading sold comps map…
Walkable amenities ~0.75 mi
Loading nearby amenities…
Taxation est. · year 1
- Rental income
- $23,842
- − Mortgage interest
- −$13,164
- − Property taxes
- −$4,364
- − Insurance
- −$1,175
- − Repairs & maintenance
- −$1,907
- − Management
- −$1,907
- − Depreciation
- −$6,836
- Taxable loss
- −$5,512
- Est. tax savings @ 24.0%
- +$1,323
- After-tax cash flow
- $-170/yr
For passive investors: Depreciation is non-cash, so a rental often shows a tax loss while cash-flowing — sheltering income. Rental losses are passive: they offset passive income freely, and up to $25,000/yr can offset ordinary (W-2) income if you actively participate and your MAGI is under $100k (phasing out to $0 by $150k); unused losses carry forward. On sale, claimed depreciation is recaptured at up to 25%, and gains may owe capital-gains tax (a 1031 exchange can defer both). Figures are a year-1 estimate at your 24.0% rate — not tax advice; consult a CPA.
Schools (NCES district)
- District
- Conroe ISD
- NCES district ID
- 4815000
- Math proficiency
- 57% ▼ -6.00%
- Reading proficiency
- 57% ▼ -1.00%
- Median HH income
- $71,541
- Composite
- 50.65/100
- National rank
- #1833
- State rank
- #69 of 826 in TX
Livability — The Woodlands
- Score
- 91/100
- State rank
- #1
- US rank
- #47
Category grades
Schools grade is shown separately in the Schools card above.
Census & demographics
- County
- Montgomery County · 663,713 people
- City population
- 106,505
- Metro
- Houston-The Woodlands-Sugar Land, TX
- Population (ZIP)
- 28,156
- Household income
- $117,118
- Rent vs Own
- Severe rent burden
- 471.0
Population outlook (Montgomery County) Hauer SSP2
- Today (2025)
- 713,896 people
- By 2030
- 805,263 · +12.8%
- By 2040
- 992,708 · +39.1%
- By 2050
- 1,179,590 · +65.2%
- By 2075
- 1,628,084 · +128.1%
- By 2100
- 1,937,880 · +171.5%
Race, ethnicity, and origin ACS 2023
- Neighborhood character
- Diverse neighborhood (Simpson 0.63)
- Race & ethnicity
- White 53% Hispanic / Latino 27% Two or more races 16% Black 11% Asian 5%
- Hispanic origin (detail)
- Mexican 15% Puerto Rican 2% Cuban 1%
- Common ancestry
- Slovak 3% Romanian 2% Italian 2%
- Foreign-born
- 15% · Canada, Jamaica, Vietnam
- Languages at home
- 76% English-only · Spanish 16% Other Indo-European 2% Other Asian/Pacific 1%
Political lean MEDSL · Montgomery
- 2024 margin
- Solid R (+45.5) · D 26.8% · R 72.3%
- 2008→2024 swing
- +7.2pp toward D · 2008: -52.7pp · 2024: -45.5pp
- All cycles
- 2024: R+45.5 2020: R+43.8 2016: R+51.4 2012: R+60.7 2008: R+52.7
Not yet ingested
- Civics
- —
Market trends
- HPI YoY
- ▼ -91.09%
- Current HPI
- 239.9434
- Rent YoY
- ▲ 3.88%
- Metro
- Houston-The Woodlands-Sugar Land, TX
- State GDP YoY
- ▲ 3.95%
- F500 in state
- 110
Industry mix (Fortune 500 HQ in TX)
| Industry | F500 HQs | Revenue |
|---|---|---|
| Energy | 16 | $1,198B |
|
||
| Technology | 5 | $198B |
|
||
| Engineering / Construction | 4 | $72B |
|
||
| Energy Services | 3 | $60B |
|
||
| Utilities | 3 | $41B |
|
||
| Healthcare | 2 | $330B |
|
||
Price history
+0.0% since first listed4 events — show timeline
- 2026-06-13 Listed $235,000 HARMLS
- 2026-04-20 Pending — HARMLS
- 2026-04-20 Listing Removed — HARMLS
- 2026-04-01 Listed $235,000 HARMLS
Property tax history
+1.9%/yrLatest (2025): $4,364 · -5.3% YoY. Source: county tax records.
Cash-flow waterfall
monthlySold comps — $/sqft
last 12 mo · ≤1 miLoading sold comps…