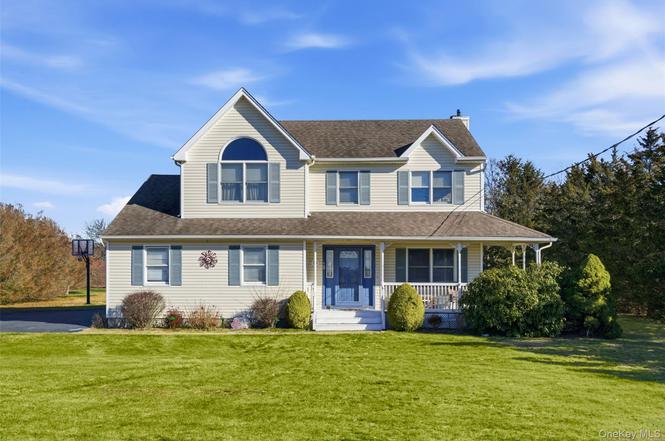
5750 Aldrich Ln · Laurel, NY
Flood risk 6/10 · Moderate
- FEMA flood zone
- X (unshaded)
- Chance of flooding over 30 yrs
- 0.68%
- Est. flood insurance / yr
- $473 – $860
Fire risk 2/10 · Minimal
- Est. fire insurance / yr
- $691 – $1,283
Heat risk 5/10 · Moderate
- Hot days now (above 91°F)
- 7 days/yr
- Hot days in 30 yrs
- 19 days/yr
Wind risk 8/10 · Major
- Chance of severe wind over 30 yrs
- 80.0%
Air-quality risk 3/10 · Minor
- Unhealthy air days now
- 2 days/yr
- Unhealthy air days in 30 yrs
- 4 days/yr
Risk factors via First Street. Map © Google.
Why this score? — see what drove the B- grade
The composite is a weighted blend of 9 inputs, each scored 0–100. Each bar is that input's sub-score; the figure is the points it added to the 100-point composite (weight × sub-score).
- Cash flow +30.0/30.0
- 1% rule +10.0/10.0
- DSCR +10.0/10.0
- Schools +6.1/10.0
- ARV discount +5.0/15.0
- Livability +3.0/5.0
- Rent growth +2.5/5.0
- Condition / age +2.5/5.0
- Appreciation +0.0/10.0
$949,000
🖨 Deal sheet 📄 Offer letter ✓ Due diligence
Listing remarks
Spacious Mattituck Colonial In the Heart of the North Fork, Featuring 4 Bedrooms and 2.5 Bathrooms, built in 1999, Full basement-725 sq. ft. with separate entrance, large property, shy 1 acre lot(. 91). , room for pool and tennis/recreation area. Close to local beaches, schools, local farm produce/products, transportation bus & LIRR.
Key facts
- 0.91 acre lot
- 2 garage spots
- Built 1999
Neighborhood map
What this means for you Summary
Snapshot
- This is a 4-bed/2.5-bath single-family listed at $949k.
Deal economics
- At list price, monthly cash flow is $8k ($94k/yr) — positive.
- The deal already cash-flows at list — no discount required.
- Meets the 1% rule at list price ($18k rent vs $949k).
- Recommended offer: $892k (6.0% below list) — sets the bar for market timing.
Location & tenants
- Location reads 60/100 on livability (#965 in NY) — a middle-class / working-renter tenant base. Strengths: crime A+, employment A+, housing B+; Watch: amenities F, commute F, cost of living F.
- Mattituck-Cutchogue Union Free School District (suburban): math 69% / reading 68% proficiency, ranked #127 of 590 in NY (top 22%) — acceptable for families but not a draw, mixed tenant base, ~2y average lease; only 16% free/reduced lunch — higher-income household profile.
- Zoned schools: Mattituck-Cutchogue Elementary School (math 65% / reading 68%, grade B+, #575 of 2,108 statewide, top 27%, 453 students, 37% FRL); Mattituck Junior-Senior High School (math 74% / reading 72%, grade B+, #670 of 1,100 statewide, top 61%, 548 students, 0% FRL) — zoned schools at 18% FRL track the district average.
- Market conditions: 49 active listings in the ZIP; 3 comparable units currently listed for rent nearby; rentals at typical pace (median 20d on market — plan ~3-4 weeks tenant-placement turnaround); 1,366 units permitted in Suffolk County in 2024 (216 in 5+ unit buildings).
Forward outlook
- Local home prices are declining (-3.0%/yr); year-one equity from $7k of loan paydown is wiped out by about $28k of value loss. Plan a longer hold.
- Suffolk County population projected to shrink 5% by 2050 — rents likely to lag national; underwrite the cash flow, not the appreciation.
- At projected returns (-3.0% appreciation + 3.0% rent growth), your $266k cash investment doubles in ~4 years — after that, you're playing with house money.
Negotiation context
- It's been on market 63 days — a 6% lower offer ($892k) is reasonable based on typical stale-listing flexibility.
Risks & watch-outs
- Climate carrying-cost: major flood risk; severe wind risk, 80% chance of damaging wind over 30y; extreme-heat days projected 7→19/yr by 2055 (HVAC capex compounding) — expect insurance premiums to compound above CPI over the hold.
Questions for the listing agent
- It's been on market 63 days. Have you received any prior offers? Is the seller open to a 6% concession, seller financing, or rate buy-down credit?
- Why hasn't it sold? Are there any deal-killer items the seller is aware of (foundation, flood, title, zoning, code violations)?
- Is there a deadline driving the sale (1031 exchange, divorce, estate, relocation)? That informs how much negotiation room exists.
- What's the average days-on-market for RENTAL listings here right now (not sales)? A rising rental-DOM trend means longer vacancies and softer asking-rent achievability than the comps imply.
- What's the recent tenant-quality profile in this submarket — average credit score on applications, eviction rate, late-payment / NSF rate, and stable-employment percentage? A property-management company in the area should have these aggregated.
- How much new for-sale + rental construction is in the pipeline within 1–3 miles? Heavy new supply typically softens prices + rents 12–24 months out; constrained supply supports both.
Investment metrics
- 1% rule
- 1.86% ✓
- Cap rate
- 16.19%
- Cash-on-cash
- 35.34%
- DSCR
- 2.57
- GRM
- 4.5
CMA / ARV
- ARV (on-the-fly)
- $899,800
- Comps found
- 3
Show comp detail 3 sales within ~0.75 mi
| Address | Dist | Beds/Ba | Sqft | Sold | Price | $/sf | Match |
|---|---|---|---|---|---|---|---|
| 5750 Aldrich Ln | 0.00mi | 4/2.5 | 2,200 (0%) | 0mo | $900,000 | $409 | 100 |
| 5660 Sound Ave | 0.65mi | 4/1.5 | 2,200 (0%) | 1mo | $740,000 | $336 | 65 |
| 1895 Aldrich Ln | 0.73mi | 3/2.5 (-1) | 2,400 (+9%) | 14mo | $1,470,000 | $613 | 34 |
Match score weights: distance 35% · size 25% · config 20% · recency 20%. Top-matched comps best support the ARV.
Projected returns pro-forma
-3.0% appreciation · 3.0% rent growth · sell at horizon
- IRR
- 30.9%
- Equity multiple
- 2.30×
- Total profit
- $344,606
- Equity at exit
- $141,499
- IRR
- 38.1%
- Equity multiple
- 4.54×
- Total profit
- $941,863
- Equity at exit
- $82,052
Cash invested: $265,720 (down + closing). Projections, not guarantees.
Landlord ↔ Tenant lean methodology
- Overall (STATE)
- 15 Strongly Tenant-Friendly
- State New York
- 15 Strongly Tenant-Friendly · D+10
- County
- — inherits STATE
- City
- — inherits STATE
ZIP-level market 11952
- Home prices YoY
- -17.2%
- Active inventory
- 49
- Price-to-rent
- 4.5×
Monthly cashflow live
- Estimated rent
- $17,684 medium interval (Pro) →
- Mortgage (P&I)
- −$4,977
- Tax from tax record
- −$774 /mo · $9,282/yr
- Insurance
- −$395
- HOA
- −$0
- Vacancy / Maint / Mgmt
- −$3,714
- Net cashflow
- $7,825
Break-even live
UW: 25.0% down · 7.5% · 30yr · 1.5% tax · 5.0% vac · 8.0% maint · 8.0% mgmt
Financing live
Cash to close
- Down payment
- $237,250
- Closing costs
- $28,470
- Reserves months
- —
- Total cash needed
- —
Loan-product check · same deal, 3 products live
Conventional
25% down · 7.5% · 30yr
- Down + closing
- —
- Monthly P&I
- —
- Monthly cashflow
- —
- DSCR
- —
- Eligible?
- —
Personal DTI + credit; lowest rate.
DSCR
20% down · 8.5% · 30yr
- Down + closing
- —
- Monthly P&I
- —
- Monthly cashflow
- —
- DSCR
- —
- Eligible?
- —
No personal income docs; deal must DSCR.
Hard money
10% down · 12.0% · 12mo
- Down + closing
- —
- Monthly P&I
- —
- Monthly cashflow
- —
- DSCR
- —
- Eligible?
- —
Short-term bridge; refi at stabilization.
Rent comps 3 comps
| Address | Beds | Baths | Sqft | Rent | $/sqft | DOM | Units | Dist |
|---|---|---|---|---|---|---|---|---|
| 6 Bay Run Riverhead, NY | 4.0 | 3.5 | 1901 | $25,000 | $13.15 | 18d | 1 | 1.00mi |
| 2415 Cox Neck Rd Mattituck, NY | 5.0 | 3.5 | 2500 | $15,000 | $6.00 | 43d | 1 | 1.14mi |
| 7 Eileen Cir Jamesport, NY | 3.0 | 2.0 | 1572 | $10,000 | $6.36 | 19d | 1 | 1.30mi |
Listing history 3 events
-
2026-04-09status Pending
-
2026-01-18$949,000 Active
-
2026-01-16historical $949,000
ⓘ Source: listings_history table (triggers on properties + properties_extension) + one-shot
backfill from property_details.listing_events for pre-trigger history.
Tax reassessment forecast NY · Partial reset (capped growth)
- Current annual tax
- $9,282 · $774/mo
- Projected year-2 tax
- $12,660 · $1,055/mo
- Expected delta
- +$3,378/yr (+$281/mo · 36.4%)
ⓘ Screening estimate from a state-policy table — verify with the county assessor before closing.
Climate risk First Street
- Flood 6/10 Major FEMA zone X (unshaded) · 68% chance over 30 yrs
- Wildfire 2/10 Low
- Heat 5/10 Major 7 d/yr ≥91°F today · 19 d/yr by 30 yrs out
- Wind 8/10 Severe 80% chance of damaging wind over 30 yrs
- Air quality 3/10 Moderate 2 unhealthy d/yr today · 4 by 30 yrs out
Nearby sold comps map
Loading sold comps map…
Walkable amenities ~0.75 mi
Loading nearby amenities…
Taxation est. · year 1
- Rental income
- $212,210
- − Mortgage interest
- −$53,159
- − Property taxes
- −$9,282
- − Insurance
- −$4,745
- − Repairs & maintenance
- −$16,977
- − Management
- −$16,977
- − Depreciation
- −$27,607
- Taxable income
- $83,463
- Est. tax owed @ 24.0%
- −$20,031
- After-tax cash flow
- $73,868/yr
For passive investors: Depreciation is non-cash, so a rental often shows a tax loss while cash-flowing — sheltering income. Rental losses are passive: they offset passive income freely, and up to $25,000/yr can offset ordinary (W-2) income if you actively participate and your MAGI is under $100k (phasing out to $0 by $150k); unused losses carry forward. On sale, claimed depreciation is recaptured at up to 25%, and gains may owe capital-gains tax (a 1031 exchange can defer both). Figures are a year-1 estimate at your 24.0% rate — not tax advice; consult a CPA.
Schools (NCES district)
- District
- Mattituck-Cutchogue Union Free School District
- NCES district ID
- 3600021
- Math proficiency
- 69% ▼ -3.00%
- Reading proficiency
- 68% ▲ 4.00%
- Median HH income
- $84,164
- Composite
- 61.4/100
- National rank
- #765
- State rank
- #127 of 590 in NY
Livability — Laurel
- Score
- 60/100
- State rank
- #965
- US rank
- #18894
Category grades
Schools grade is shown separately in the Schools card above.
Census & demographics
- Census place
- Laurel, NY
- City population
- 775
- Population (ZIP)
- 4,749
Population outlook (Suffolk County) Hauer SSP2
- Today (2025)
- 1,505,262 people
- By 2030
- 1,498,318 · -0.5%
- By 2040
- 1,471,101 · -2.3%
- By 2050
- 1,424,848 · -5.3%
- By 2075
- 1,337,157 · -11.2%
- By 2100
- 1,217,720 · -19.1%
Race, ethnicity, and origin ACS 2023
- Neighborhood character
- Predominantly White (92%)
- Race & ethnicity
- White 92% Hispanic / Latino 7% Two or more races 2%
- Hispanic origin (detail)
- Mexican 2%
- Common ancestry
- Romanian 16% Subsaharan African 5% Scotch-Irish 3%
- Foreign-born
- 12% · Canada
- Languages at home
- 84% English-only · Russian/Polish/Slavic 6% Spanish 5% French/Haitian/Cajun 2%
Political lean MEDSL · Suffolk
- 2024 margin
- Lean R (+10.0) · D 45.0% · R 55.0%
- 2008→2024 swing
- -16.0pp toward R · 2008: 6.0pp · 2024: -10.0pp
- All cycles
- 2024: R+10.0 2020: R+0.0 2016: R+8.2 2012: D+2.9 2008: D+6.0
Not yet ingested
- Civics
- —
Market trends
- HPI YoY
- ▼ -94.04%
- Current HPI
- 453.8895
- Rent YoY
- —
- Metro
- —
- State GDP YoY
- ▲ 2.60%
- F500 in state
- 92
Industry mix (Fortune 500 HQ in NY)
| Industry | F500 HQs | Revenue |
|---|---|---|
| Financial Services | 10 | $950B |
|
||
| Consumer Goods | 9 | $162B |
|
||
| Insurance | 4 | $225B |
|
||
| Telecommunications | 2 | $144B |
|
||
| Pharmaceuticals | 2 | $112B |
|
||
| Media / Entertainment | 2 | $69B |
|
||
Price history
+0.0% since first listed3 events — show timeline
- 2026-04-09 Pending — OneKey® MLS as Distributed by MLS Grid
- 2026-01-18 Listed $949,000 OneKey® MLS as Distributed by MLS Grid
- 2026-01-16 Coming Soon $949,000 OneKey® MLS as Distributed by MLS Grid
Property tax history
+0.8%/yrLatest (2025): $9,282 · +0.0% YoY. Source: county tax records.
Cash-flow waterfall
monthlySold comps — $/sqft
last 12 mo · ≤1 miLoading sold comps…