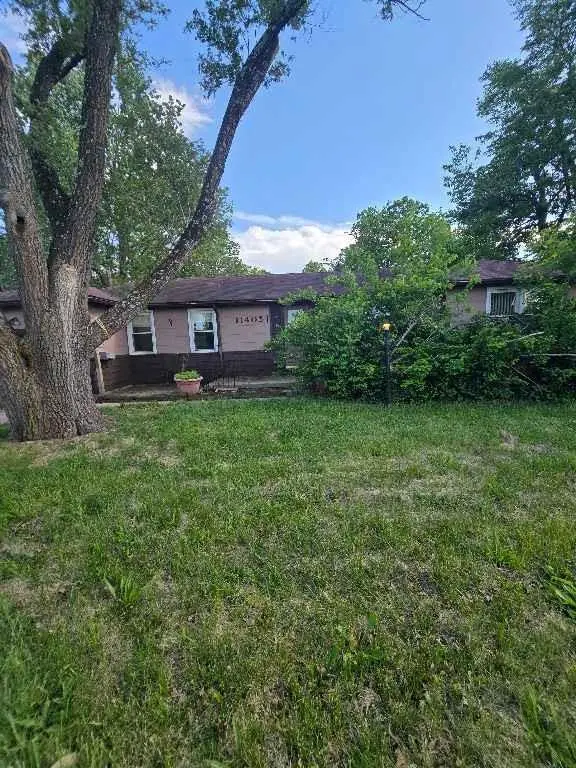
11405 E 83rd St · Raytown, MO
Flood risk 1/10 · Minimal
- FEMA flood zone
- X (unshaded)
- Chance of flooding over 30 yrs
- 0.0%
- Est. flood insurance / yr
- $507 – $1,088
Fire risk 3/10 · Minor
- Est. fire insurance / yr
- $1,054 – $1,958
Heat risk 4/10 · Minor
- Hot days now (above 107°F)
- 7 days/yr
- Hot days in 30 yrs
- 17 days/yr
Wind risk 2/10 · Minimal
- Chance of severe wind over 30 yrs
- —
Air-quality risk 3/10 · Minor
- Unhealthy air days now
- 3 days/yr
- Unhealthy air days in 30 yrs
- 3 days/yr
Risk factors via First Street. Map © Google.
Why this score? — see what drove the B grade
The composite is a weighted blend of 9 inputs, each scored 0–100. Each bar is that input's sub-score; the figure is the points it added to the 100-point composite (weight × sub-score).
- Cash flow +29.5/30.0
- ARV discount +15.0/15.0
- DSCR +10.0/10.0
- 1% rule +8.1/10.0
- Rent growth +3.3/5.0
- Livability +3.2/5.0
- Condition / age +2.5/5.0
- Schools +1.8/10.0
- Appreciation +0.0/10.0
$124,900
🖨 Deal sheet 📄 Offer letter ✓ Due diligence
Listing remarks
Welcome to this inviting home in the heart of Raytown, ideally located near shopping, dining, and easy highway access. This property offers a perfect blend of comfort and functionality, featuring spacious living areas filled with natural light and a layout designed for everyday living. The kitchen provides ample cabinet space and flows seamlessly into the dining and living areas—ideal for entertaining or relaxing with family. Bedrooms offer comfort and flexibility, while the bathroom is designed for convenience and style. Step outside to enjoy a sizable yard, perfect for gatherings, pets, or simply unwinding after a long day. Whether you're a first-time buyer, downsizing, or looking f
Key facts
- Sizable yard
- Ample cabinet space
- 0.35 acre lot
Tags
Property features AI
Finance
- HOA & community: No association fees
Exterior
- Parking: Attached 1-car garage
- Utilities: Public water; Public sewer; Cable available; Fiber available; High-speed internet available
- Home design: Single family residence; Ranch floor plan; Attached property; Faces north
- Construction: Board & batten siding; Composition roof
- Exterior features: Paved road access; Publicly maintained road
Interior
- Kitchen: Disposal; Exhaust fan; Refrigerator; Electric range
- Bedrooms: 3 bedrooms
- Flooring: Carpet
- Bathrooms: 1 full bathroom
- Heating & cooling: Forced air heating; Electric cooling
- Interior features: Disposal; Exhaust fan; Refrigerator; Electric range
Neighborhood map
What this means for you Summary
Snapshot
- This is a 3-bed/1.0-bath single-family listed at $125k.
Deal economics
- At list price, monthly cash flow is $445 ($5k/yr) — positive.
- The deal already cash-flows at list — no discount required.
- Meets the 1% rule at list price ($2k rent vs $125k).
- Recommended offer: $123k (1.5% below list) — sets the bar for market timing.
- Cap rate 10.6% vs local median 5.0% in Raytown — top-decile yield for the area; either an underpriced asset or a hidden risk that comps aren't pricing in. Stress-test before assuming the spread holds.
Location & tenants
- Location reads 65/100 on livability (#281 in MO) — a middle-class / working-renter tenant base. Strengths: cost of living A+, housing A+, health & safety B+; Watch: crime F, amenities F, commute F.
- Raytown C-2 (suburban): math 12% / reading 28% proficiency, ranked #302 of 324 in MO (top 93%) — low school quality limits family demand, transient renter base, plan for 1-2y turnover.
- Zoned schools: Southwood Elem. (math 17% / reading 37%, grade F, #850 of 1,115 statewide, top 78%, 343 students, 60% FRL); Raytown South Sr. High (math 8% / reading 32%, grade F, #475 of 521 statewide, top 92%, 1,185 students, 68% FRL).
- Market conditions: Rents rising (+3.1%/yr); 138 active listings in the ZIP; 8 comparable units currently listed for rent nearby; rentals at typical pace (median 22d on market — plan ~3-4 weeks tenant-placement turnaround); 4,002 units permitted in Jackson County in 2024 (2,271 in 5+ unit buildings).
- This rent runs 34% of the median local income ($59k/yr) — at the standard rent-burdened threshold; future hikes will face affordability resistance.
Forward outlook
- Local home prices are declining (-3.0%/yr); year-one equity from $864 of loan paydown is wiped out by about $4k of value loss. Plan a longer hold.
- Jackson County population projected at +4% by 2050 — modest demand growth; plan on rents tracking national, not racing it.
- At projected returns (-3.0% appreciation + 3.1% rent growth), your $35k cash investment doubles in ~8 years — after that, you're playing with house money.
Negotiation context
- It's been on market 20 days — a 2% lower offer ($123k) is reasonable based on typical stale-listing flexibility.
Risks & watch-outs
- Watch-outs: built in 1956 — expect roof / HVAC / electrical / plumbing capex.
Questions for the listing agent
- Built in 1956 — when were the roof, HVAC, electrical panel, plumbing, and water heater last replaced?
- Is there a deadline driving the sale (1031 exchange, divorce, estate, relocation)? That informs how much negotiation room exists.
- Schools are D-rated, which usually means shorter tenancies and higher turnover. Who's the typical renter profile here, and what's been the actual vacancy rate?
- Crime grade is F in this area — have there been break-ins, vandalism, or insurance claims at this property in the last 3 years? What carrier currently insures it and at what premium?
- What's the average days-on-market for RENTAL listings here right now (not sales)? A rising rental-DOM trend means longer vacancies and softer asking-rent achievability than the comps imply.
- What's the recent tenant-quality profile in this submarket — average credit score on applications, eviction rate, late-payment / NSF rate, and stable-employment percentage? A property-management company in the area should have these aggregated.
- How much new for-sale + rental construction is in the pipeline within 1–3 miles? Heavy new supply typically softens prices + rents 12–24 months out; constrained supply supports both.
Investment metrics
- 1% rule
- 1.31% ✓
- Cap rate
- 10.57%
- Cash-on-cash
- 15.28%
- DSCR
- 1.68
- GRM
- 6.3
CMA / ARV
- ARV (on-the-fly)
- $185,150
- Comps found
- 12
Show comp detail 12 sales within ~0.75 mi
| Address | Dist | Beds/Ba | Sqft | Sold | Price | $/sf | Match |
|---|---|---|---|---|---|---|---|
| 8408 Woodson Ct | 0.21mi | 2/1.5 (-1) | 968 (-8%) | 2mo | $125,000 | $129 | 67 |
| 8132 Sterling Ave | 0.28mi | 3/1.0 | 1,179 (+11%) | 3mo | $210,000 | $178 | 65 |
| 8413 Sterling Ave | 0.25mi | 3/1.0 | 920 (-13%) | 10mo | $149,900 | $163 | 58 |
| 11405 E 78th Ter | 0.55mi | 3/2.0 | 1,050 (-1%) | 13mo | $208,000 | $198 | 58 |
| 7905 Appleton Ave | 0.60mi | 3/1.5 | 1,031 (-3%) | 18mo | $180,000 | $175 | 51 |
| 11308 E 78th St | 0.67mi | 3/1.0 | 968 (-8%) | 7mo | $169,900 | $176 | 49 |
| 7900 Hedges Ave | 0.68mi | 3/1.5 | 1,008 (-5%) | 13mo | $199,000 | $197 | 48 |
| 11307 E 77th Ter | 0.73mi | 3/1.0 | 1,152 (+9%) | 7mo | $125,000 | $109 | 45 |
| 11004 E 78th St | 0.73mi | 2/1.0 (-1) | 960 (-9%) | 0mo | $165,000 | $172 | 45 |
| 11300 E 78th St | 0.68mi | 3/2.0 | 1,008 (-5%) | 18mo | $169,000 | $168 | 42 |
| 11401 E 78 Ter | 0.55mi | 3/1.5 | 1,184 (+12%) | 22mo | $199,000 | $168 | 34 |
| 11111 E 78th St | 0.67mi | 2/1.0 (-1) | 960 (-9%) | 20mo | $170,000 | $177 | 32 |
Match score weights: distance 35% · size 25% · config 20% · recency 20%. Top-matched comps best support the ARV.
Projected returns pro-forma
-3.0% appreciation · 3.07% rent growth · sell at horizon
- IRR
- 6.1%
- Equity multiple
- 1.24×
- Total profit
- $8,262
- Equity at exit
- $18,623
- IRR
- 15.5%
- Equity multiple
- 2.27×
- Total profit
- $44,269
- Equity at exit
- $10,799
Cash invested: $34,972 (down + closing). Projections, not guarantees.
Landlord ↔ Tenant lean methodology
- Overall (STATE)
- 81 Strongly Landlord-Friendly
- State Missouri
- 81 Strongly Landlord-Friendly · R+10
- County
- — inherits STATE
- City
- — inherits STATE
ZIP-level market 64138
- Rents YoY
- 3.1%
- Active inventory
- 138
- Price-to-rent
- 6.3×
Monthly cashflow live
- Estimated rent
- $1,641 high interval (Pro) →
- Mortgage (P&I)
- −$655
- Tax from tax record
- −$144 /mo · $1,730/yr
- Insurance
- −$52
- HOA
- −$0
- Vacancy / Maint / Mgmt
- −$345
- Net cashflow
- $445
Break-even live
UW: 25.0% down · 7.5% · 30yr · 1.5% tax · 5.0% vac · 8.0% maint · 8.0% mgmt
Financing live
Cash to close
- Down payment
- $31,225
- Closing costs
- $3,747
- Reserves months
- —
- Total cash needed
- —
Loan-product check · same deal, 3 products live
Conventional
25% down · 7.5% · 30yr
- Down + closing
- —
- Monthly P&I
- —
- Monthly cashflow
- —
- DSCR
- —
- Eligible?
- —
Personal DTI + credit; lowest rate.
DSCR
20% down · 8.5% · 30yr
- Down + closing
- —
- Monthly P&I
- —
- Monthly cashflow
- —
- DSCR
- —
- Eligible?
- —
No personal income docs; deal must DSCR.
Hard money
10% down · 12.0% · 12mo
- Down + closing
- —
- Monthly P&I
- —
- Monthly cashflow
- —
- DSCR
- —
- Eligible?
- —
Short-term bridge; refi at stabilization.
Rent comps 8 comps
| Address | Beds | Baths | Sqft | Rent | $/sqft | DOM | Units | Dist |
|---|---|---|---|---|---|---|---|---|
| 11311 E 87th St Unit Secluded Cottage Kansas City, MO | 2.0 | 1.0 | 950 | $1,695 | $1.78 | 43d | 1 | 0.77mi |
| 10607 E 78 Ter Raytown, MO | 2.0 | 1.0 | 896 | $1,395 | $1.56 | 3d | 1 | 0.79mi |
| 10505 E 79th St Raytown, MO | 3.0 | 2.0 | 1074 | $1,756 | $1.64 | 43d | 1 | 0.82mi |
| 10407 E 78 Ter Raytown, MO | 2.0 | 1.0 | 781 | $1,298 | $1.66 | 43d | 1 | 0.89mi |
| 10213 E 78 St Raytown, MO | 3.0 | 2.0 | 1160 | $1,410 | $1.22 | 21d | 1 | 1.04mi |
| 9400 E 82nd St Raytown, MO | 3.0 | 2.0 | 1396 | $1,606 | $1.15 | 3d | 1 | 1.38mi |
| 8806 Crescent Ave Kansas City, MO | 3.0 | 2.5 | 1148 | $1,795 | $1.56 | 4d | 1 | 1.42mi |
| 7712 Arlington Ave Raytown, MO | 3.0 | 2.0 | 1358 | $1,741 | $1.28 | 12d | 1 | 1.48mi |
Listing history 15 events
-
2026-06-18days on market $124,900 Active 20 DOM
-
2026-06-17days on market $124,900 Active 19 DOM
-
2026-06-16days on market $124,900 Active 18 DOM
-
2026-06-15days on market $124,900 Active 17 DOM
-
2026-06-13days on market $124,900 Active 15 DOM
-
2026-06-13days on market $124,900 Active 14 DOM
-
2026-06-09days on market $124,900 Active 11 DOM
-
2026-06-08days on market $124,900 Active 10 DOM
-
2026-06-07days on market $124,900 Active 9 DOM
-
2026-06-03days on market $124,900 Active 5 DOM
-
2026-06-02days on market $124,900 Active 4 DOM
-
2026-06-01days on market $124,900 Active 3 DOM
-
2026-05-31days on market $124,900 Active 2 DOM
-
2026-05-29$124,900 Active
-
1993-03-05soldstatus
ⓘ Source: listings_history table (triggers on properties + properties_extension) + one-shot
backfill from property_details.listing_events for pre-trigger history.
Tax reassessment forecast MO · Resets to sale price
- Current annual tax
- $1,730 · $144/mo
- Projected year-2 tax
- $1,730 · $144/mo
- Expected delta
- $0/yr ($0/mo · 0.0%)
ⓘ Screening estimate from a state-policy table — verify with the county assessor before closing.
Climate risk First Street
- Flood 1/10 Low FEMA zone X (unshaded) · 0% chance over 30 yrs
- Wildfire 3/10 Moderate
- Heat 4/10 Moderate 7 d/yr ≥107°F today · 17 d/yr by 30 yrs out
- Wind 2/10 Low
- Air quality 3/10 Moderate 3 unhealthy d/yr today · 3 by 30 yrs out
Nearby sold comps map
Loading sold comps map…
Walkable amenities ~0.75 mi
Loading nearby amenities…
Taxation est. · year 1
- Rental income
- $19,695
- − Mortgage interest
- −$6,996
- − Property taxes
- −$1,730
- − Insurance
- −$624
- − Repairs & maintenance
- −$1,576
- − Management
- −$1,576
- − Depreciation
- −$3,633
- Taxable income
- $3,560
- Est. tax owed @ 24.0%
- −$854
- After-tax cash flow
- $4,491/yr
For passive investors: Depreciation is non-cash, so a rental often shows a tax loss while cash-flowing — sheltering income. Rental losses are passive: they offset passive income freely, and up to $25,000/yr can offset ordinary (W-2) income if you actively participate and your MAGI is under $100k (phasing out to $0 by $150k); unused losses carry forward. On sale, claimed depreciation is recaptured at up to 25%, and gains may owe capital-gains tax (a 1031 exchange can defer both). Figures are a year-1 estimate at your 24.0% rate — not tax advice; consult a CPA.
Schools (NCES district)
- District
- Raytown C-2
- NCES district ID
- 2926070
- Math proficiency
- 12% ▼ -11.00%
- Reading proficiency
- 28% ▼ -9.00%
- Median HH income
- $47,215
- Composite
- 17.59/100
- National rank
- #9039
- State rank
- #302 of 324 in MO
Livability — Raytown
- Score
- 65/100
- State rank
- #281
- US rank
- #13079
Category grades
Schools grade is shown separately in the Schools card above.
Census & demographics
- Census place
- Raytown, MO
- County
- Jackson County · 687,798 people
- City population
- 60,054
- Metro
- Kansas City, MO-KS
- Population (ZIP)
- 23,805
- Household income
- $58,638
- Rent vs Own
- Severe rent burden
- 810.0
Population outlook (Jackson County) Hauer SSP2
- Today (2025)
- 719,589 people
- By 2030
- 731,456 · +1.6%
- By 2040
- 746,689 · +3.8%
- By 2050
- 749,289 · +4.1%
- By 2075
- 736,227 · +2.3%
- By 2100
- 668,210 · -7.1%
Race, ethnicity, and origin ACS 2023
- Neighborhood character
- Diverse neighborhood (Simpson 0.61)
- Race & ethnicity
- Black 46% White 42% Two or more races 6% Hispanic / Latino 5% Asian 2%
- Common ancestry
- Slovak 2% Ukrainian 1% Italian 1%
- Foreign-born
- 6% · Canada, China
- Languages at home
- 91% English-only · Spanish 4% Arabic 3% Other Indo-European 1%
Political lean MEDSL · Jackson
- 2024 margin
- D (+19.3) · D 58.9% · R 39.5% · Other 1.6%
- 2008→2024 swing
- -6.1pp toward R · 2008: 25.4pp · 2024: 19.3pp
- All cycles
- 2024: D+19.3 2020: D+22.0 2016: D+16.6 2012: D+19.0 2008: D+25.4
Not yet ingested
- Civics
- —
Market trends
- HPI YoY
- ▼ -186.34%
- Current HPI
- 274.681
- Rent YoY
- ▲ 3.07%
- Metro
- Kansas City, MO-KS
- State GDP YoY
- ▲ 1.84%
- F500 in state
- 20
Industry mix (Fortune 500 HQ in MO)
| Industry | F500 HQs | Revenue |
|---|---|---|
| Healthcare | 1 | $163B |
|
||
| Insurance | 1 | $21B |
|
||
| Industrial Technology | 1 | $17B |
|
||
| Retail | 1 | $16B |
|
||
| Industrial Distribution | 1 | $10B |
|
||
| Utilities | 1 | $9B |
|
||
Price history
2 events — show timeline
- 2026-05-29 Listed $124,900 Heartland MLS as Distributed by MLS Grid
- 1993-03-05 Sold (Public Records) — Public Records
Property tax history
+5.5%/yrLatest (2025): $1,730 · -11.1% YoY. Source: county tax records.
Cash-flow waterfall
monthlySold comps — $/sqft
last 12 mo · ≤1 miLoading sold comps…