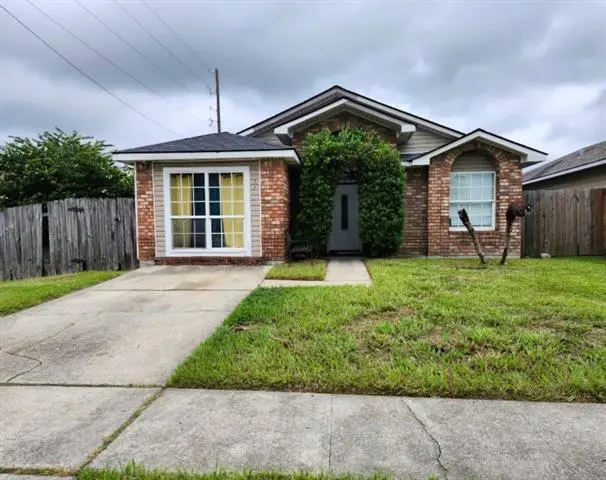
3400 Wall Blvd · New Orleans, LA
Flood risk 8/10 · Major
- FEMA flood zone
- X
- Chance of flooding over 30 yrs
- 0.6%
- Est. flood insurance / yr
- $507 – $1,088
Fire risk 1/10 · Minimal
- Est. fire insurance / yr
- $1,269 – $2,357
Heat risk 10/10 · Severe
- Hot days now (above 108°F)
- 7 days/yr
- Hot days in 30 yrs
- 21 days/yr
Wind risk 10/10 · Severe
- Chance of severe wind over 30 yrs
- 99.0%
Air-quality risk 2/10 · Minimal
- Unhealthy air days now
- 2 days/yr
- Unhealthy air days in 30 yrs
- 2 days/yr
Risk factors via First Street. Map © Google.
Why this score? — see what drove the B grade
The composite is a weighted blend of 9 inputs, each scored 0–100. Each bar is that input's sub-score; the figure is the points it added to the 100-point composite (weight × sub-score).
- Cash flow +30.0/30.0
- ARV discount +15.0/15.0
- DSCR +10.0/10.0
- 1% rule +8.6/10.0
- Livability +4.0/5.0
- Condition / age +2.5/5.0
- Rent growth +2.3/5.0
- Schools +1.6/10.0
- Appreciation +0.0/10.0
$140,000
🖨 Deal sheet (PDF) 📄 Offer letter ✓ Due diligence
Listing remarks MLS
Sellers are motivated!! Come and see this charming 3-bedroom 2-bath home, which sits on a corner lot and offers a welcoming blend of comfort and style. With a spacious living room and a mix of modern updates and classic features, it provides a warm atmosphere. It also includes a spacious backyard, no carpet, and it's move-in ready!! Schedule your tour today.
Key facts
- Move-in ready
- Spacious backyard
- Corner lot
Tags
Property features AI
Exterior
- Parking: Driveway; One parking space
- Utilities: Public water; Public sewer; Electric service (assumed)
- Home design: Single-story; Brick construction; Shingle roof; Slab foundation; Very good condition
- Construction: Built with brick; Shingle roof; Slab foundation
- Exterior features: Fenced yard; Corner lot; City lot; Rectangular lot; Regular lot dimensions
Interior
- Kitchen: Oven; Refrigerator
- Bedrooms: Total rooms: 5
- Bathrooms: 2 full bathrooms
- Heating & cooling: Central heating; Central air conditioning
- Interior features: Ceiling fans; Cathedral ceilings; Vaulted ceilings; High ceilings
Neighborhood map
What this means for you Summary
Snapshot
- This is a 3-bed/2.0-bath single-family listed at $140k.
Deal economics
- At list price, monthly cash flow is $462 ($6k/yr) — positive.
- The deal already cash-flows at list — no discount required.
- Meets the 1% rule at list price ($2k rent vs $140k).
- Cap rate 10.8% vs local median 4.4% in New Orleans — top-decile yield for the area; either an underpriced asset or a hidden risk that comps aren't pricing in. Stress-test before assuming the spread holds.
Location & tenants
- Location reads 81/100 on livability (#3 in LA, #1,383 nationally) — a professional / high-income tenant draw. Strengths: amenities A+, commute A+, health & safety A+; Watch: crime C-, employment D.
- Orleans Parish (urban): math 11% / reading 27% proficiency, ranked #69 of 98 in LA (top 70%) — low school quality limits family demand, transient renter base, plan for 1-2y turnover; 68% free/reduced lunch — lower-income household profile, screen leases tightly.
- Market conditions: Rents soft (-0.7%/yr); 265 active listings in the ZIP; 21 comparable units currently listed for rent nearby; rentals at typical pace (median 20d on market — plan ~3-4 weeks tenant-placement turnaround); lower-income renter base — watch delinquency; 710 units permitted in Orleans Parish in 2024 (244 in 5+ unit buildings).
- At $1,898/mo this rent would consume 52% of the median local household income ($43k/yr) (locally 2240% of renters already pay >50% of income on rent) — very limited rent-growth headroom before tenants either downsize or default.
Forward outlook
- Local home prices are declining (-3.0%/yr); year-one equity from $968 of loan paydown is wiped out by about $4k of value loss. Plan a longer hold.
- Orleans County population projected at +61% by 2050 — long-run rental-demand tailwind backs the buy-and-hold thesis.
Negotiation context
- Only 9 days on market — expect competitive offers; lowballing is unlikely to land.
- 6 sale attempts since 13y ago with the ask held roughly flat each time — persistent listings suggest the price (not the market) is what's stuck; bring a comps-based counter.
- Current owner paid $121k; 16% above their basis — modest negotiation headroom, anchor on the comps not their cost.
Risks & watch-outs
- Watch-outs: flood insurance adds $66/mo.
- Climate carrying-cost: severe flood risk; severe wind risk, 99% chance of damaging wind over 30y; extreme-heat days projected 7→21/yr by 2055 (HVAC capex compounding) — expect insurance premiums to compound above CPI over the hold.
Questions for the listing agent
- Built in 1978 — when were the roof, HVAC, electrical panel, plumbing, and water heater last replaced?
- What's the actual annual flood-insurance premium (NFIP or private), and is the property in a SFHA with mandatory coverage?
- Is there a deadline driving the sale (1031 exchange, divorce, estate, relocation)? That informs how much negotiation room exists.
- What's the average days-on-market for RENTAL listings here right now (not sales)? A rising rental-DOM trend means longer vacancies and softer asking-rent achievability than the comps imply.
- What's the recent tenant-quality profile in this submarket — average credit score on applications, eviction rate, late-payment / NSF rate, and stable-employment percentage? A property-management company in the area should have these aggregated.
- How much new for-sale + rental construction is in the pipeline within 1–3 miles? Heavy new supply typically softens prices + rents 12–24 months out; constrained supply supports both.
Investment metrics
- 1% rule
- 1.36% ✓
- Cap rate
- 10.83%
- Cash-on-cash
- 16.19%
- DSCR
- 1.72
- GRM
- 6.1
CMA / ARV
- ARV (on-the-fly)
- $185,679
- Comps found
- 12
Show comp detail 12 sales within ~0.75 mi
| Address | Dist | Beds/Ba | Sqft | Sold | Price | $/sf | Match |
|---|---|---|---|---|---|---|---|
| 2032 Halsey Ave | 0.24mi | 3/2.0 | 1,639 (+3%) | 0mo | $220,000 | $134 | 83 |
| 2219 Mercedes Blvd | 0.33mi | 3/2.0 | 1,620 (+2%) | 9mo | $190,000 | $117 | 74 |
| 2048 Mercedes Blvd | 0.31mi | 3/2.0 | 1,606 (+1%) | 12mo | $215,000 | $134 | 73 |
| 1640 Tropic Dr | 0.56mi | 2/2.0 (-1) | 1,580 (-0%) | 1mo | $95,000 | $60 | 67 |
| 2450 Mercedes Blvd | 0.47mi | 3/2.0 | 1,609 (+1%) | 15mo | $187,000 | $116 | 63 |
| 1761 Pace Blvd | 0.46mi | 3/2.0 | 1,390 (-12%) | 3mo | $166,300 | $120 | 55 |
| 1236 Southlawn Blvd | 0.63mi | 3/2.0 | 1,450 (-9%) | 2mo | $145,000 | $100 | 55 |
| 1721 Pace Blvd | 0.46mi | 3/1.0 | 1,383 (-13%) | 3mo | $70,000 | $51 | 50 |
| 2018 Saint Nick Dr | 0.64mi | 3/2.0 | 1,762 (+11%) | 7mo | $235,000 | $133 | 46 |
| 1509 Shirley Dr | 0.75mi | 2/1.5 (-1) | 1,482 (-7%) | 2mo | $45,000 | $30 | 45 |
| 2121 Mediamolle Dr | 0.48mi | 4/2.0 (+1) | 1,810 (+14%) | 11mo | $269,000 | $149 | 40 |
| 3626 De Armas St | 0.61mi | 4/2.0 (+1) | 1,360 (-14%) | 15mo | $147,500 | $108 | 31 |
Match score weights: distance 35% · size 25% · config 20% · recency 20%. Top-matched comps best support the ARV.
Projected returns pro-forma
-3.0% appreciation · 0.0% rent growth · sell at horizon
- IRR
- 0.9%
- Equity multiple
- 1.03×
- Total profit
- $1,274
- Equity at exit
- $20,874
- IRR
- 7.0%
- Equity multiple
- 1.45×
- Total profit
- $17,823
- Equity at exit
- $12,105
Cash invested: $39,200 (down + closing). Projections, not guarantees.
Landlord ↔ Tenant lean methodology
- Overall (STATE)
- 90 Strongly Landlord-Friendly
- State Louisiana
- 90 Strongly Landlord-Friendly · R+12
- County
- — inherits STATE
- City
- — inherits STATE
ZIP-level market 70114
- Rents YoY
- -0.7%
- Active inventory
- 265
- Price-to-rent
- 6.1×
Monthly cashflow live
- Estimated rent
- $1,898 high interval (Pro) →
- Mortgage (P&I)
- −$734
- Tax from tax record
- −$178 /mo · $2,140/yr
- Insurance
- −$58
- Flood insurance flood zone
- −$66 /mo · $798/yr
- HOA
- −$0
- Vacancy / Maint / Mgmt
- −$399
- Net cashflow
- $462
Break-even live
Sensitivity live
| Price | -10% $542 | -5% $502 | +0% $462 | +5% $423 | +10% $383 |
|---|---|---|---|---|---|
| Rent | -10% $312 | -5% $387 | +0% $462 | +5% $537 | +10% $612 |
| Rate | -1.0pp $533 | -0.5pp $498 | base $462 | +0.5pp $426 | +1.0pp $389 |
UW: 25.0% down · 7.5% · 30yr · 1.5% tax · 5.0% vac · 8.0% maint · 8.0% mgmt
Financing live
Cash to close
- Down payment
- $35,000
- Closing costs
- $4,200
- Reserves months
- —
- Total cash needed
- —
Loan-product check · same deal, 3 products live
Conventional
25% down · 7.5% · 30yr
- Down + closing
- —
- Monthly P&I
- —
- Monthly cashflow
- —
- DSCR
- —
- Eligible?
- —
Personal DTI + credit; lowest rate.
DSCR
20% down · 8.5% · 30yr
- Down + closing
- —
- Monthly P&I
- —
- Monthly cashflow
- —
- DSCR
- —
- Eligible?
- —
No personal income docs; deal must DSCR.
Hard money
10% down · 12.0% · 12mo
- Down + closing
- —
- Monthly P&I
- —
- Monthly cashflow
- —
- DSCR
- —
- Eligible?
- —
Short-term bridge; refi at stabilization.
Rent comps 21 comps
| Address | Beds | Baths | Sqft | Rent | $/sqft | DOM | Units | Dist |
|---|---|---|---|---|---|---|---|---|
| 3000 Americus St New Orleans, LA | 3.0 | 2.0 | 1280 | $1,400 | $1.09 | 24d | 1 | 0.34mi |
| 1622 Jo Ann Pl New Orleans, LA | 3.0 | 1.5 | 1301 | $1,500 | $1.15 | 2d | 1 | 0.42mi |
| 1565 Murl St Unit B New Orleans, LA | 2.0 | 2.0 | 1100 | $1,100 | $1.00 | 24d | 1 | 0.43mi |
| 1774 Pace Blvd New Orleans, LA | 4.0 | 2.5 | 1574 | $2,000 | $1.27 | 24d | 1 | 0.46mi |
| 1719 Pace Blvd New Orleans, LA | 3.0 | 1.0 | 1178 | $2,000 | $1.70 | 12d | 1 | 0.49mi |
| 3725 Macarthur Blvd Unit 2A New Orleans, LA | 2.0 | 2.0 | 1200 | $2,750 | $2.29 | 19d | 1 | 0.68mi |
| 21 Carriage Ln New Orleans, LA | 3.0 | 2.5 | 1900 | $2,000 | $1.05 | 22d | 1 | 0.74mi |
| 1684 Lauradale Dr New Orleans, LA | 4.0 | 2.0 | 1571 | $2,000 | $1.27 | 24d | 1 | 0.78mi |
| 1410 Kabel Dr New Orleans, LA | 3.0 | 2.0 | 2200 | $2,200 | $1.00 | 24d | 1 | 0.81mi |
| 2320 Mardi Gras Blvd New Orleans, LA | 4.0 | 2.5 | 1600 | $2,500 | $1.56 | 2d | 1 | 0.90mi |
| 1812 River Oaks Dr New Orleans, LA | 3.0 | 1.0 | 1148 | $1,700 | $1.48 | 4d | 1 | 0.93mi |
| 1812 River Oaks Dr New Orleans, LA | 3.0 | 1.0 | 1148 | $1,700 | $1.48 | 3d | 1 | 0.93mi |
| 103 Danny Dr New Orleans, LA | 4.0 | 2.0 | 2040 | $2,400 | $1.18 | 24d | 1 | 0.97mi |
| 1402 Behrman Ave New Orleans, LA | 2.0 | 1.0 | 1673 | $1,500 | $0.90 | 24d | 1 | 1.11mi |
| 3252 Kabel Dr New Orleans, LA | 2.0 | 1.5 | 1080 | $1,300 | $1.20 | 21d | 1 | 1.16mi |
| 1414 Sumner St New Orleans, LA | 3.0 | 2.0 | 1800 | $1,450 | $0.81 | 16d | 1 | 1.16mi |
| 1108 Sumner St New Orleans, LA | 3.0 | 1.5 | 1197 | $1,500 | $1.25 | 12d | 1 | 1.25mi |
| 3511 Hyman Pl New Orleans, LA | 3.0 | 2.0 | 1975 | $2,700 | $1.37 | 2d | 1 | 1.33mi |
| 3151 Plymouth Pl New Orleans, LA | 3.0 | 1.0 | 1470 | $1,700 | $1.16 | 24d | 1 | 1.39mi |
| 701 Behrman Ave New Orleans, LA | 3.0 | 2.0 | 1368 | $2,300 | $1.68 | 4d | 1 | 1.40mi |
| 438 Friscoville Ave Arabi, LA | 3.0 | 2.0 | 1500 | $3,200 | $2.13 | 3d | 1 | 1.45mi |
Listing history 8 events
-
2026-06-08statusdays on market $140,000 Pending 9 DOM
-
2026-06-07days on market $140,000 Active 8 DOM
-
2026-06-05days on market $140,000 Active 5 DOM
-
2026-06-03days on market $140,000 Active 4 DOM
-
2026-06-02days on market $140,000 Active 3 DOM
-
2026-06-01days on market $140,000 Active 2 DOM
-
2026-05-31remarks 361-char remark
-
2026-05-31$140,000 Active 1 DOM
ⓘ Source: listings_history table (triggers on properties + properties_extension) + one-shot
backfill from property_details.listing_events for pre-trigger history.
Tax reassessment forecast LA · Resets to sale price
- Current annual tax
- $2,140 · $178/mo
- Projected year-2 tax
- $2,140 · $178/mo
- Expected delta
- $0/yr ($0/mo · 0.0%)
ⓘ Screening estimate from a state-policy table — verify with the county assessor before closing.
Climate risk First Street
- Flood 8/10 Severe FEMA zone X · 60% chance over 30 yrs
- Wildfire 1/10 Low
- Heat 10/10 Extreme 7 d/yr ≥108°F today · 21 d/yr by 30 yrs out
- Wind 10/10 Extreme 99% chance of damaging wind over 30 yrs
- Air quality 2/10 Low 2 unhealthy d/yr today · 2 by 30 yrs out
Nearby sold comps map
Loading sold comps map…
Walkable amenities ~0.75 mi
Loading nearby amenities…
Taxation est. · year 1
- Rental income
- $22,780
- − Mortgage interest
- −$7,842
- − Property taxes
- −$2,140
- − Insurance
- −$1,498
- − Repairs & maintenance
- −$1,822
- − Management
- −$1,822
- − Depreciation
- −$4,073
- Taxable income
- $3,583
- Est. tax owed @ 24.0%
- −$860
- After-tax cash flow
- $4,689/yr
For passive investors: Depreciation is non-cash, so a rental often shows a tax loss while cash-flowing — sheltering income. Rental losses are passive: they offset passive income freely, and up to $25,000/yr can offset ordinary (W-2) income if you actively participate and your MAGI is under $100k (phasing out to $0 by $150k); unused losses carry forward. On sale, claimed depreciation is recaptured at up to 25%, and gains may owe capital-gains tax (a 1031 exchange can defer both). Figures are a year-1 estimate at your 24.0% rate — not tax advice; consult a CPA.
Schools (NCES district)
- District
- Orleans Parish
- NCES district ID
- 2201170
- Math proficiency
- 11% ▼ -52.00%
- Reading proficiency
- 27% ▼ -46.00%
- Median HH income
- $37,011
- Composite
- 15.78/100
- National rank
- #9271
- State rank
- #69 of 98 in LA
Livability — New Orleans
- Score
- 81/100
- State rank
- #3
- US rank
- #1383
Category grades
Schools grade is shown separately in the Schools card above.
Census & demographics
- Census place
- New Orleans, LA
- County
- Orleans Parish · 338,817 people
- City population
- 338,817
- Metro
- New Orleans-Metairie, LA
- Population (ZIP)
- 22,659
- Household income
- $43,493
- Rent vs Own
- Severe rent burden
- 2240.0
Population outlook (Orleans County) Hauer SSP2
- Today (2025)
- 513,025 people
- By 2030
- 575,781 · +12.2%
- By 2040
- 700,174 · +36.5%
- By 2050
- 826,541 · +61.1%
- By 2075
- 1,123,374 · +119.0%
- By 2100
- 1,355,609 · +164.2%
Race, ethnicity, and origin ACS 2023
- Neighborhood character
- Predominantly Black (72%)
- Race & ethnicity
- Black 72% White 16% Hispanic / Latino 8% Two or more races 5%
- Hispanic origin (detail)
- Mexican 2% Puerto Rican 1%
- Common ancestry
- Lithuanian 3% Slovak 1% Italian 1%
- Foreign-born
- 5% · Canada
- Languages at home
- 91% English-only · Spanish 6% French/Haitian/Cajun 2% Other Indo-European 1%
Political lean MEDSL · Orleans
- 2024 margin
- Solid D (+67.0) · D 82.2% · R 15.2% · Other 2.7%
- 2008→2024 swing
- +6.7pp toward D · 2008: 60.3pp · 2024: 67.0pp
- All cycles
- 2024: D+67.0 2020: D+68.2 2016: D+66.2 2012: D+62.5 2008: D+60.3
Not yet ingested
- Civics
- —
Market trends
- HPI YoY
- ▼ -98.56%
- Current HPI
- 149.0172
- Rent YoY
- ▼ -0.72%
- Metro
- New Orleans-Metairie, LA
- State GDP YoY
- ▲ 3.29%
- F500 in state
- 10
Industry mix (Fortune 500 HQ in LA)
| Industry | F500 HQs | Revenue |
|---|---|---|
| Telecommunications | 2 | $23B |
|
||
| Utilities | 1 | $12B |
|
||
| Wholesale / Distribution | 1 | $5B |
|
||
| Advertising | 1 | $2B |
|
||
Price history
+127.1% since first listed11 events — show timeline
- 2026-05-29 Listed $140,000 AcadianaMLS
- 2026-05-29 Listed $140,000 GSREIN
- 2017-04-27 Sold (Public Records) $121,000 Public Records
- 2017-04-26 Sold (MLS) $121,000 GSREIN
- 2017-04-10 Pending — GSREIN
- 2016-12-09 Listed $130,000 GSREIN
- 2016-12-07 Listed $130,000 AcadianaMLS
- 2014-01-23 Sold (MLS) $35,200 GSREIN
- 2013-11-21 Listed $25,000 AcadianaMLS
- 2013-11-21 Listed $25,000 GSREIN
- 1984-12-04 Sold (Public Records) $61,650 Public Records
Property tax history
+2.9%/yrLatest (2026): $2,140 · +0.0% YoY. Source: county tax records.
Cash-flow waterfall
monthlySold comps — $/sqft
last 12 mo · ≤1 miLoading sold comps…