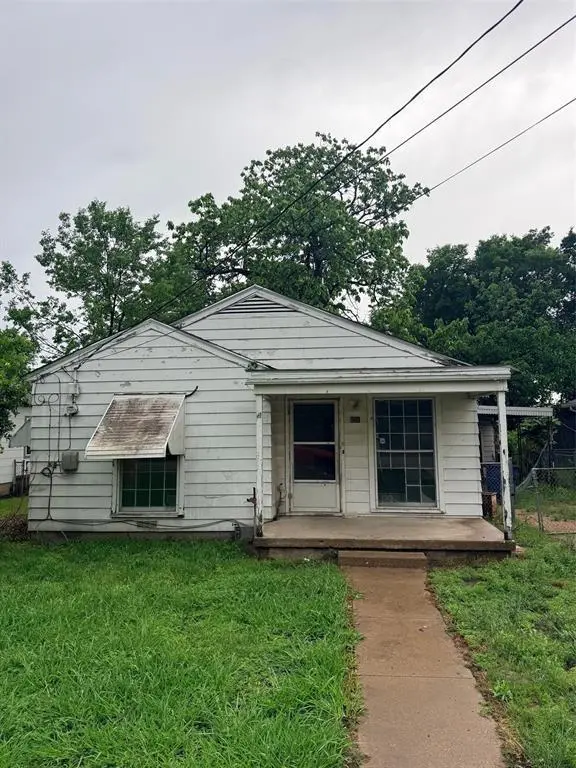
821 Hillburn Dr · Dallas, TX
Flood risk 1/10 · Minimal
- FEMA flood zone
- X (unshaded)
- Chance of flooding over 30 yrs
- 0.0%
- Est. flood insurance / yr
- $507 – $1,088
Fire risk 3/10 · Minor
- Est. fire insurance / yr
- $1,222 – $2,270
Heat risk 7/10 · Major
- Hot days now (above 110°F)
- 7 days/yr
- Hot days in 30 yrs
- 24 days/yr
Wind risk 6/10 · Moderate
- Chance of severe wind over 30 yrs
- 27.0%
Air-quality risk 2/10 · Minimal
- Unhealthy air days now
- 1 days/yr
- Unhealthy air days in 30 yrs
- 2 days/yr
Risk factors via First Street. Map © Google.
Why this score? — see what drove the B- grade
The composite is a weighted blend of 9 inputs, each scored 0–100. Each bar is that input's sub-score; the figure is the points it added to the 100-point composite (weight × sub-score).
- Cash flow +23.2/30.0
- ARV discount +15.0/15.0
- 1% rule +8.1/10.0
- DSCR +7.5/10.0
- Livability +4.0/5.0
- Rent growth +2.8/5.0
- Schools +2.8/10.0
- Condition / age +2.5/5.0
- Appreciation +0.0/10.0
$115,000
🖨 Deal sheet 📄 Offer letter ✓ Due diligence
Listing remarks MLS
Great little starter home. Already FHA appraised. Appliances included in home. Back yard with large tree. Carport and one car garage.
Key facts
- Prime location
- Heart of dallas
- 5,750 sq ft lot
Tags
Property features AI
Finance
- Other: Listing is Active Under Contract; Photos available (9)
- Financial info: Treat as clear loan type; No second mortgage
- HOA & community: No homeowners association
Exterior
- Parking: Detached carport; Covered parking (1 space); Carport spaces: 1; Garage with 1 space (approx. 13' wide x 21' long)
- Security: No surveillance devices reported
- Utilities: City water; City sewer; No municipal utility district
- Home design: Single-family residence; Residential property type; One story; Preowned (built in 1948)
- Construction: Composition roof; Siding exterior; Pillar/post/pier foundation; Year built 1948
- Exterior features: Lot smaller than 0.5 acre; Will subdivide; Subdivision: Pyron E O
Interior
- Kitchen: Disposal; Kitchen on main level (15 x 9)
- Bedrooms: Primary bedroom on main level (14 x 13); Second bedroom on main level (13 x 12)
- Flooring: Carpet
- Bathrooms: 1 full bathroom
- Heating & cooling: Central heating; Natural gas heating; Window cooling units
- Interior features: One-level layout; 4 total rooms; 1 living area; Disposal; Other interior features; Carpet flooring
- Laundry & utility: No specific laundry details listed
Neighborhood map
What this means for you Summary
Snapshot
- This is a 2-bed/1.0-bath single-family listed at $115k.
Deal economics
- At list price, monthly cash flow is $209 ($3k/yr) — positive.
- The deal already cash-flows at list — no discount required.
- Meets the 1% rule at list price ($2k rent vs $115k).
- Recommended offer: $113k (1.5% below list) — sets the bar for market timing.
- Cap rate 8.5% vs local median 2.3% in Dallas — top-decile yield for the area; either an underpriced asset or a hidden risk that comps aren't pricing in. Stress-test before assuming the spread holds.
Location & tenants
- Location reads 81/100 on livability (#24 in TX, #1,380 nationally) — a professional / high-income tenant draw. Strengths: amenities A+, commute A+, housing A+; Watch: crime F.
- Dallas ISD (urban): math 31% / reading 36% proficiency, ranked #559 of 826 in TX (top 68%) — families likely to look elsewhere, expect single-tenant / working-renter base with shorter leases; 83% free/reduced lunch — lower-income household profile, screen leases tightly.
- Zoned schools: Leonides Gonzalez Cigarroa Md El (math 30% / reading 36%, grade F, #2,208 of 4,322 statewide, top 52%, 584 students, 98% FRL).
- Market conditions: Rents rising (+1.0%/yr); 198 active listings in the ZIP; 15 comparable units currently listed for rent nearby; rentals at typical pace (median 18d on market — plan ~3-4 weeks tenant-placement turnaround); 12,577 units permitted in Dallas County in 2024 (6,829 in 5+ unit buildings).
- This rent runs 32% of the median local income ($56k/yr) — at the standard rent-burdened threshold; future hikes will face affordability resistance.
Forward outlook
- Local home prices are declining (-3.0%/yr); year-one equity from $795 of loan paydown is wiped out by about $3k of value loss. Plan a longer hold.
- Dallas County population projected at +35% by 2050 — long-run rental-demand tailwind backs the buy-and-hold thesis.
Negotiation context
- It's been on market 17 days — a 2% lower offer ($113k) is reasonable based on typical stale-listing flexibility.
- 2 sale attempts since 14y ago with the ask held roughly flat each time — persistent listings suggest the price (not the market) is what's stuck; bring a comps-based counter.
Risks & watch-outs
- Watch-outs: property tax is 3.4% of price; built in 1948 — expect roof / HVAC / electrical / plumbing capex.
- Climate carrying-cost: major wind risk, 27% chance of damaging wind over 30y; extreme-heat days projected 7→24/yr by 2055 (HVAC capex compounding) — expect insurance premiums to compound above CPI over the hold.
Questions for the listing agent
- Built in 1948 — when were the roof, HVAC, electrical panel, plumbing, and water heater last replaced?
- Property tax is high relative to price — has the assessment been appealed recently, and will the sale trigger a re-assessment?
- Is there a deadline driving the sale (1031 exchange, divorce, estate, relocation)? That informs how much negotiation room exists.
- Crime grade is F in this area — have there been break-ins, vandalism, or insurance claims at this property in the last 3 years? What carrier currently insures it and at what premium?
- What's the average days-on-market for RENTAL listings here right now (not sales)? A rising rental-DOM trend means longer vacancies and softer asking-rent achievability than the comps imply.
- What's the recent tenant-quality profile in this submarket — average credit score on applications, eviction rate, late-payment / NSF rate, and stable-employment percentage? A property-management company in the area should have these aggregated.
- How much new for-sale + rental construction is in the pipeline within 1–3 miles? Heavy new supply typically softens prices + rents 12–24 months out; constrained supply supports both.
Investment metrics
- 1% rule
- 1.31% ✓
- Cap rate
- 8.47%
- Cash-on-cash
- 7.79%
- DSCR
- 1.35
- GRM
- 6.4
CMA / ARV
- ARV (on-the-fly)
- $160,212
- Comps found
- 9
Show comp detail 9 sales within ~0.75 mi
| Address | Dist | Beds/Ba | Sqft | Sold | Price | $/sf | Match |
|---|---|---|---|---|---|---|---|
| 821 Hillburn Dr | 0.00mi | 2/1.0 | 948 (0%) | 1mo | $115,000 | $121 | 99 |
| 824 Carbona Dr | 0.16mi | 2/1.0 | 1,040 (+10%) | 8mo | $179,000 | $172 | 70 |
| 8209 Jacobie Blvd | 0.52mi | 3/2.0 (+1) | 980 (+3%) | 9mo | $214,900 | $219 | 53 |
| 1158 Carbona Dr | 0.45mi | 3/2.0 (+1) | 999 (+5%) | 13mo | $249,999 | $250 | 50 |
| 7211 Elam Rd | 0.67mi | 2/1.0 | 1,059 (+12%) | 2mo | $114,900 | $108 | 47 |
| 1135 Pleasant Dr | 0.70mi | 3/1.0 (+1) | 876 (-8%) | 4mo | $95,000 | $108 | 47 |
| 8246 Marvel Dr | 0.67mi | 2/1.0 | 819 (-14%) | 2mo | $175,000 | $214 | 45 |
| 1339 Traymore Ave | 0.72mi | 3/1.0 (+1) | 1,035 (+9%) | 22mo | $175,000 | $169 | 28 |
| 729 Manhattan Dr | 0.69mi | 3/2.0 (+1) | 1,085 (+14%) | 17mo | $170,000 | $157 | 21 |
Match score weights: distance 35% · size 25% · config 20% · recency 20%. Top-matched comps best support the ARV.
Projected returns pro-forma
-3.0% appreciation · 1.02% rent growth · sell at horizon
- IRR
- -7.0%
- Equity multiple
- 0.75×
- Total profit
- $-8,126
- Equity at exit
- $17,147
- IRR
- -0.5%
- Equity multiple
- 0.97×
- Total profit
- $-982
- Equity at exit
- $9,943
Cash invested: $32,200 (down + closing). Projections, not guarantees.
Landlord ↔ Tenant lean methodology
- Overall (STATE)
- 87 Strongly Landlord-Friendly
- State Texas
- 87 Strongly Landlord-Friendly · R+5
- County
- — inherits STATE
- City
- — inherits STATE
ZIP-level market 75217
- Home prices YoY
- -4.3%
- Rents YoY
- 1.0%
- Active inventory
- 198
- Price-to-rent
- 6.4×
Monthly cashflow live
- Estimated rent
- $1,507 high interval (Pro) →
- Mortgage (P&I)
- −$603
- Tax from tax record
- −$330 /mo · $3,964/yr
- Insurance
- −$48
- HOA
- −$0
- Vacancy / Maint / Mgmt
- −$316
- Net cashflow
- $209
Break-even live
UW: 25.0% down · 7.5% · 30yr · 1.5% tax · 5.0% vac · 8.0% maint · 8.0% mgmt
Financing live
Cash to close
- Down payment
- $28,750
- Closing costs
- $3,450
- Reserves months
- —
- Total cash needed
- —
Loan-product check · same deal, 3 products live
Conventional
25% down · 7.5% · 30yr
- Down + closing
- —
- Monthly P&I
- —
- Monthly cashflow
- —
- DSCR
- —
- Eligible?
- —
Personal DTI + credit; lowest rate.
DSCR
20% down · 8.5% · 30yr
- Down + closing
- —
- Monthly P&I
- —
- Monthly cashflow
- —
- DSCR
- —
- Eligible?
- —
No personal income docs; deal must DSCR.
Hard money
10% down · 12.0% · 12mo
- Down + closing
- —
- Monthly P&I
- —
- Monthly cashflow
- —
- DSCR
- —
- Eligible?
- —
Short-term bridge; refi at stabilization.
Rent comps 15 comps
| Address | Beds | Baths | Sqft | Rent | $/sqft | DOM | Units | Dist |
|---|---|---|---|---|---|---|---|---|
| 8120 Rayville Dr Dallas, TX | 2.0 | 1.0 | 960 | $1,495 | $1.56 | 24d | 1 | 0.48mi |
| 1315 Whitley Dr Unit 2 Dallas, TX | 2.0 | 1.0 | 700 | $1,400 | $2.00 | 43d | 1 | 0.66mi |
| 1315 Whitley Dr Unit 1 Dallas, TX | 2.0 | 1.0 | 1050 | $1,600 | $1.52 | 43d | 1 | 0.66mi |
| 7250 Elam Rd Dallas, TX | 1.0–3.0 | 1.0–2.0 | 724 | $1,368 | $1.89 | 3d | 9 | 0.78mi |
| 8438 Maddox St Dallas, TX | 2.0 | 1.0 | 784 | $1,450 | $1.85 | 3d | 1 | 0.95mi |
| 7203 Great Trinity Forest Way Dallas, TX | 2.0 | 1.0 | 850 | $1,114 | $1.31 | 43d | 1 | 0.97mi |
| 1355 N Jim Miller Rd Unit 23 Dallas, TX | 2.0 | 1.5 | 953 | $1,100 | $1.15 | 3d | 1 | 0.99mi |
| 7516 Olusta Dr Unit 7514 Dallas, TX | 2.0 | 1.0 | 862 | $1,395 | $1.62 | 24d | 1 | 1.04mi |
| 7514 Olusta Dr Dallas, TX | 2.0 | 1.0 | 862 | $1,395 | $1.62 | 17d | 1 | 1.04mi |
| 8714 Quinn St Unit B Dallas, TX | 2.0 | 2.0 | 1090 | $1,495 | $1.37 | 24d | 1 | 1.16mi |
| 8127 Stonehurst St #5 Dallas, TX | 2.0 | 1.0 | 1050 | $1,250 | $1.19 | 43d | 1 | 1.17mi |
| 6811 Marla Dr Dallas, TX | 3.0 | 2.0 | 1070 | $1,850 | $1.73 | 2d | 1 | 1.20mi |
| 6415 Godfrey Ave Dallas, TX | 2.0 | 1.0 | 751 | $1,435 | $1.91 | 2d | 1 | 1.21mi |
| 1942 Prichard Ln Dallas, TX | 1.0 | 1.0 | 565 | $950 | $1.68 | 7d | 1 | 1.38mi |
| 1959 Hillburn Dr Dallas, TX | 3.0 | 1.0 | 912 | $1,700 | $1.86 | 6d | 1 | 1.43mi |
Listing history 7 events
-
2026-05-11status Pending
-
2026-04-28historical Active Option Contract
-
2026-04-23$115,000 Active
-
2012-10-03soldstatus Closed 133-char remark
Show marketing remark (133 chars)
Great little starter home. Already FHA appraised. Appliances included in home. Back yard with large tree. Carport and one car garage.
-
2012-09-21status Pending 133-char remark
Show marketing remark (133 chars)
Great little starter home. Already FHA appraised. Appliances included in home. Back yard with large tree. Carport and one car garage.
-
2012-09-13$35,000 Active 133-char remark
Show marketing remark (133 chars)
Great little starter home. Already FHA appraised. Appliances included in home. Back yard with large tree. Carport and one car garage.
-
1950-06-13soldstatus
ⓘ Source: listings_history table (triggers on properties + properties_extension) + one-shot
backfill from property_details.listing_events for pre-trigger history.
Tax reassessment forecast TX · Resets to sale price
- Current annual tax
- $3,964 · $330/mo
- Projected year-2 tax
- $3,964 · $330/mo
- Expected delta
- $0/yr ($0/mo · 0.0%)
ⓘ Screening estimate from a state-policy table — verify with the county assessor before closing.
Climate risk First Street
- Flood 1/10 Low FEMA zone X (unshaded) · 0% chance over 30 yrs
- Wildfire 3/10 Moderate
- Heat 7/10 Severe 7 d/yr ≥110°F today · 24 d/yr by 30 yrs out
- Wind 6/10 Major 27% chance of damaging wind over 30 yrs
- Air quality 2/10 Low 1 unhealthy d/yr today · 2 by 30 yrs out
Nearby sold comps map
Loading sold comps map…
Walkable amenities ~0.75 mi
Loading nearby amenities…
Taxation est. · year 1
- Rental income
- $18,081
- − Mortgage interest
- −$6,442
- − Property taxes
- −$3,964
- − Insurance
- −$575
- − Repairs & maintenance
- −$1,446
- − Management
- −$1,446
- − Depreciation
- −$3,345
- Taxable income
- $862
- Est. tax owed @ 24.0%
- −$207
- After-tax cash flow
- $2,302/yr
For passive investors: Depreciation is non-cash, so a rental often shows a tax loss while cash-flowing — sheltering income. Rental losses are passive: they offset passive income freely, and up to $25,000/yr can offset ordinary (W-2) income if you actively participate and your MAGI is under $100k (phasing out to $0 by $150k); unused losses carry forward. On sale, claimed depreciation is recaptured at up to 25%, and gains may owe capital-gains tax (a 1031 exchange can defer both). Figures are a year-1 estimate at your 24.0% rate — not tax advice; consult a CPA.
Schools (NCES district)
- District
- Dallas ISD
- NCES district ID
- 4816230
- Math proficiency
- 31% ▼ -16.00%
- Reading proficiency
- 36% ▼ -4.00%
- Median HH income
- $42,881
- Composite
- 28.41/100
- National rank
- #6763
- State rank
- #559 of 826 in TX
Livability — Dallas
- Score
- 81/100
- State rank
- #24
- US rank
- #1380
Category grades
Schools grade is shown separately in the Schools card above.
Census & demographics
- Census place
- Dallas, TX
- County
- Dallas County · 2,612,404 people
- City population
- 1,168,437
- Metro
- Dallas-Fort Worth-Arlington, TX
- Population (ZIP)
- 85,028
- Household income
- $55,723
- Rent vs Own
- Severe rent burden
- 2649.0
Population outlook (Dallas County) Hauer SSP2
- Today (2025)
- 2,979,839 people
- By 2030
- 3,191,823 · +7.1%
- By 2040
- 3,619,611 · +21.5%
- By 2050
- 4,026,915 · +35.1%
- By 2075
- 4,957,073 · +66.4%
- By 2100
- 5,508,725 · +84.9%
Race, ethnicity, and origin ACS 2023
- Neighborhood character
- Predominantly Hispanic (73%)
- Race & ethnicity
- Hispanic / Latino 73% Two or more races 34% Black 20% White 6%
- Hispanic origin (detail)
- Mexican 68%
- Foreign-born
- 30% · Canada, Philippines
- Languages at home
- 34% English-only · Spanish 65% Other Asian/Pacific 1%
Political lean MEDSL · Dallas
- 2024 margin
- Strong D (+22.2) · D 60.2% · R 38.0% · Other 1.8%
- 2008→2024 swing
- +6.9pp toward D · 2008: 15.3pp · 2024: 22.2pp
- All cycles
- 2024: D+22.2 2020: D+31.6 2016: D+26.2 2012: D+15.4 2008: D+15.3
Not yet ingested
- Civics
- —
Market trends
- HPI YoY
- ▼ -17.04%
- Current HPI
- 382.5527
- Rent YoY
- ▲ 1.02%
- Metro
- Dallas-Fort Worth-Arlington, TX
- State GDP YoY
- ▲ 3.95%
- F500 in state
- 110
Industry mix (Fortune 500 HQ in TX)
| Industry | F500 HQs | Revenue |
|---|---|---|
| Energy | 16 | $1,198B |
|
||
| Technology | 5 | $198B |
|
||
| Engineering / Construction | 4 | $72B |
|
||
| Energy Services | 3 | $60B |
|
||
| Utilities | 3 | $41B |
|
||
| Healthcare | 2 | $330B |
|
||
Price history
+228.6% since first listed7 events — show timeline
- 2026-05-11 Pending — NTREIS
- 2026-04-28 Contingent — NTREIS
- 2026-04-23 Listed $115,000 NTREIS
- 2012-10-03 Sold (MLS) — NTREIS
- 2012-09-21 Pending — NTREIS
- 2012-09-13 Listed $35,000 NTREIS
- 1950-06-13 Sold (Public Records) — Public Records
Property tax history
+6.1%/yrLatest (2025): $3,964 · -4.9% YoY. Source: county tax records.
Cash-flow waterfall
monthlySold comps — $/sqft
last 12 mo · ≤1 miLoading sold comps…