2181 Allan Crest Rd · Blythewood, SC
Flood risk No data
- FEMA flood zone
- —
- Chance of flooding over 30 yrs
- —
- Est. flood insurance / yr
- —
Fire risk No data
- Est. fire insurance / yr
- —
Heat risk No data
- Hot days now (above threshold)
- —
- Hot days in 30 yrs
- —
Wind risk No data
- Chance of severe wind over 30 yrs
- —
Air-quality risk No data
- Unhealthy air days now
- —
- Unhealthy air days in 30 yrs
- —
Risk factors via First Street. Map © Google.
Why this score? — see what drove the D- grade
The composite is a weighted blend of 9 inputs, each scored 0–100. Each bar is that input's sub-score; the figure is the points it added to the 100-point composite (weight × sub-score).
- Cash flow +11.2/30.0
- ARV discount +7.5/15.0
- Condition / age +4.0/5.0
- Schools +3.6/10.0
- 1% rule +3.5/10.0
- Livability +3.5/5.0
- DSCR +3.3/10.0
- Rent growth +2.5/5.0
- Appreciation +0.0/10.0
$304,900
🖨 Deal sheet 📄 Offer letter ✓ Due diligence
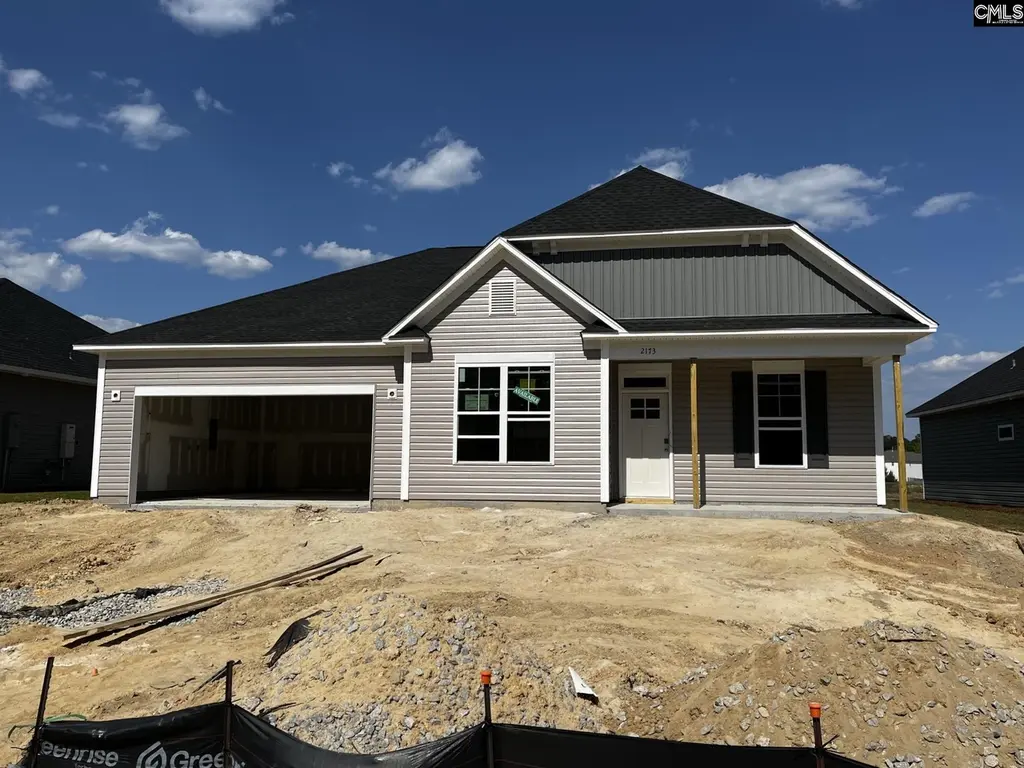
Listing remarks
The Addison II plan located in Blythewood Farms in a spacious single-story home designated to provide comfort and style. This plan is ideal for those seeking both functionality and elegance in their living space. The home features a formal dining area, perfect for entertaining guests or enjoying family meals. The oversized great room offers ample space for relaxation and gatherings, seamlessly connecting to the open kitchen. The kitchen includes a convenient bar area, making it an excellent spot for casual dining or serving refreshments. Additionally, a covered patio extends the living space outdoors, offering a comfortable area for relaxation or entertaining. The Owner Suite is thoughtfull
Key facts
- Covered patio
- Formal dining area
- Oversized great room
Tags
Property features AI
Finance
- Other: Community pool; New construction builder warranty
- HOA & community: Has association; Association maintains common areas, pool, and green areas
Exterior
- Parking: Attached 2-car garage (main level); Two total parking spaces
- Utilities: Public sewer; Public water
- Home design: Single-story home
- Construction: Slab foundation
- Exterior features: Vinyl exterior finish; Paved road access; Public water
Interior
- Kitchen: Island; Pantry; Granite countertops; Tiled backsplash; Painted cabinets; Dishwasher; Disposal; Microwave above stove; Free-standing smooth-surface self-cleaning range; Luxury vinyl plank flooring in kitchen
- Bedrooms: Master bedroom on main level; Additional bedrooms on main level with private closets and carpeted floors
- Flooring: Carpet in bedrooms; Luxury vinyl plank in great room and kitchen
- Bathrooms: Two full bathrooms
- Heating & cooling: Central cooling; Gas heating on first level
- Interior features: Attic storage with attic access; Ceiling fans; Garage door opener; Smoke detector; Electric fireplace (1)
- Laundry & utility: Laundry on main level in heated space; Tankless water heater
Neighborhood map
What this means for you Summary
Snapshot
- This is a 3-bed/2.0-bath single-family listed at $305k. Condition is rated good.
Deal economics
- At list price, monthly cash flow is $-116 ($-1k/yr) — negative.
- To cash-flow at today's rent, offer at most $288k (5.5% below list).
- To meet the 1% rule (rent ≥ 1% of price), the offer needs to be $258k (15.2% below list).
- Recommended offer: $258k (15.2% below list) — sets the bar for 1% rule.
Location & tenants
- Location reads 70/100 on livability (#58 in SC) — a middle-class / working-renter tenant base. Strengths: crime A+, employment A+, housing A+; Watch: amenities F, commute F, health & safety F.
- Richland 02 (suburban): math 35% / reading 47% proficiency, ranked #29 of 80 in SC (top 36%) — families likely to look elsewhere, expect single-tenant / working-renter base with shorter leases.
- Zoned schools: Langford Elementary (math 39% / reading 43%, grade F, #276 of 597 statewide, top 48%, 609 students, 64% FRL); Blythewood High (math 72% / reading 92%, grade A, #19 of 196 statewide, top 10%, 2,094 students, 39% FRL).
- Zoned-school proficiency averages 62% at this address vs 41% district-wide (+20 pts) — the actual schools serving this property are materially stronger than the Richland 02 average implies; a family-tenant draw the district grade alone would hide.
- Market conditions: 650 active listings in the ZIP; 5 comparable units currently listed for rent nearby; rentals leasing fast (median 3d on market — plan ~1-2 weeks tenant-placement turnaround); solid renter incomes; 3,472 units permitted in Richland County in 2024 (1,096 in 5+ unit buildings).
- This rent runs 33% of the median local income ($95k/yr) — at the standard rent-burdened threshold; future hikes will face affordability resistance.
Forward outlook
- Local home prices are declining (-3.0%/yr); year-one equity from $2k of loan paydown is wiped out by about $9k of value loss. Plan a longer hold.
- Richland County population projected at +30% by 2050 — long-run rental-demand tailwind backs the buy-and-hold thesis.
Negotiation context
- Only 12 days on market — expect competitive offers; lowballing is unlikely to land.
- 3 sale attempts; this cycle's ask has dropped $21k (6%) from the opening price — seller is motivated, your offer sets the floor, not the list.
Questions for the listing agent
- What do current leases actually rent for vs. the listed asking? Can we see a recent rent roll and the last 12 months of T-12 income?
- What does the HOA fee cover, when was the last increase, and are there any pending special assessments or reserve-fund shortfalls?
- Is there a deadline driving the sale (1031 exchange, divorce, estate, relocation)? That informs how much negotiation room exists.
- Schools are B-rated — typically a magnet for longer-tenancy family renters. What's the average tenant stay here, and is there a school-zone premium baked into asking?
- The area grade is low — what's the realistic commute time and amenity access for the typical tenant pool here? Any planned neighborhood developments (good or bad) we should know about?
- What's the average days-on-market for RENTAL listings here right now (not sales)? A rising rental-DOM trend means longer vacancies and softer asking-rent achievability than the comps imply.
- What's the recent tenant-quality profile in this submarket — average credit score on applications, eviction rate, late-payment / NSF rate, and stable-employment percentage? A property-management company in the area should have these aggregated.
- How much new for-sale + rental construction is in the pipeline within 1–3 miles? Heavy new supply typically softens prices + rents 12–24 months out; constrained supply supports both.
Investment metrics
- 1% rule
- 0.85% ✗
- Cap rate
- 5.84%
- Cash-on-cash
- -1.63%
- DSCR
- 0.93
- GRM
- 9.8
CMA / ARV
No comps found within radius.
Projected returns pro-forma
-3.0% appreciation · 3.0% rent growth · sell at horizon
- IRR
- -19.0%
- Equity multiple
- 0.34×
- Total profit
- $-56,700
- Equity at exit
- $45,462
- IRR
- -11.4%
- Equity multiple
- 0.31×
- Total profit
- $-58,572
- Equity at exit
- $26,362
Cash invested: $85,372 (down + closing). Projections, not guarantees.
Landlord ↔ Tenant lean methodology
- Overall (STATE)
- 90 Strongly Landlord-Friendly
- State South Carolina
- 90 Strongly Landlord-Friendly · R+6
- County
- — inherits STATE
- City
- — inherits STATE
ZIP-level market 29016
- Home prices YoY
- -26.3%
- Active inventory
- 650
- Price-to-rent
- 9.8×
Monthly cashflow live
- Estimated rent
- $2,584 high interval (Pro) →
- Mortgage (P&I)
- −$1,599
- Tax est. 1.5%
- −$381 /mo · $4,574/yr
- Insurance
- −$127
- HOA
- −$50
- Vacancy / Maint / Mgmt
- −$543
- Net cashflow
- $-116
Break-even live
UW: 25.0% down · 7.5% · 30yr · 1.5% tax · 5.0% vac · 8.0% maint · 8.0% mgmt
Financing live
Cash to close
- Down payment
- $76,225
- Closing costs
- $9,147
- Reserves months
- —
- Total cash needed
- —
Loan-product check · same deal, 3 products live
Conventional
25% down · 7.5% · 30yr
- Down + closing
- —
- Monthly P&I
- —
- Monthly cashflow
- —
- DSCR
- —
- Eligible?
- —
Personal DTI + credit; lowest rate.
DSCR
20% down · 8.5% · 30yr
- Down + closing
- —
- Monthly P&I
- —
- Monthly cashflow
- —
- DSCR
- —
- Eligible?
- —
No personal income docs; deal must DSCR.
Hard money
10% down · 12.0% · 12mo
- Down + closing
- —
- Monthly P&I
- —
- Monthly cashflow
- —
- DSCR
- —
- Eligible?
- —
Short-term bridge; refi at stabilization.
Rent comps 5 comps
| Address | Beds | Baths | Sqft | Rent | $/sqft | DOM | Units | Dist |
|---|---|---|---|---|---|---|---|---|
| 227 Honey Hill Way Blythewood, SC | 3.0 | 2.5 | 1689 | $2,180 | $1.29 | 2d | 1 | 0.25mi |
| 242 Honey Hill Way Blythewood, SC | 4.0 | 2.5 | 1926 | $2,750 | $1.43 | 11d | 1 | 0.26mi |
| 948 Beaufort Farm Rd Blythewood, SC | 3.0 | 2.5 | 1986 | $2,200 | $1.11 | 2d | 1 | 0.26mi |
| 232 Boulder Ridge Loop Blythewood, SC | 4.0 | 2.5 | 1902 | $2,299 | $1.21 | 14d | 1 | 0.45mi |
| 463 N High Duck Trl Blythewood, SC | 3.0 | 2.5 | 1604 | $2,200 | $1.37 | 3d | 1 | 1.28mi |
HOA detail
- Monthly dues
- $50 · $600/yr
Listing history 10 events
-
2026-05-21status Pending
-
2026-05-16price $304,900
-
2026-05-09$325,900 Active
-
2026-05-01status Active
-
2026-05-01historical
-
2026-04-29price $325,900
-
2026-04-23price $329,900
-
2026-04-20price $332,132
-
2026-04-20price $328,042
-
2026-03-22$332,132 Active
ⓘ Source: listings_history table (triggers on properties + properties_extension) + one-shot
backfill from property_details.listing_events for pre-trigger history.
Nearby sold comps map
Loading sold comps map…
Walkable amenities ~0.75 mi
Loading nearby amenities…
Taxation est. · year 1
- Rental income
- $31,010
- − Mortgage interest
- −$17,079
- − Property taxes
- −$4,574
- − Insurance
- −$1,524
- − Repairs & maintenance
- −$2,481
- − Management
- −$2,481
- − HOA
- −$600
- − Depreciation
- −$8,870
- Taxable loss
- −$6,599
- Est. tax savings @ 24.0%
- +$1,584
- After-tax cash flow
- $196/yr
For passive investors: Depreciation is non-cash, so a rental often shows a tax loss while cash-flowing — sheltering income. Rental losses are passive: they offset passive income freely, and up to $25,000/yr can offset ordinary (W-2) income if you actively participate and your MAGI is under $100k (phasing out to $0 by $150k); unused losses carry forward. On sale, claimed depreciation is recaptured at up to 25%, and gains may owe capital-gains tax (a 1031 exchange can defer both). Figures are a year-1 estimate at your 24.0% rate — not tax advice; consult a CPA.
Condition & rehab AI · 12 photos
This single-story home in Blythewood Farms is in excellent condition with modern finishes and a spacious layout. It is move-in ready and would benefit from minor updates to further enhance its appeal.
Value-add opportunities
- Both Painting the exterior and interior walls — Fresh paint enhances curb appeal and interior aesthetics.
- Both Installing new flooring in the kitchen and bathrooms — Modern flooring improves the look and feel of the home, attracting more buyers and renters.
- Both Upgrading the kitchen appliances — Modern appliances enhance functionality and appeal to a broader range of potential buyers and renters.
- Both Landscaping the front yard — A well-maintained front yard improves curb appeal and adds value to the home.
Renovation cost estimate screening
Value-add ROI direction
- Both Painting the exterior and interior walls — Fresh paint enhances curb appeal and interior aesthetics. ↑
- Both Installing new flooring in the kitchen and bathrooms — Modern flooring improves the look and feel of the home, attracting more buyers and renters. ↑
- Both Upgrading the kitchen appliances — Modern appliances enhance functionality and appeal to a broader range of potential buyers and renters. ↑
- Both Landscaping the front yard — A well-maintained front yard improves curb appeal and adds value to the home. ↑
ⓘ Cost ranges are severity-bucket heuristics (US national rule-of-thumb). Get contractor quotes + a written scope before underwriting a rehab budget.
Schools (NCES district)
- District
- Richland 02
- NCES district ID
- 4503390
- Math proficiency
- 35% ▼ -15.00%
- Reading proficiency
- 47% ▼ -5.00%
- Median HH income
- $59,684
- Composite
- 36.2/100
- National rank
- #4730
- State rank
- #29 of 80 in SC
Livability — Blythewood
- Score
- 70/100
- State rank
- #58
- US rank
- #7406
Category grades
Schools grade is shown separately in the Schools card above.
Census & demographics
- County
- Richland County · 389,530 people
- City population
- 30,454
- Metro
- Columbia, SC
- Population (ZIP)
- 30,454
- Household income
- $95,082
- Rent vs Own
- Severe rent burden
- 559.0
Population outlook (Richland County) Hauer SSP2
- Today (2025)
- 459,667 people
- By 2030
- 487,524 · +6.1%
- By 2040
- 542,035 · +17.9%
- By 2050
- 595,371 · +29.5%
- By 2075
- 732,998 · +59.5%
- By 2100
- 820,415 · +78.5%
Race, ethnicity, and origin ACS 2023
- Neighborhood character
- Diverse neighborhood (Simpson 0.64)
- Race & ethnicity
- Black 43% White 42% Two or more races 7% Hispanic / Latino 7% Asian 3%
- Hispanic origin (detail)
- Mexican 1% Puerto Rican 2%
- Common ancestry
- Lithuanian 2% Romanian 2% Slovak 2%
- Foreign-born
- 5% · Canada, China
- Languages at home
- 90% English-only · Spanish 5% Other Indo-European 1% German/W. Germanic 1%
Political lean MEDSL · Richland
- 2024 margin
- Solid D (+34.6) · D 66.4% · R 31.8% · Other 1.8%
- 2008→2024 swing
- +5.7pp toward D · 2008: 28.9pp · 2024: 34.6pp
- All cycles
- 2024: D+34.6 2020: D+38.3 2016: D+32.9 2012: D+33.3 2008: D+28.9
Not yet ingested
- Civics
- —
Market trends
- HPI YoY
- ▼ -65.48%
- Current HPI
- 183.5933
- Rent YoY
- —
- Metro
- Columbia, SC
- State GDP YoY
- ▲ 4.51%
- F500 in state
- 2
Industry mix (Fortune 500 HQ in SC)
| Industry | F500 HQs | Revenue |
|---|---|---|
| Packaging | 1 | $7B |
|
||
Price history
-8.2% since first listed10 events — show timeline
- 2026-05-21 Pending — Consolidated MLS
- 2026-05-16 Price Changed $304,900 Consolidated MLS
- 2026-05-09 Listed $325,900 Consolidated MLS
- 2026-05-01 Relisted — Consolidated MLS
- 2026-05-01 Delisted — Consolidated MLS
- 2026-04-29 Price Changed $325,900 Consolidated MLS
- 2026-04-23 Price Changed $329,900 Consolidated MLS
- 2026-04-20 Price Changed $332,132 Consolidated MLS
- 2026-04-20 Price Changed $328,042 Consolidated MLS
- 2026-03-22 Listed $332,132 Consolidated MLS
Cash-flow waterfall
monthlySold comps — $/sqft
last 12 mo · ≤1 miLoading sold comps…