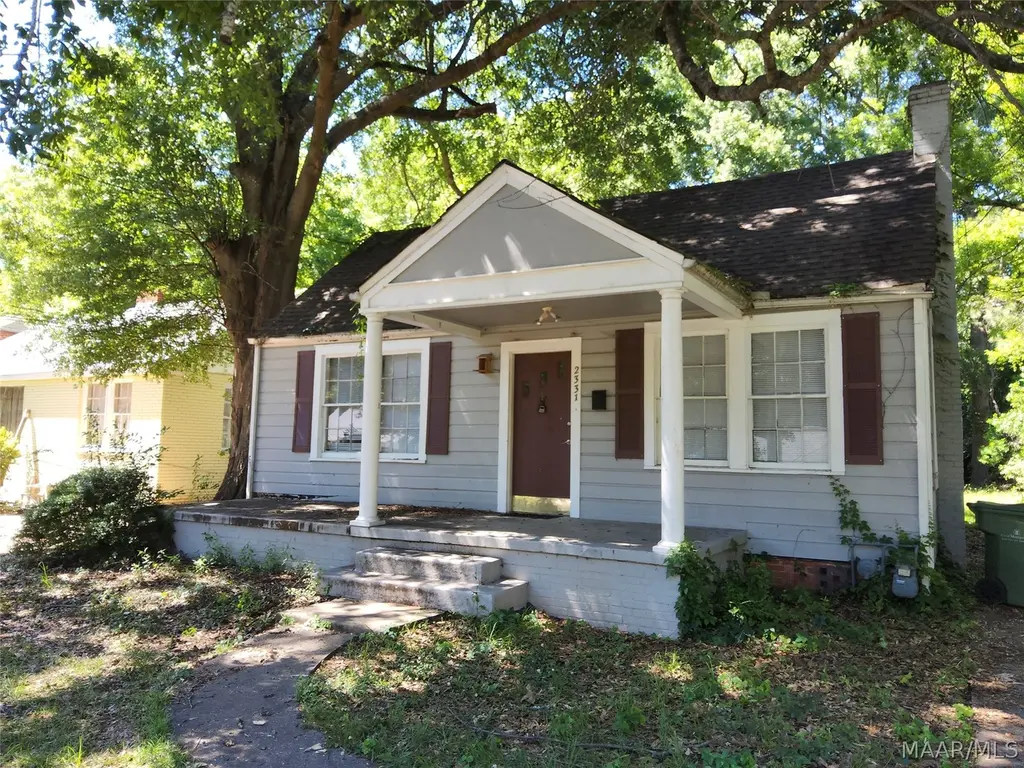
2331 Glendale Ave · Montgomery, AL
Flood risk 1/10 · Minimal
- FEMA flood zone
- X (unshaded)
- Chance of flooding over 30 yrs
- 0.0%
- Est. flood insurance / yr
- $507 – $1,088
Fire risk 1/10 · Minimal
- Est. fire insurance / yr
- $916 – $1,700
Heat risk 7/10 · Major
- Hot days now (above 107°F)
- 7 days/yr
- Hot days in 30 yrs
- 19 days/yr
Wind risk 8/10 · Major
- Chance of severe wind over 30 yrs
- 80.0%
Air-quality risk 3/10 · Minor
- Unhealthy air days now
- 4 days/yr
- Unhealthy air days in 30 yrs
- 4 days/yr
Risk factors via First Street. Map © Google.
Why this score? — see what drove the B- grade
The composite is a weighted blend of 9 inputs, each scored 0–100. Each bar is that input's sub-score; the figure is the points it added to the 100-point composite (weight × sub-score).
- Cash flow +30.0/30.0
- DSCR +10.0/10.0
- ARV discount +9.4/15.0
- 1% rule +7.8/10.0
- Rent growth +3.8/5.0
- Livability +3.2/5.0
- Condition / age +2.5/5.0
- Schools +1.7/10.0
- Appreciation +0.0/10.0
$79,900
🖨 Deal sheet 📄 Offer letter ✓ Due diligence
Listing remarks
Classic charm and character shine throughout this Capitol Heights cottage at 2331 Glendale Ave. From the inviting front porch to the beautiful hardwood floors, built-in shelving, and decorative fireplace, this home offers timeless style with plenty of space to make your own. Large living and dining areas create an open, comfortable feel, while the nicely sized bedrooms provide flexibility for everyday living or a home office. Conveniently located near downtown Montgomery, shopping, dining, and local parks, this property could be a great fit for an owner-occupant or investor looking for classic Capitol Heights character.
Key facts
- Decorative fireplace
- Front porch
- Built-in shelving
Tags
Property features AI
Exterior
- Parking: Driveway
- Utilities: Public water; Public sewer; Electricity available; Natural gas available; Cable available; High-speed internet available
- Home design: Single-story home
- Construction: Asbestos construction material; Year built from public records
- Exterior features: Partial privacy fence; City lot
Interior
- Kitchen: Kitchen on the first floor
- Bedrooms: 2 bedrooms on the first floor
- Flooring: Tile; Wood
- Bathrooms: 1 full bathroom on the first floor
- Heating & cooling: Central heating (gas); Central air; Ceiling fans; Electric cooling components
- Interior features: Tile and wood flooring; Washer hookup; Water heater
- Laundry & utility: Washer hookup
Neighborhood map
What this means for you Summary
Snapshot
- This is a 2-bed/1.0-bath single-family listed at $80k.
Deal economics
- At list price, monthly cash flow is $299 ($4k/yr) — positive.
- The deal already cash-flows at list — no discount required.
- Meets the 1% rule at list price ($1k rent vs $80k).
- Recommended offer: $78k (3.0% below list) — sets the bar for market timing.
- Cap rate 10.8% vs local median 6.0% in Montgomery — top-decile yield for the area; either an underpriced asset or a hidden risk that comps aren't pricing in. Stress-test before assuming the spread holds.
Location & tenants
- Location reads 65/100 on livability (#138 in AL) — a middle-class / working-renter tenant base. Strengths: cost of living A+, housing A+; Watch: schools C-, employment D, crime F.
- Montgomery County (urban): math 9% / reading 31% proficiency, ranked #106 of 129 in AL (top 82%) — low school quality limits family demand, transient renter base, plan for 1-2y turnover; 70% free/reduced lunch — lower-income household profile, screen leases tightly.
- Market conditions: Rents rising fast (+5.0%/yr); 67 active listings in the ZIP; 40 comparable units currently listed for rent nearby; rentals lingering (median 44d on market — plan ~5-8 weeks vacancy on turnover, expect pricing pressure); 60% of comp listings sitting > 30 days — soft ceiling on asking rent; lower-income renter base — watch delinquency; 460 units permitted in Montgomery County in 2024 (37 in 5+ unit buildings).
- This rent runs 38% of the median local income ($32k/yr) — at the standard rent-burdened threshold; future hikes will face affordability resistance.
Forward outlook
- Local home prices are declining (-3.0%/yr); year-one equity from $552 of loan paydown is wiped out by about $2k of value loss. Plan a longer hold.
- Montgomery County population projected to shrink 8% by 2050 — rents likely to lag national; underwrite the cash flow, not the appreciation.
- At projected returns (-3.0% appreciation + 5.0% rent growth), your $22k cash investment doubles in ~7 years — after that, you're playing with house money.
Negotiation context
- It's been on market 34 days — a 3% lower offer ($78k) is reasonable based on typical stale-listing flexibility.
Risks & watch-outs
- Watch-outs: built in 1940 — expect roof / HVAC / electrical / plumbing capex.
- Climate carrying-cost: severe wind risk, 80% chance of damaging wind over 30y; extreme-heat days projected 7→19/yr by 2055 (HVAC capex compounding) — expect insurance premiums to compound above CPI over the hold.
Questions for the listing agent
- It's been on market 34 days. Have you received any prior offers? Is the seller open to a 3% concession, seller financing, or rate buy-down credit?
- Built in 1940 — when were the roof, HVAC, electrical panel, plumbing, and water heater last replaced?
- Is there a deadline driving the sale (1031 exchange, divorce, estate, relocation)? That informs how much negotiation room exists.
- Crime grade is F in this area — have there been break-ins, vandalism, or insurance claims at this property in the last 3 years? What carrier currently insures it and at what premium?
- What's the average days-on-market for RENTAL listings here right now (not sales)? A rising rental-DOM trend means longer vacancies and softer asking-rent achievability than the comps imply.
- What's the recent tenant-quality profile in this submarket — average credit score on applications, eviction rate, late-payment / NSF rate, and stable-employment percentage? A property-management company in the area should have these aggregated.
- How much new for-sale + rental construction is in the pipeline within 1–3 miles? Heavy new supply typically softens prices + rents 12–24 months out; constrained supply supports both.
Investment metrics
- 1% rule
- 1.28% ✓
- Cap rate
- 10.79%
- Cash-on-cash
- 16.06%
- DSCR
- 1.71
- GRM
- 6.5
CMA / ARV
- ARV (median comp)
- $83,471
- List price
- $79,900
- Delta
- -4.28%
- Verdict
- FAIR
- Comps
- 20 within 1.0 mi
Show comp detail 12 sales within ~0.75 mi
| Address | Dist | Beds/Ba | Sqft | Sold | Price | $/sf | Match |
|---|---|---|---|---|---|---|---|
| 2318 Winona Ave | 0.30mi | 2/1.0 | 1,118 (-3%) | 2mo | $89,000 | $80 | 79 |
| 13 Oak Forest Dr | 0.53mi | 2/1.0 | 1,110 (-4%) | 2mo | $46,500 | $42 | 68 |
| 2119 Mckinley Ave | 0.26mi | 2/1.0 | 987 (-14%) | 8mo | $34,000 | $34 | 57 |
| 2050 Yancey Ave | 0.37mi | 3/2.0 (+1) | 1,040 (-10%) | 8mo | $95,000 | $91 | 51 |
| 13 Bradley Dr | 0.50mi | 3/1.0 (+1) | 1,264 (+10%) | 6mo | $110,000 | $87 | 50 |
| 171 Salem Dr | 0.68mi | 3/1.0 (+1) | 1,067 (-7%) | 1mo | $101,000 | $95 | 50 |
| 2015 Stokes St | 0.38mi | 3/2.0 (+1) | 1,280 (+11%) | 7mo | $100,000 | $78 | 49 |
| 2019 Stokes St | 0.37mi | 3/2.0 (+1) | 1,280 (+11%) | 8mo | $105,000 | $82 | 48 |
| 105 Dunn Dr | 0.54mi | 2/1.0 | 1,295 (+12%) | 7mo | $50,600 | $39 | 48 |
| 111 Bradley Dr | 0.65mi | 3/2.0 (+1) | 1,222 (+6%) | 8mo | $8,000 | $7 | 44 |
| 49 Marlborough St | 0.59mi | 3/2.0 (+1) | 1,252 (+9%) | 6mo | $115,900 | $93 | 44 |
| 3 Kent St | 0.61mi | 3/2.0 (+1) | 1,305 (+13%) | 1mo | $102,750 | $79 | 40 |
Match score weights: distance 35% · size 25% · config 20% · recency 20%. Top-matched comps best support the ARV.
Projected returns pro-forma
-3.0% appreciation · 5.05% rent growth · sell at horizon
- IRR
- 9.2%
- Equity multiple
- 1.37×
- Total profit
- $8,249
- Equity at exit
- $11,913
- IRR
- 19.9%
- Equity multiple
- 2.83×
- Total profit
- $40,857
- Equity at exit
- $6,908
Cash invested: $22,372 (down + closing). Projections, not guarantees.
Landlord ↔ Tenant lean methodology
- Overall (STATE)
- 90 Strongly Landlord-Friendly
- State Alabama
- 90 Strongly Landlord-Friendly · R+15
- County
- — inherits STATE
- City
- — inherits STATE
ZIP-level market 36107
- Home prices YoY
- -10.9%
- Rents YoY
- 5.0%
- Active inventory
- 67
- Price-to-rent
- 6.5×
Monthly cashflow live
- Estimated rent
- $1,019 high interval (Pro) →
- Mortgage (P&I)
- −$419
- Tax from tax record
- −$53 /mo · $640/yr
- Insurance
- −$33
- HOA
- −$0
- Vacancy / Maint / Mgmt
- −$214
- Net cashflow
- $299
Break-even live
UW: 25.0% down · 7.5% · 30yr · 1.5% tax · 5.0% vac · 8.0% maint · 8.0% mgmt
Financing live
Cash to close
- Down payment
- $19,975
- Closing costs
- $2,397
- Reserves months
- —
- Total cash needed
- —
Loan-product check · same deal, 3 products live
Conventional
25% down · 7.5% · 30yr
- Down + closing
- —
- Monthly P&I
- —
- Monthly cashflow
- —
- DSCR
- —
- Eligible?
- —
Personal DTI + credit; lowest rate.
DSCR
20% down · 8.5% · 30yr
- Down + closing
- —
- Monthly P&I
- —
- Monthly cashflow
- —
- DSCR
- —
- Eligible?
- —
No personal income docs; deal must DSCR.
Hard money
10% down · 12.0% · 12mo
- Down + closing
- —
- Monthly P&I
- —
- Monthly cashflow
- —
- DSCR
- —
- Eligible?
- —
Short-term bridge; refi at stabilization.
Rent comps 40 comps
| Address | Beds | Baths | Sqft | Rent | $/sqft | DOM | Units | Dist |
|---|---|---|---|---|---|---|---|---|
| 2310 Yancey Ave Montgomery, AL | 3.0 | 1.0 | 1212 | $1,250 | $1.03 | 43d | 1 | 0.23mi |
| 2122 Windsor Ave Montgomery, AL | 2.0 | 1.0 | 1052 | $725 | $0.69 | 43d | 1 | 0.26mi |
| 2243 Winona Ave Montgomery, AL | 3.0 | 1.0 | 1492 | $1,225 | $0.82 | 21d | 1 | 0.28mi |
| 2241 Saint Charles Ave Unit 2247 Montgomery, AL | 1.0 | 1.0 | 915 | $1,475 | $1.61 | 43d | 1 | 0.34mi |
| 2023 Windsor Ave Montgomery, AL | 2.0 | 1.0 | 889 | $895 | $1.01 | 43d | 1 | 0.35mi |
| 2121 Winona Ave Unit 2123 Montgomery, AL | 1.0 | 1.5 | 828 | $995 | $1.20 | 13d | 1 | 0.36mi |
| 108 Calhoun Rd Unit 108B Montgomery, AL | 2.0 | 1.0 | 1350 | $750 | $0.56 | 43d | 1 | 0.38mi |
| 7 Calhoun Rd Unit B Montgomery, AL | 2.0 | 1.0 | 961 | $850 | $0.88 | 43d | 1 | 0.41mi |
| 2009 Yancey Ave Montgomery, AL | 3.0 | 1.0 | 1140 | $1,080 | $0.95 | 21d | 1 | 0.42mi |
| 517 N Florida St Unit B Montgomery, AL | 2.0 | 1.0 | 900 | $750 | $0.83 | 43d | 1 | 0.42mi |
| 2229 Madison Ave Montgomery, AL | 2.0 | 1.0 | 1100 | $625 | $0.57 | 43d | 1 | 0.44mi |
| 15 Bradley Dr Montgomery, AL | 3.0 | 2.0 | 1365 | $1,500 | $1.10 | 21d | 1 | 0.49mi |
| 424 N California St Apt D Montgomery, AL | 2.0 | 1.0 | 850 | $778 | $0.92 | 21d | 1 | 0.50mi |
| 2006 Harmon St Unit 3 Montgomery, AL | 3.0 | 1.0 | 800 | $500 | $0.62 | 43d | 1 | 0.62mi |
| 2113 Brewton St Montgomery, AL | 3.0 | 1.0 | 1363 | $1,150 | $0.84 | 43d | 1 | 0.67mi |
| 1324 Federal Dr Montgomery, AL | 2.0 | 1.0 | 1000 | $1,100 | $1.10 | 43d | 1 | 0.69mi |
| 122 Oak Forest Dr Montgomery, AL | 3.0 | 1.0 | 1092 | $975 | $0.89 | 21d | 1 | 0.70mi |
| 200 Eton Rd Montgomery, AL | 3.0 | 1.5 | 1500 | $895 | $0.60 | 13d | 1 | 0.71mi |
| 319 Olivia Ct Montgomery, AL | 2.0 | 1.0 | 850 | $700 | $0.82 | 21d | 1 | 0.72mi |
| 1827 Capitol Ave Montgomery, AL | 2.0 | 1.0 | 1068 | $1,600 | $1.50 | 43d | 1 | 0.75mi |
| 1827 Capitol Ave Montgomery, AL | 2.0 | 1.0 | 1068 | $1,600 | $1.50 | 13d | 1 | 0.75mi |
| 186 E Salem Dr Montgomery, AL | 3.0 | 1.0 | 1040 | $1,195 | $1.15 | 21d | 1 | 0.75mi |
| 67 Holliday Dr Montgomery, AL | 3.0 | 1.0 | 1156 | $1,200 | $1.04 | 43d | 1 | 0.79mi |
| 508 Glenmore Rd Montgomery, AL | 2.0 | 1.0 | 1135 | $1,000 | $0.88 | 43d | 1 | 0.80mi |
| 2001 Speigle St Montgomery, AL | 3.0 | 1.0 | 1260 | $1,035 | $0.82 | 43d | 1 | 0.81mi |
| 301 Bradley Dr Montgomery, AL | 2.0 | 1.0 | 841 | $935 | $1.11 | 13d | 1 | 0.83mi |
| 3319 Willow Lane Dr Montgomery, AL | 3.0 | 2.0 | 1032 | $1,200 | $1.16 | 43d | 1 | 0.84mi |
| 2503 Skyline Ave Montgomery, AL | 3.0 | 1.0 | 1015 | $1,150 | $1.13 | 43d | 1 | 0.85mi |
| 311 Bradley Dr Montgomery, AL | 3.0 | 1.0 | 1104 | $825 | $0.75 | 43d | 1 | 0.87mi |
| 3329 Vermont Dr Montgomery, AL | 3.0 | 1.5 | 1465 | $1,395 | $0.95 | 13d | 1 | 0.92mi |
| 1530 Saint Charles Ave Unit B Montgomery, AL | 1.0 | 1.0 | 725 | $775 | $1.07 | 43d | 1 | 0.93mi |
| 39 S Lewis St Montgomery, AL | 2.0 | 1.0 | 1209 | $950 | $0.79 | 43d | 1 | 0.94mi |
| 3334 Cottonwood Dr Montgomery, AL | 3.0 | 2.0 | 1025 | $1,295 | $1.26 | 13d | 1 | 0.95mi |
| 1517 Madison Ave Montgomery, AL | 1.0 | 1.0 | 1044 | $650 | $0.62 | 21d | 1 | 0.96mi |
| 1517 Madison Ave Montgomery, AL | 1.0 | 1.0 | 1044 | $650 | $0.62 | 43d | 1 | 0.96mi |
| 2019 Amos St Montgomery, AL | 3.0 | 1.5 | 1134 | $985 | $0.87 | 43d | 1 | 1.00mi |
| 532 Coliseum Blvd Unit 532C Montgomery, AL | 1.0 | 1.0 | 811 | $850 | $1.05 | 43d | 1 | 1.01mi |
| 3233 Hillcrest Ln Montgomery, AL | 3.0 | 2.0 | 1278 | $1,395 | $1.09 | 21d | 1 | 1.04mi |
| 329 S Capitol Pkwy Apt A Montgomery, AL | 1.0 | 1.0 | 800 | $645 | $0.81 | 43d | 1 | 1.04mi |
| 1415 Madison Ave Apt E Montgomery, AL | 2.0 | 1.0 | 825 | $1,095 | $1.33 | 13d | 1 | 1.04mi |
Listing history 17 events
-
2026-06-18days on market $79,900 Active 34 DOM
-
2026-06-17days on market $79,900 Active 33 DOM
-
2026-06-16days on market $79,900 Active 32 DOM
-
2026-06-15days on market $79,900 Active 31 DOM
-
2026-06-14days on market $79,900 Active 29 DOM
-
2026-06-13days on market $79,900 Active 28 DOM
-
2026-06-10days on market $79,900 Active 26 DOM
-
2026-06-09days on market $79,900 Active 25 DOM
-
2026-06-08days on market $79,900 Active 24 DOM
-
2026-06-07days on market $79,900 Active 23 DOM
-
2026-06-03days on market $79,900 Active 19 DOM
-
2026-06-02days on market $79,900 Active 18 DOM
-
2026-06-01days on market $79,900 Active 17 DOM
-
2026-05-31days on market $79,900 Active 16 DOM
-
2026-05-30days on market $79,900 Active 15 DOM
-
2026-05-15$79,900 Active 627-char remark
-
2022-01-18soldstatus $634,902
ⓘ Source: listings_history table (triggers on properties + properties_extension) + one-shot
backfill from property_details.listing_events for pre-trigger history.
Tax reassessment forecast AL · Resets to sale price
- Current annual tax
- $640 · $53/mo
- Projected year-2 tax
- $640 · $53/mo
- Expected delta
- $0/yr ($0/mo · 0.0%)
ⓘ Screening estimate from a state-policy table — verify with the county assessor before closing.
Climate risk First Street
- Flood 1/10 Low FEMA zone X (unshaded) · 0% chance over 30 yrs
- Wildfire 1/10 Low
- Heat 7/10 Severe 7 d/yr ≥107°F today · 19 d/yr by 30 yrs out
- Wind 8/10 Severe 80% chance of damaging wind over 30 yrs
- Air quality 3/10 Moderate 4 unhealthy d/yr today · 4 by 30 yrs out
Nearby sold comps map
Loading sold comps map…
Walkable amenities ~0.75 mi
Loading nearby amenities…
Taxation est. · year 1
- Rental income
- $12,228
- − Mortgage interest
- −$4,476
- − Property taxes
- −$640
- − Insurance
- −$400
- − Repairs & maintenance
- −$978
- − Management
- −$978
- − Depreciation
- −$2,324
- Taxable income
- $2,432
- Est. tax owed @ 24.0%
- −$584
- After-tax cash flow
- $3,009/yr
For passive investors: Depreciation is non-cash, so a rental often shows a tax loss while cash-flowing — sheltering income. Rental losses are passive: they offset passive income freely, and up to $25,000/yr can offset ordinary (W-2) income if you actively participate and your MAGI is under $100k (phasing out to $0 by $150k); unused losses carry forward. On sale, claimed depreciation is recaptured at up to 25%, and gains may owe capital-gains tax (a 1031 exchange can defer both). Figures are a year-1 estimate at your 24.0% rate — not tax advice; consult a CPA.
Schools (NCES district)
- District
- Montgomery County
- NCES district ID
- 0102430
- Math proficiency
- 9% ▼ -21.00%
- Reading proficiency
- 31% ▼ -1.00%
- Median HH income
- $43,902
- Composite
- 17.24/100
- National rank
- #9093
- State rank
- #106 of 129 in AL
Livability — Montgomery
- Score
- 65/100
- State rank
- #138
- US rank
- #13416
Category grades
Schools grade is shown separately in the Schools card above.
Census & demographics
- Census place
- Montgomery, AL
- County
- Montgomery County · 190,016 people
- City population
- 175,913
- Metro
- Montgomery, AL
- Population (ZIP)
- 8,001
- Household income
- $32,492
- Rent vs Own
- Severe rent burden
- 642.0
Population outlook (Montgomery County) Hauer SSP2
- Today (2025)
- 224,008 people
- By 2030
- 221,460 · -1.1%
- By 2040
- 214,179 · -4.4%
- By 2050
- 204,912 · -8.5%
- By 2075
- 177,821 · -20.6%
- By 2100
- 145,134 · -35.2%
Race, ethnicity, and origin ACS 2023
- Neighborhood character
- Diverse neighborhood (Simpson 0.69)
- Race & ethnicity
- Black 43% White 27% Hispanic / Latino 23% Two or more races 20%
- Hispanic origin (detail)
- Mexican 8% Cuban 3%
- Common ancestry
- Slovak 1% Iranian 1% Serbian 1%
- Foreign-born
- 11% · Canada
- Languages at home
- 83% English-only · Spanish 13%
Political lean MEDSL · Montgomery
- 2024 margin
- Solid D (+30.7) · D 64.8% · R 34.1% · Other 1.1%
- 2008→2024 swing
- +11.5pp toward D · 2008: 19.2pp · 2024: 30.7pp
- All cycles
- 2024: D+30.7 2020: D+31.5 2016: D+26.2 2012: D+24.3 2008: D+19.2
Not yet ingested
- Civics
- —
Market trends
- HPI YoY
- ▼ -18.16%
- Current HPI
- 147.8065
- Rent YoY
- ▲ 5.05%
- Metro
- Montgomery, AL
- State GDP YoY
- ▲ 2.94%
- F500 in state
- 4
Industry mix (Fortune 500 HQ in AL)
| Industry | F500 HQs | Revenue |
|---|---|---|
| Financial Services | 1 | $8B |
|
||
| Healthcare | 1 | $5B |
|
||
Price history
-87.4% since first listed2 events — show timeline
- 2026-05-15 Listed $79,900 MAAR
- 2022-01-18 Sold (Public Records) $634,902 Public Records
Property tax history
+4.5%/yrLatest (2025): $640 · -9.5% YoY. Source: county tax records.
Cash-flow waterfall
monthlySold comps — $/sqft
last 12 mo · ≤1 miLoading sold comps…