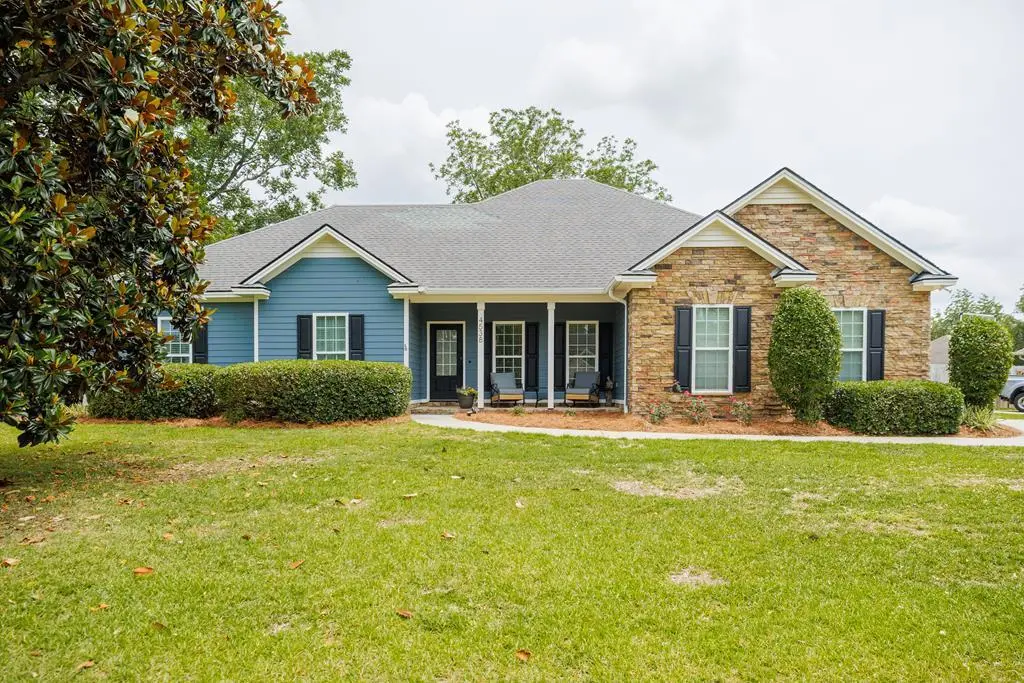
4538 San Saba Dr · Valdosta, GA
Flood risk 1/10 · Minimal
- FEMA flood zone
- X (unshaded)
- Chance of flooding over 30 yrs
- 0.0%
- Est. flood insurance / yr
- $507 – $1,088
Fire risk 7/10 · Major
- Est. fire insurance / yr
- $963 – $1,789
Heat risk 8/10 · Major
- Hot days now (above 108°F)
- 7 days/yr
- Hot days in 30 yrs
- 20 days/yr
Wind risk 8/10 · Major
- Chance of severe wind over 30 yrs
- 99.0%
Air-quality risk 6/10 · Moderate
- Unhealthy air days now
- 10 days/yr
- Unhealthy air days in 30 yrs
- 11 days/yr
Risk factors via First Street. Map © Google.
Why this score? — see what drove the D grade
The composite is a weighted blend of 9 inputs, each scored 0–100. Each bar is that input's sub-score; the figure is the points it added to the 100-point composite (weight × sub-score).
- Appreciation +10.0/10.0
- ARV discount +9.8/15.0
- Cash flow +7.1/30.0
- Schools +4.7/10.0
- Livability +3.0/5.0
- Rent growth +2.5/5.0
- Condition / age +2.5/5.0
- 1% rule +1.4/10.0
- DSCR +1.3/10.0
$410,000
🖨 Deal sheet 📄 Offer letter ✓ Due diligence
Listing remarks MLS
Beautiful home in highly sought after Grove Pointe subdivision. Zoned for county schools! On quiet street and one of the largest lots in the neighborhood, this home has four bedrooms and two and a half bathrooms. Open, split floor plan with massive 30 x 20 family room. LVP floors, granite throughout, new HVAC in 2019 and grand primary bedroom. Home is being sold with a GOLF CART so you are ready to cruise to the pools and playground! Come see this move in ready home in a great family neighborhood!
Key facts
- Open floor plan
- Lvp floors
- Largest lots
Tags
Property features AI
Finance
- HOA & community: Homeowners association with annual fee of $285 (about $23.75/month)
Exterior
- Parking: 2-car garage; Garage door opener
- Utilities: Public water; Public sewer
- Home design: Single-family residence; One story
- Construction: Cement siding; Shingle roof
- Exterior features: Covered patio/porch; Fenced yard
Interior
- Kitchen: Dishwasher; Microwave; Refrigerator; Disposal
- Flooring: Tile; Vinyl
- Bathrooms: 2 full bathrooms; 1 half bathroom
- Heating & cooling: Heat pump heating
- Interior features: Dishwasher; Microwave; Refrigerator; Disposal
- Laundry & utility: Dedicated laundry room
Neighborhood map
What this means for you Summary
Snapshot
- This is a 4-bed/2.5-bath single-family listed at $410k.
Deal economics
- At list price, monthly cash flow is $-580 ($-7k/yr) — negative.
- To cash-flow at today's rent, offer at most $307k (25.0% below list).
- To meet the 1% rule (rent ≥ 1% of price), the offer needs to be $263k (35.7% below list).
- Recommended offer: $263k (35.7% below list) — sets the bar for 1% rule.
Location & tenants
- Location reads 60/100 on livability (#392 in GA) — a middle-class / working-renter tenant base. Strengths: cost of living A+, health & safety A+, housing A-; Watch: schools F, crime F, amenities F.
- Lowndes County (rural): math 59% / reading 52% proficiency, ranked #8 of 174 in GA (top 5%) — acceptable for families but not a draw, mixed tenant base, ~2y average lease.
- Market conditions: 189 active listings in the ZIP; 2 comparable units currently listed for rent nearby; solid renter incomes; 896 units permitted in Lowndes County in 2024 (0 in 5+ unit buildings).
- This rent runs 38% of the median local income ($84k/yr) — at the standard rent-burdened threshold; future hikes will face affordability resistance.
Forward outlook
- In year one you build about $44k of equity ($3k loan paydown + $41k appreciation (10.0% local appreciation)).
- Lowndes County population projected at +10% by 2050 — modest demand growth; plan on rents tracking national, not racing it.
- By year 2, paydown + projected appreciation supports a ~$70k cash-out refi (75% LTV) — recoverable capital for the next deal without selling this one.
Negotiation context
- Only 7 days on market — expect competitive offers; lowballing is unlikely to land.
- 3 sale attempts since 8y ago with the ask held roughly flat each time — persistent listings suggest the price (not the market) is what's stuck; bring a comps-based counter.
Risks & watch-outs
- Climate carrying-cost: severe wind risk, 99% chance of damaging wind over 30y; major wildfire risk; extreme-heat days projected 7→20/yr by 2055 (HVAC capex compounding) — expect insurance premiums to compound above CPI over the hold.
Questions for the listing agent
- What do current leases actually rent for vs. the listed asking? Can we see a recent rent roll and the last 12 months of T-12 income?
- What does the HOA fee cover, when was the last increase, and are there any pending special assessments or reserve-fund shortfalls?
- Is there a deadline driving the sale (1031 exchange, divorce, estate, relocation)? That informs how much negotiation room exists.
- Schools are F-rated, which usually means shorter tenancies and higher turnover. Who's the typical renter profile here, and what's been the actual vacancy rate?
- Crime grade is F in this area — have there been break-ins, vandalism, or insurance claims at this property in the last 3 years? What carrier currently insures it and at what premium?
- The area grade is low — what's the realistic commute time and amenity access for the typical tenant pool here? Any planned neighborhood developments (good or bad) we should know about?
- What's the average days-on-market for RENTAL listings here right now (not sales)? A rising rental-DOM trend means longer vacancies and softer asking-rent achievability than the comps imply.
- What's the recent tenant-quality profile in this submarket — average credit score on applications, eviction rate, late-payment / NSF rate, and stable-employment percentage? A property-management company in the area should have these aggregated.
- How much new for-sale + rental construction is in the pipeline within 1–3 miles? Heavy new supply typically softens prices + rents 12–24 months out; constrained supply supports both.
Investment metrics
- 1% rule
- 0.64% ✗
- Cap rate
- 4.59%
- Cash-on-cash
- -6.07%
- DSCR
- 0.73
- GRM
- 13.0
CMA / ARV
- ARV (on-the-fly)
- $431,640
- Comps found
- 12
Show comp detail 12 sales within ~0.75 mi
| Address | Dist | Beds/Ba | Sqft | Sold | Price | $/sf | Match |
|---|---|---|---|---|---|---|---|
| 4501 Chickasaw Cir | 0.25mi | 4/3.0 | 2,267 (-6%) | 1mo | $370,000 | $163 | 76 |
| 4720 San Saba Dr | 0.37mi | 4/3.0 | 2,324 (-3%) | 2mo | $398,900 | $172 | 74 |
| 4732 Amelia Cir | 0.62mi | 4/3.0 | 2,356 (-2%) | 3mo | $390,000 | $166 | 64 |
| 5028 Hatfield Cir | 0.61mi | 4/3.0 | 2,523 (+5%) | 0mo | $526,845 | $209 | 61 |
| 4961 Hatfield Cir | 0.70mi | 4/3.0 | 2,350 (-2%) | 2mo | $434,900 | $185 | 60 |
| 4868 Brown Cat Cir | 0.73mi | 4/2.5 | 2,300 (-4%) | 1mo | $414,900 | $180 | 58 |
| 5051 Hatfield Cir | 0.70mi | 4/3.0 | 2,300 (-4%) | 3mo | $403,650 | $176 | 56 |
| 5116 Hatfield Cir | 0.75mi | 4/3.0 | 2,300 (-4%) | 3mo | $419,900 | $183 | 53 |
| 4683 Amelia Cir | 0.69mi | 4/3.0 | 2,187 (-9%) | 2mo | $377,500 | $173 | 50 |
| 3045 Houser Way | 0.64mi | 4/2.5 | 2,125 (-11%) | 2mo | $412,400 | $194 | 49 |
| 4596 Amelia Cir | 0.56mi | 4/3.0 | 2,072 (-14%) | 1mo | $331,500 | $160 | 48 |
| 3001 Houser Way | 0.53mi | 4/2.0 | 2,050 (-14%) | 3mo | $389,500 | $190 | 47 |
Match score weights: distance 35% · size 25% · config 20% · recency 20%. Top-matched comps best support the ARV.
Projected returns pro-forma
10.0% appreciation · 3.0% rent growth · sell at horizon
- IRR
- 20.0%
- Equity multiple
- 2.62×
- Total profit
- $186,272
- Equity at exit
- $369,360
- IRR
- 18.3%
- Equity multiple
- 6.03×
- Total profit
- $577,475
- Equity at exit
- $796,540
Cash invested: $114,800 (down + closing). Projections, not guarantees.
Landlord ↔ Tenant lean methodology
- Overall (STATE)
- 90 Strongly Landlord-Friendly
- State Georgia
- 90 Strongly Landlord-Friendly · R+3
- County
- — inherits STATE
- City
- — inherits STATE
ZIP-level market 31632
- Home prices YoY
- 8.1%
- Active inventory
- 189
- Price-to-rent
- 13.0×
Monthly cashflow live
- Estimated rent
- $2,635 medium interval (Pro) →
- Mortgage (P&I)
- −$2,150
- Tax from tax record
- −$317 /mo · $3,801/yr
- Insurance
- −$171
- HOA
- −$24
- Vacancy / Maint / Mgmt
- −$553
- Net cashflow
- $-580
Break-even live
UW: 25.0% down · 7.5% · 30yr · 1.5% tax · 5.0% vac · 8.0% maint · 8.0% mgmt
Financing live
Cash to close
- Down payment
- $102,500
- Closing costs
- $12,300
- Reserves months
- —
- Total cash needed
- —
Loan-product check · same deal, 3 products live
Conventional
25% down · 7.5% · 30yr
- Down + closing
- —
- Monthly P&I
- —
- Monthly cashflow
- —
- DSCR
- —
- Eligible?
- —
Personal DTI + credit; lowest rate.
DSCR
20% down · 8.5% · 30yr
- Down + closing
- —
- Monthly P&I
- —
- Monthly cashflow
- —
- DSCR
- —
- Eligible?
- —
No personal income docs; deal must DSCR.
Hard money
10% down · 12.0% · 12mo
- Down + closing
- —
- Monthly P&I
- —
- Monthly cashflow
- —
- DSCR
- —
- Eligible?
- —
Short-term bridge; refi at stabilization.
Rent comps 2 comps
| Address | Beds | Baths | Sqft | Rent | $/sqft | DOM | Units | Dist |
|---|---|---|---|---|---|---|---|---|
| 5048 Planters Xing Hahira, GA | 4.0 | 3.0 | 2160 | $2,500 | $1.16 | 21d | 1 | 0.50mi |
| 4194 Silver Gln Hahira, GA | 3.0 | 2.0 | 1650 | $1,795 | $1.09 | 21d | 1 | 1.25mi |
HOA detail
- Monthly dues
- $24 · $288/yr
- Likely covers
- pool
Listing history 6 events
-
2026-06-13statusdays on market $410,000 Pending 7 DOM
-
2026-06-10days on market $410,000 Active 6 DOM
-
2026-06-09days on market $410,000 Active 5 DOM
-
2026-06-08days on market $410,000 Active 4 DOM
-
2026-06-07remarks 699-char remark
-
2026-06-07$410,000 Active 3 DOM
ⓘ Source: listings_history table (triggers on properties + properties_extension) + one-shot
backfill from property_details.listing_events for pre-trigger history.
Tax reassessment forecast GA · Resets to sale price
- Current annual tax
- $3,801 · $317/mo
- Projected year-2 tax
- $3,801 · $317/mo
- Expected delta
- $0/yr ($0/mo · 0.0%)
ⓘ Screening estimate from a state-policy table — verify with the county assessor before closing.
Climate risk First Street
- Flood 1/10 Low FEMA zone X (unshaded) · 0% chance over 30 yrs
- Wildfire 7/10 Severe
- Heat 8/10 Severe 7 d/yr ≥108°F today · 20 d/yr by 30 yrs out
- Wind 8/10 Severe 99% chance of damaging wind over 30 yrs
- Air quality 6/10 Major 10 unhealthy d/yr today · 11 by 30 yrs out
Nearby sold comps map
Loading sold comps map…
Walkable amenities ~0.75 mi
Loading nearby amenities…
Taxation est. · year 1
- Rental income
- $31,616
- − Mortgage interest
- −$22,966
- − Property taxes
- −$3,801
- − Insurance
- −$2,050
- − Repairs & maintenance
- −$2,529
- − Management
- −$2,529
- − HOA
- −$288
- − Depreciation
- −$11,927
- Taxable loss
- −$14,475
- Est. tax savings @ 24.0%
- +$3,474
- After-tax cash flow
- $-3,489/yr
For passive investors: Depreciation is non-cash, so a rental often shows a tax loss while cash-flowing — sheltering income. Rental losses are passive: they offset passive income freely, and up to $25,000/yr can offset ordinary (W-2) income if you actively participate and your MAGI is under $100k (phasing out to $0 by $150k); unused losses carry forward. On sale, claimed depreciation is recaptured at up to 25%, and gains may owe capital-gains tax (a 1031 exchange can defer both). Figures are a year-1 estimate at your 24.0% rate — not tax advice; consult a CPA.
Schools (NCES district)
- District
- Lowndes County
- NCES district ID
- 1303390
- Math proficiency
- 59% ▼ -1.00%
- Reading proficiency
- 52% ▼ -2.00%
- Median HH income
- $48,221
- Composite
- 47.21/100
- National rank
- #2317
- State rank
- #8 of 174 in GA
Livability — Valdosta
- Score
- 60/100
- State rank
- #392
- US rank
- #19544
Category grades
Schools grade is shown separately in the Schools card above.
Census & demographics
- County
- Lowndes County · 107,801 people
- City population
- 91,859
- Metro
- Valdosta, GA
- Population (ZIP)
- 15,942
- Household income
- $83,946
- Rent vs Own
- Severe rent burden
- 73.0
Population outlook (Lowndes County) Hauer SSP2
- Today (2025)
- 120,348 people
- By 2030
- 123,469 · +2.6%
- By 2040
- 128,482 · +6.8%
- By 2050
- 131,907 · +9.6%
- By 2075
- 139,080 · +15.6%
- By 2100
- 133,649 · +11.1%
Race, ethnicity, and origin ACS 2023
- Neighborhood character
- Predominantly White (79%)
- Race & ethnicity
- White 79% Black 12% Hispanic / Latino 6% Two or more races 5%
- Hispanic origin (detail)
- Mexican 2% Puerto Rican 2%
- Common ancestry
- Slovak 3% Serbian 2% Italian 1%
- Foreign-born
- 2% · Canada, Jamaica
- Languages at home
- 96% English-only · Spanish 3%
Political lean MEDSL · Lowndes
- 2024 margin
- R (+18.0) · D 40.8% · R 58.8%
- 2008→2024 swing
- -8.6pp toward R · 2008: -9.4pp · 2024: -18.0pp
- All cycles
- 2024: R+18.0 2020: R+12.0 2016: R+18.2 2012: R+10.5 2008: R+9.4
Not yet ingested
- Civics
- —
Market trends
- HPI YoY
- ▲ 19.44%
- Current HPI
- 259.01
- Rent YoY
- —
- Metro
- Valdosta, GA
- State GDP YoY
- ▲ 2.66%
- F500 in state
- 28
Industry mix (Fortune 500 HQ in GA)
| Industry | F500 HQs | Revenue |
|---|---|---|
| Paper / Packaging | 2 | $29B |
|
||
| Retail | 1 | $160B |
|
||
| Transportation / Logistics | 1 | $91B |
|
||
| Airlines | 1 | $62B |
|
||
| Consumer Goods | 1 | $47B |
|
||
| Utilities | 1 | $25B |
|
||
Price history
-94.2% since first listed11 events — show timeline
- 2026-06-04 Listed $410,000 SGMLS
- 2023-07-28 Sold (Public Records) $370,000 Public Records
- 2023-07-24 Sold (MLS) $370,000 SGMLS
- 2023-07-01 Contingent — SGMLS
- 2023-06-29 Listed $372,000 SGMLS
- 2023-05-08 Price Changed $379,000 SGMLS
- 2019-03-27 Sold (Public Records) $202,900 Public Records
- 2019-03-26 Sold (MLS) $202,900 SGMLS
- 2018-10-29 Listed $204,900 SGMLS
- 2007-02-14 Sold (Public Records) $110,000 Public Records
- 2006-02-28 Sold (Public Records) $7,094,325 Public Records
Property tax history
+4.3%/yrLatest (2025): $3,801 · +11.1% YoY. Source: county tax records.
Cash-flow waterfall
monthlySold comps — $/sqft
last 12 mo · ≤1 miLoading sold comps…