4413 Bridgewood Rd · Brandermill, VA
Flood risk 1/10 · Minimal
- FEMA flood zone
- X (unshaded)
- Chance of flooding over 30 yrs
- 0.0%
- Est. flood insurance / yr
- $507 – $1,088
Fire risk 1/10 · Minimal
- Est. fire insurance / yr
- $666 – $1,236
Heat risk 7/10 · Major
- Hot days now (above 105°F)
- 7 days/yr
- Hot days in 30 yrs
- 16 days/yr
Wind risk 6/10 · Moderate
- Chance of severe wind over 30 yrs
- 27.0%
Air-quality risk 2/10 · Minimal
- Unhealthy air days now
- 0 days/yr
- Unhealthy air days in 30 yrs
- 1 days/yr
Risk factors via First Street. Map © Google.
Why this score? — see what drove the D+ grade
The composite is a weighted blend of 9 inputs, each scored 0–100. Each bar is that input's sub-score; the figure is the points it added to the 100-point composite (weight × sub-score).
- ARV discount +12.4/15.0
- Cash flow +12.1/30.0
- Schools +5.2/10.0
- Livability +3.9/5.0
- DSCR +3.6/10.0
- Rent growth +3.1/5.0
- 1% rule +2.7/10.0
- Condition / age +2.5/5.0
- Appreciation +0.0/10.0
$287,500
🖨 Deal sheet (PDF) 📄 Offer letter ✓ Due diligence
Listing remarks
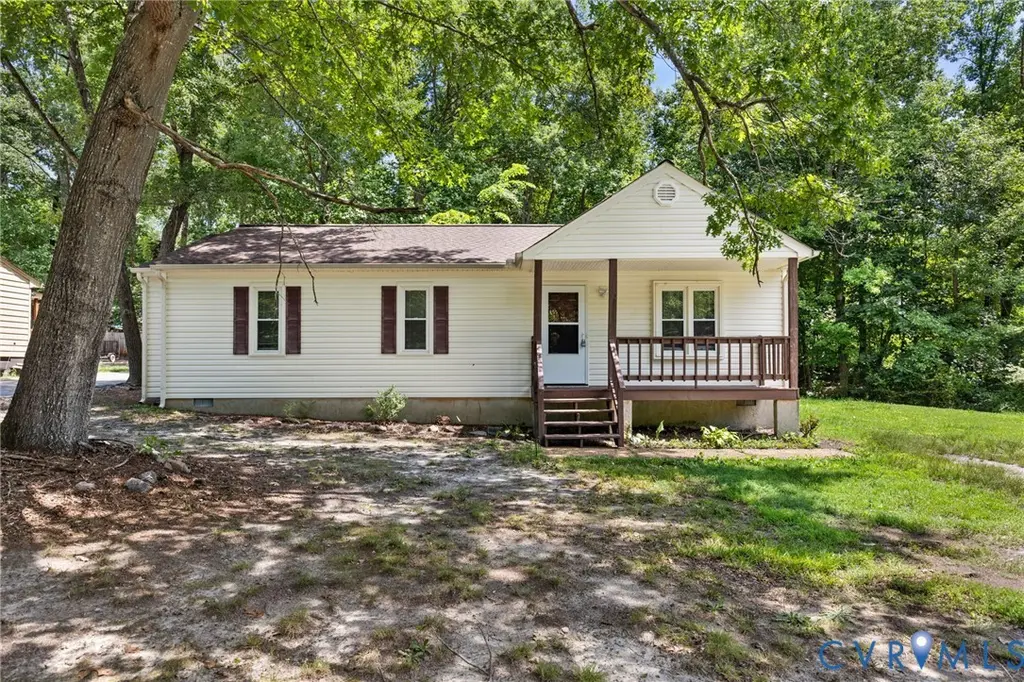
Super clean 3 BR and 2 BA rancher in convenient Midlothian neighborhood close to schools, restaurants, and shopping. Brand new laminate flooring has just been installed throughout. Everything has been freshly painted. The large eat-in kitchen will accommodate all your guests as will the spacious living room. The laundry room houses the new water heater and provides access to the rear deck. A covered front porch is ideal for rockers and relaxation. No HOA fee! It is definitely move-in ready. Check this one out quickly . .. it won't last long!
Key facts
- Covered front porch
- Large eat-in kitchen
- Laundry room
Tags
Property features AI
Exterior
- Utilities: Public water; Public sewer; Electric water heater
- Home design: Single-story home
- Construction: Brick, frame, and vinyl siding construction; Composition roof; Built (actual year not displayed)
- Exterior features: Front porch; Deck
Interior
- Kitchen: Eat-in kitchen; Electric range / stove; Range hood; Exhaust fan
- Bedrooms: Primary bedroom on the first level; Bedroom with new laminate flooring (first level) — approx. 10.10 x 10.0; Bedroom with new laminate flooring (first level) — approx. 10.4 x 8.0; Bedroom (first level) with new laminate, ceiling fan, and two closets — approx. 12.6 x 12.6
- Flooring: New laminate flooring in multiple rooms; Ceramic tile
- Bathrooms: Two full bathrooms; Full bath with tub and shower
- Heating & cooling: Electric baseboard heating; Window air conditioning units
- Interior features: Ceiling fans; Eat-in kitchen; Main-level primary bedroom; Bedroom on main level; Crawl space basement
- Laundry & utility: Laundry room on the first level with door to deck
Neighborhood map
What this means for you Summary
Snapshot
- This is a 3-bed/2.0-bath single-family listed at $288k.
Deal economics
- At list price, monthly cash flow is $-62 ($-742/yr) — negative.
- To cash-flow at today's rent, offer at most $277k (3.8% below list).
- To meet the 1% rule (rent ≥ 1% of price), the offer needs to be $220k (23.3% below list).
- Recommended offer: $220k (23.3% below list) — sets the bar for 1% rule.
- Cap rate 6.0% vs local median 3.7% in Brandermill — top-decile yield for the area; either an underpriced asset or a hidden risk that comps aren't pricing in. Stress-test before assuming the spread holds.
Location & tenants
- Location reads 77/100 on livability (#94 in VA, #3,055 nationally) — a middle-class / working-renter tenant base. Strengths: employment A+, housing A+, crime A-; Watch: amenities F, commute F.
- Chesterfield County Public School District (suburban): math 52% / reading 64% proficiency, ranked #57 of 131 in VA (top 44%) — acceptable for families but not a draw, mixed tenant base, ~2y average lease.
- Zoned schools: Thelma Crenshaw Elementary (math 40% / reading 57%, grade D, #785 of 1,108 statewide, top 71%, 651 students, 83% FRL); Bailey Bridge Middle (math 52% / reading 52%, grade C+, #218 of 342 statewide, top 65%, 1,459 students, 33% FRL); Manchester High (math 61% / reading 67%, grade B-, #220 of 319 statewide, top 70%, 2,188 students, 37% FRL) — zoned schools average 51% FRL vs 26% district-wide (25 pts higher); higher-poverty schools than district average — tighter screening recommended.
- Market conditions: Rents rising (+2.3%/yr); 495 active listings in the ZIP; 8 comparable units currently listed for rent nearby; rentals leasing fast (median 5d on market — plan ~1-2 weeks tenant-placement turnaround); high-income renter base; 2,307 units permitted in Chesterfield County in 2024 (462 in 5+ unit buildings).
Forward outlook
- Local home prices are declining (-3.0%/yr); year-one equity from $2k of loan paydown is wiped out by about $9k of value loss. Plan a longer hold.
- Chesterfield County population projected at +20% by 2050 — long-run rental-demand tailwind backs the buy-and-hold thesis.
Negotiation context
- Only 4 days on market — expect competitive offers; lowballing is unlikely to land.
- Current owner paid $50k; list at $288k implies a 472% gain — meaningful room to come down on a strong offer.
Risks & watch-outs
- Climate carrying-cost: major wind risk, 27% chance of damaging wind over 30y; extreme-heat days projected 7→16/yr by 2055 (HVAC capex compounding) — expect insurance premiums to compound above CPI over the hold.
Questions for the listing agent
- What do current leases actually rent for vs. the listed asking? Can we see a recent rent roll and the last 12 months of T-12 income?
- Is there a deadline driving the sale (1031 exchange, divorce, estate, relocation)? That informs how much negotiation room exists.
- Schools are A-rated — typically a magnet for longer-tenancy family renters. What's the average tenant stay here, and is there a school-zone premium baked into asking?
- The area grade is low — what's the realistic commute time and amenity access for the typical tenant pool here? Any planned neighborhood developments (good or bad) we should know about?
- What's the average days-on-market for RENTAL listings here right now (not sales)? A rising rental-DOM trend means longer vacancies and softer asking-rent achievability than the comps imply.
- What's the recent tenant-quality profile in this submarket — average credit score on applications, eviction rate, late-payment / NSF rate, and stable-employment percentage? A property-management company in the area should have these aggregated.
- How much new for-sale + rental construction is in the pipeline within 1–3 miles? Heavy new supply typically softens prices + rents 12–24 months out; constrained supply supports both.
Investment metrics
- 1% rule
- 0.77% ✗
- Cap rate
- 6.03%
- Cash-on-cash
- -0.92%
- DSCR
- 0.96
- GRM
- 10.9
CMA / ARV
- ARV (on-the-fly)
- $322,784
- Comps found
- 12
Show comp detail 12 sales within ~0.75 mi
| Address | Dist | Beds/Ba | Sqft | Sold | Price | $/sf | Match |
|---|---|---|---|---|---|---|---|
| 12104 Southernbelle Ct | 0.08mi | 3/1.5 | 1,056 (+1%) | 3mo | $295,000 | $279 | 90 |
| 4524 Twelveoaks Rd | 0.16mi | 3/1.0 | 1,056 (+1%) | 1mo | $289,500 | $274 | 87 |
| 4518 Glen Tara Dr | 0.21mi | 3/1.0 | 1,056 (+1%) | 3mo | $305,000 | $289 | 82 |
| 11548 New Forest Trl | 0.53mi | 3/2.0 | 1,038 (-1%) | 1mo | $330,000 | $318 | 73 |
| 11531 Bailey Woods Dr | 0.44mi | 3/2.0 | 1,088 (+4%) | 3mo | $330,000 | $303 | 70 |
| 11803 New Forest Ct | 0.45mi | 3/2.0 | 1,088 (+4%) | 3mo | $335,000 | $308 | 70 |
| 12204 King Cotton Ct | 0.65mi | 3/2.0 | 1,056 (+1%) | 1mo | $328,000 | $311 | 68 |
| 11619 New Forest Trl | 0.47mi | 3/2.0 | 1,088 (+4%) | 5mo | $320,000 | $294 | 67 |
| 12206 Timber Trail Dr | 0.43mi | 3/1.0 | 960 (-8%) | 2mo | $299,000 | $311 | 60 |
| 11503 Deep Hollow Ct | 0.73mi | 3/2.0 | 1,118 (+7%) | 2mo | $340,000 | $304 | 53 |
| 4507 Parrish Branch Rd | 0.72mi | 3/2.0 | 1,118 (+7%) | 4mo | $350,000 | $313 | 52 |
| 5107 Spring Bluff Rd | 0.66mi | 3/2.0 | 1,200 (+14%) | 2mo | $378,000 | $315 | 43 |
Match score weights: distance 35% · size 25% · config 20% · recency 20%. Top-matched comps best support the ARV.
Projected returns pro-forma
-3.0% appreciation · 2.29% rent growth · sell at horizon
- IRR
- -18.6%
- Equity multiple
- 0.35×
- Total profit
- $-52,170
- Equity at exit
- $42,867
- IRR
- -12.4%
- Equity multiple
- 0.29×
- Total profit
- $-57,149
- Equity at exit
- $24,858
Cash invested: $80,500 (down + closing). Projections, not guarantees.
Landlord ↔ Tenant lean methodology
- Overall (STATE)
- 55 Moderately Landlord-Leaning
- State Virginia
- 55 Moderately Landlord-Leaning · D+2
- County
- — inherits STATE
- City
- — inherits STATE
ZIP-level market 23112
- Rents YoY
- 2.3%
- Active inventory
- 495
- Price-to-rent
- 10.9×
Monthly cashflow live
- Estimated rent
- $2,204 high interval (Pro) →
- Mortgage (P&I)
- −$1,508
- Tax from tax record
- −$176 /mo · $2,108/yr
- Insurance
- −$120
- HOA
- −$0
- Vacancy / Maint / Mgmt
- −$463
- Net cashflow
- $-62
Break-even live
Sensitivity live
| Price | -10% $101 | -5% $20 | +0% $-62 | +5% $-143 | +10% $-225 |
|---|---|---|---|---|---|
| Rent | -10% $-236 | -5% $-149 | +0% $-62 | +5% $25 | +10% $112 |
| Rate | -1.0pp $83 | -0.5pp $11 | base $-62 | +0.5pp $-136 | +1.0pp $-212 |
UW: 25.0% down · 7.5% · 30yr · 1.5% tax · 5.0% vac · 8.0% maint · 8.0% mgmt
Financing live
Cash to close
- Down payment
- $71,875
- Closing costs
- $8,625
- Reserves months
- —
- Total cash needed
- —
Loan-product check · same deal, 3 products live
Conventional
25% down · 7.5% · 30yr
- Down + closing
- —
- Monthly P&I
- —
- Monthly cashflow
- —
- DSCR
- —
- Eligible?
- —
Personal DTI + credit; lowest rate.
DSCR
20% down · 8.5% · 30yr
- Down + closing
- —
- Monthly P&I
- —
- Monthly cashflow
- —
- DSCR
- —
- Eligible?
- —
No personal income docs; deal must DSCR.
Hard money
10% down · 12.0% · 12mo
- Down + closing
- —
- Monthly P&I
- —
- Monthly cashflow
- —
- DSCR
- —
- Eligible?
- —
Short-term bridge; refi at stabilization.
Rent comps 8 comps
| Address | Beds | Baths | Sqft | Rent | $/sqft | DOM | Units | Dist |
|---|---|---|---|---|---|---|---|---|
| 4613 Bridgewood Rd Midlothian, VA | 3.0 | 1.0 | 1056 | $1,995 | $1.89 | 4d | 1 | 0.16mi |
| 3900 Maze Runner Dr Midlothian, VA | 2.0 | 2.0 | 1229 | $1,825 | $1.48 | 12d | 2 | 0.36mi |
| 4100 Lonas Pkwy Midlothian, VA | 1.0–3.0 | 1.0–2.0 | 969 | $2,319 | $2.39 | 4d | 20 | 0.36mi |
| 3900 Maze Runner Dr #201 Midlothian, VA | 2.0 | 2.0 | 1156 | $1,950 | $1.69 | 4d | 1 | 0.37mi |
| 4000 Maze Runner Dr Midlothian, VA | 2.0 | 2.0 | 1302 | $2,200 | $1.69 | 22d | 1 | 0.39mi |
| 5401 Commonwealth Centre Pkwy Midlothian, VA | 1.0–2.0 | 1.0–2.0 | 1008 | $2,137 | $2.12 | 3d | 15 | 0.70mi |
| 5200 Hunt Master Dr Midlothian, VA | 1.0–3.0 | 1.0–2.0 | 875 | $2,199 | $2.51 | 5d | 27 | 1.16mi |
| 9906 Family Ln Chesterfield, VA | 3.0 | 1.0 | 1274 | $1,888 | $1.48 | 45d | 1 | 1.43mi |
Listing history 4 events
-
2026-06-16statusdays on market $287,500 Pending 4 DOM
-
2026-06-15days on market $287,500 Active 3 DOM
-
2026-06-13remarks 547-char remark
-
2026-06-13$287,500 Active 1 DOM
ⓘ Source: listings_history table (triggers on properties + properties_extension) + one-shot
backfill from property_details.listing_events for pre-trigger history.
Tax reassessment forecast VA · Resets to sale price
- Current annual tax
- $2,108 · $176/mo
- Projected year-2 tax
- $2,358 · $196/mo
- Expected delta
- +$249/yr (+$21/mo · 11.8%)
ⓘ Screening estimate from a state-policy table — verify with the county assessor before closing.
Climate risk First Street
- Flood 1/10 Low FEMA zone X (unshaded) · 0% chance over 30 yrs
- Wildfire 1/10 Low
- Heat 7/10 Severe 7 d/yr ≥105°F today · 16 d/yr by 30 yrs out
- Wind 6/10 Major 27% chance of damaging wind over 30 yrs
- Air quality 2/10 Low 0 unhealthy d/yr today · 1 by 30 yrs out
Nearby sold comps map
Loading sold comps map…
Walkable amenities ~0.75 mi
Loading nearby amenities…
Taxation est. · year 1
- Rental income
- $26,451
- − Mortgage interest
- −$16,104
- − Property taxes
- −$2,108
- − Insurance
- −$1,438
- − Repairs & maintenance
- −$2,116
- − Management
- −$2,116
- − Depreciation
- −$8,364
- Taxable loss
- −$5,796
- Est. tax savings @ 24.0%
- +$1,391
- After-tax cash flow
- $649/yr
For passive investors: Depreciation is non-cash, so a rental often shows a tax loss while cash-flowing — sheltering income. Rental losses are passive: they offset passive income freely, and up to $25,000/yr can offset ordinary (W-2) income if you actively participate and your MAGI is under $100k (phasing out to $0 by $150k); unused losses carry forward. On sale, claimed depreciation is recaptured at up to 25%, and gains may owe capital-gains tax (a 1031 exchange can defer both). Figures are a year-1 estimate at your 24.0% rate — not tax advice; consult a CPA.
Schools (NCES district)
- District
- Chesterfield County Public School District
- NCES district ID
- 5100840
- Math proficiency
- 52% ▼ -30.00%
- Reading proficiency
- 64% ▼ -15.00%
- Median HH income
- $72,821
- Composite
- 51.56/100
- National rank
- #1712
- State rank
- #57 of 131 in VA
Livability — Brandermill
- Score
- 77/100
- State rank
- #94
- US rank
- #3055
Category grades
Schools grade is shown separately in the Schools card above.
Census & demographics
- County
- Chesterfield County · 406,988 people
- City population
- 56,364
- Metro
- Richmond, VA
- Population (ZIP)
- 57,016
- Household income
- $116,465
- Rent vs Own
- Severe rent burden
- 897.0
Population outlook (Chesterfield County) Hauer SSP2
- Today (2025)
- 377,190 people
- By 2030
- 395,710 · +4.9%
- By 2040
- 427,694 · +13.4%
- By 2050
- 452,706 · +20.0%
- By 2075
- 505,533 · +34.0%
- By 2100
- 521,282 · +38.2%
Race, ethnicity, and origin ACS 2023
- Neighborhood character
- Predominantly White (70%)
- Race & ethnicity
- White 70% Black 14% Two or more races 7% Hispanic / Latino 6% Asian 4%
- Hispanic origin (detail)
- Mexican 1% Puerto Rican 2%
- Common ancestry
- Lithuanian 4% Italian 4% Romanian 2%
- Foreign-born
- 7% · Canada, China, Jamaica
- Languages at home
- 91% English-only · Spanish 4% Other Indo-European 1% Arabic 1%
Political lean MEDSL · Chesterfield
- 2024 margin
- Lean D (+9.0) · D 53.8% · R 44.8% · Other 1.4%
- 2008→2024 swing
- +16.4pp toward D · 2008: -7.5pp · 2024: 9.0pp
- All cycles
- 2024: D+9.0 2020: D+6.7 2016: R+2.2 2012: R+7.1 2008: R+7.5
Not yet ingested
- Civics
- —
Market trends
- HPI YoY
- ▼ -224.87%
- Current HPI
- 277.4841
- Rent YoY
- ▲ 2.29%
- Metro
- Richmond, VA
- State GDP YoY
- ▲ 2.40%
- F500 in state
- 50
Industry mix (Fortune 500 HQ in VA)
| Industry | F500 HQs | Revenue |
|---|---|---|
| Aerospace / Defense | 4 | $236B |
|
||
| Technology / Defense | 3 | $32B |
|
||
| Financial Services | 2 | $176B |
|
||
| Utilities | 2 | $27B |
|
||
| Insurance | 2 | $25B |
|
||
| Technology | 2 | $15B |
|
||
Price history
+721.4% since first listed3 events — show timeline
- 2026-06-12 Listed $287,500 CVRMLS
- 1988-09-02 Sold (Public Records) $50,300 Public Records
- 1985-05-13 Sold (Public Records) $35,000 Public Records
Property tax history
+5.8%/yrLatest (2025): $2,108 · +1.5% YoY. Source: county tax records.
Cash-flow waterfall
monthlySold comps — $/sqft
last 12 mo · ≤1 miLoading sold comps…