23 Manhattan Park Dr · Sand Ridge, NY
Flood risk 1/10 · Minimal
- FEMA flood zone
- AE
- Chance of flooding over 30 yrs
- 0.0%
- Est. flood insurance / yr
- $1,737 – $8,500
Fire risk 3/10 · Minor
- Est. fire insurance / yr
- $691 – $1,283
Heat risk 2/10 · Minimal
- Hot days now (above 95°F)
- 7 days/yr
- Hot days in 30 yrs
- 16 days/yr
Wind risk 1/10 · Minimal
- Chance of severe wind over 30 yrs
- 1.0%
Air-quality risk 2/10 · Minimal
- Unhealthy air days now
- 1 days/yr
- Unhealthy air days in 30 yrs
- 1 days/yr
Risk factors via First Street. Map © Google.
Why this score? — see what drove the D+ grade
The composite is a weighted blend of 9 inputs, each scored 0–100. Each bar is that input's sub-score; the figure is the points it added to the 100-point composite (weight × sub-score).
- Cash flow +12.8/30.0
- Appreciation +10.0/10.0
- ARV discount +7.5/15.0
- DSCR +3.8/10.0
- 1% rule +3.6/10.0
- Schools +3.5/10.0
- Livability +3.1/5.0
- Rent growth +2.5/5.0
- Condition / age +2.5/5.0
$289,900
🖨 Deal sheet (PDF) 📄 Offer letter ✓ Due diligence
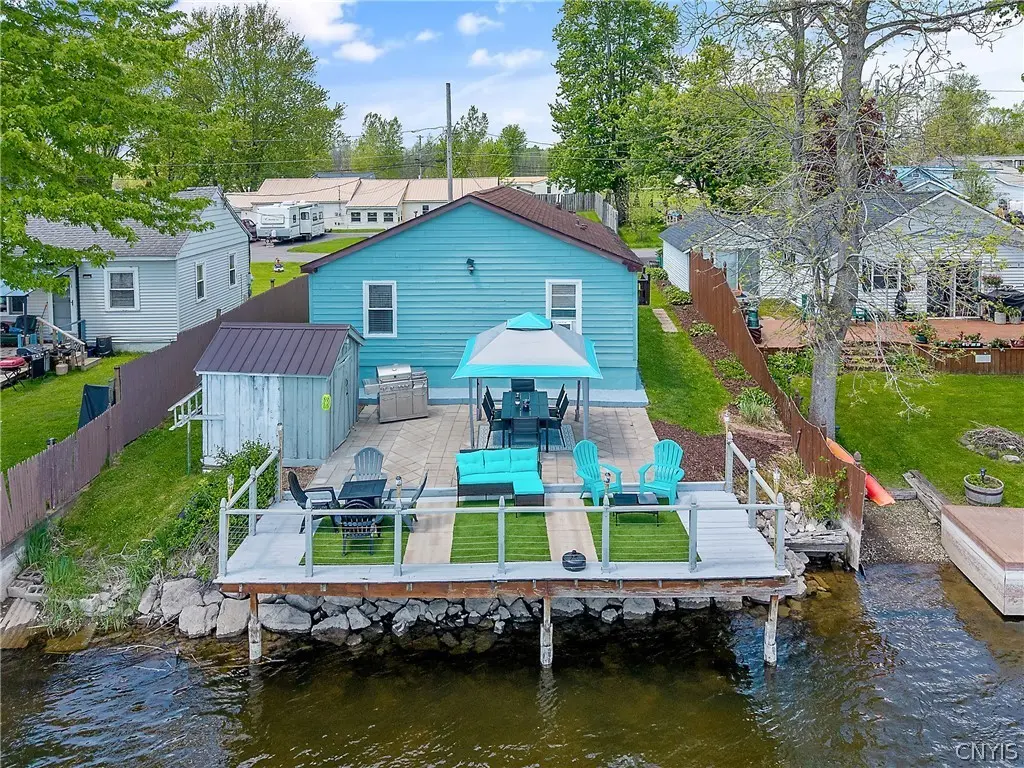
Listing remarks
Waterfront properties at this price point are a rare find, and this one delivers everything you've been dreaming of. Step outside onto your expansive patio and deck, perched right at the water's edge, where peaceful river views and the sounds of nature greet you every single day. Inside, the home features vinyl flooring throughout and features 3 bedrooms with 2 full bathrooms. The primary bedrooms features an en-suite bathroom with double vanity and subway tiled shower, plus a large walk-in closet! Two additional bedrooms are tucked at the east end of the home and offer stunning water views! The kitchen offers ample space for entertaining and flows seamlessly into the living room, where a s
Key facts
- Double vanity
- Vinyl flooring
- Peaceful river views
Tags
Property features AI
Exterior
- Parking: Driveway (no garage)
- Utilities: Public water (connected); Sewer connected
- Home design: Single-story (1 story); Double-wide mobile home; Residential setting on a rectangular lot; Faces city street
- Construction: Cedar and wood siding; Block foundation; Existing construction
- Exterior features: Blacktop driveway; Deck; Patio; Shed(s) / storage; River access and stream frontage; Has a view
Interior
- Kitchen: Electric oven and range; Dishwasher; Refrigerator
- Bedrooms: Three main-level bedrooms
- Flooring: Luxury vinyl
- Bathrooms: Two full bathrooms (both on the main level)
- Heating & cooling: Gas forced-air heating
- Interior features: Eat-in kitchen; Main-level primary suite; Primary suite
- Laundry & utility: Main-level laundry; Washer and dryer; Electric water heater
Neighborhood map
What this means for you Summary
Snapshot
- This is a 3-bed/2.5-bath manufactured listed at $290k.
Deal economics
- At list price, monthly cash flow is $-454 ($-5k/yr) — negative.
- To cash-flow at today's rent, offer at most $210k (27.6% below list).
- To meet the 1% rule (rent ≥ 1% of price), the offer needs to be $250k (13.8% below list).
- Recommended offer: $210k (27.6% below list) — sets the bar for cash-flow.
- Cap rate 6.2% vs local median 3.4% in Sand Ridge — top-decile yield for the area; either an underpriced asset or a hidden risk that comps aren't pricing in. Stress-test before assuming the spread holds.
Location & tenants
- Location reads 61/100 on livability (#926 in NY) — a middle-class / working-renter tenant base. Strengths: housing A+, cost of living A, crime A-; Watch: employment D+, amenities F, commute F.
- Central Square Central School District (suburban): math 40% / reading 40% proficiency, ranked #507 of 590 in NY (top 86%) — families likely to look elsewhere, expect single-tenant / working-renter base with shorter leases.
- Zoned schools: Millard Hawk Elementary School (math 22% / reading 32%, grade F, #1,786 of 2,108 statewide, top 86%, 477 students, 52% FRL); Central Square Middle School (math 19% / reading 35%, grade F, #587 of 729 statewide, top 81%, 833 students, 45% FRL); Paul V Moore High School (math 91% / reading 75%, grade A, #440 of 1,100 statewide, top 40%, 1,101 students, 44% FRL).
- Market conditions: 20 active listings in the ZIP; 1 comparable units currently listed for rent nearby; 172 units permitted in Oswego County in 2024 (27 in 5+ unit buildings).
Forward outlook
- In year one you build about $31k of equity ($2k loan paydown + $29k appreciation (10.0% local appreciation)).
- Oswego County population projected at -23% by 2050 — secular population decline; favor cash flow + early exit over multi-decade hold.
- By year 2, paydown + projected appreciation supports a ~$50k cash-out refi (75% LTV) — recoverable capital for the next deal without selling this one.
Negotiation context
- It's been on market 33 days — a 3% lower offer ($281k) is reasonable based on typical stale-listing flexibility.
- 8 sale attempts since 14y ago with the ask held roughly flat each time — persistent listings suggest the price (not the market) is what's stuck; bring a comps-based counter.
- Current owner paid $185k; list at $290k implies a 57% gain — meaningful room to come down on a strong offer.
Risks & watch-outs
- Watch-outs: flood insurance adds $427/mo.
- Climate carrying-cost: in FEMA flood zone AE (mandatory federal flood insurance) — expect insurance premiums to compound above CPI over the hold.
Questions for the listing agent
- What do current leases actually rent for vs. the listed asking? Can we see a recent rent roll and the last 12 months of T-12 income?
- It's been on market 33 days. Have you received any prior offers? Is the seller open to a 28% concession, seller financing, or rate buy-down credit?
- What's the actual annual flood-insurance premium (NFIP or private), and is the property in a SFHA with mandatory coverage?
- Is there a deadline driving the sale (1031 exchange, divorce, estate, relocation)? That informs how much negotiation room exists.
- Schools are F-rated, which usually means shorter tenancies and higher turnover. Who's the typical renter profile here, and what's been the actual vacancy rate?
- The area grade is low — what's the realistic commute time and amenity access for the typical tenant pool here? Any planned neighborhood developments (good or bad) we should know about?
- What's the average days-on-market for RENTAL listings here right now (not sales)? A rising rental-DOM trend means longer vacancies and softer asking-rent achievability than the comps imply.
- What's the recent tenant-quality profile in this submarket — average credit score on applications, eviction rate, late-payment / NSF rate, and stable-employment percentage? A property-management company in the area should have these aggregated.
- How much new for-sale + rental construction is in the pipeline within 1–3 miles? Heavy new supply typically softens prices + rents 12–24 months out; constrained supply supports both.
Investment metrics
- 1% rule
- 0.86% ✗
- Cap rate
- 6.18%
- Cash-on-cash
- -0.40%
- DSCR
- 0.98
- GRM
- 9.7
CMA / ARV
No comps found within radius.
Projected returns pro-forma
10.0% appreciation · 3.0% rent growth · sell at horizon
- IRR
- 19.6%
- Equity multiple
- 2.59×
- Total profit
- $129,299
- Equity at exit
- $261,165
- IRR
- 18.0%
- Equity multiple
- 5.98×
- Total profit
- $404,076
- Equity at exit
- $563,212
Cash invested: $81,172 (down + closing). Projections, not guarantees.
Landlord ↔ Tenant lean methodology
- Overall (STATE)
- 15 Strongly Tenant-Friendly
- State New York
- 15 Strongly Tenant-Friendly · D+10
- County
- — inherits STATE
- City
- — inherits STATE
ZIP-level market 13132
- Home prices YoY
- 7.9%
- Active inventory
- 20
- Price-to-rent
- 9.7×
Monthly cashflow live
- Estimated rent
- $2,500 medium interval (Pro) →
- Mortgage (P&I)
- −$1,520
- Tax from tax record
- −$361 /mo · $4,331/yr
- Insurance
- −$121
- Flood insurance flood zone
- −$427 /mo · $5,118/yr
- HOA
- −$0
- Vacancy / Maint / Mgmt
- −$525
- Net cashflow
- $-454
Break-even live
Sensitivity live
| Price | -10% $-289 | -5% $-371 | +0% $-454 | +5% $-536 | +10% $-618 |
|---|---|---|---|---|---|
| Rent | -10% $-651 | -5% $-552 | +0% $-454 | +5% $-355 | +10% $-256 |
| Rate | -1.0pp $-308 | -0.5pp $-380 | base $-454 | +0.5pp $-529 | +1.0pp $-605 |
UW: 25.0% down · 7.5% · 30yr · 1.5% tax · 5.0% vac · 8.0% maint · 8.0% mgmt
Financing live
Cash to close
- Down payment
- $72,475
- Closing costs
- $8,697
- Reserves months
- —
- Total cash needed
- —
Loan-product check · same deal, 3 products live
Conventional
25% down · 7.5% · 30yr
- Down + closing
- —
- Monthly P&I
- —
- Monthly cashflow
- —
- DSCR
- —
- Eligible?
- —
Personal DTI + credit; lowest rate.
DSCR
20% down · 8.5% · 30yr
- Down + closing
- —
- Monthly P&I
- —
- Monthly cashflow
- —
- DSCR
- —
- Eligible?
- —
No personal income docs; deal must DSCR.
Hard money
10% down · 12.0% · 12mo
- Down + closing
- —
- Monthly P&I
- —
- Monthly cashflow
- —
- DSCR
- —
- Eligible?
- —
Short-term bridge; refi at stabilization.
Rent comps 1 comps
| Address | Beds | Baths | Sqft | Rent | $/sqft | DOM | Units | Dist |
|---|---|---|---|---|---|---|---|---|
| 23 Manhattan Park Dr Pennellville, NY | 3.0 | 2.0 | 1080 | $2,500 | $2.31 | 45d | 1 | 0.02mi |
Listing history 40 events
-
2026-06-21days on market $289,900 Active 33 DOM
-
2026-06-21days on market $289,900 Active 32 DOM
-
2026-06-18days on market $289,900 Active 30 DOM
-
2026-06-17days on market $289,900 Active 29 DOM
-
2026-06-16days on market $289,900 Active 28 DOM
-
2026-06-15days on market $289,900 Active 27 DOM
-
2026-06-13days on market $289,900 Active 25 DOM
-
2026-06-12pricedays on market $289,900 Active 24 DOM
-
2026-06-09days on market $299,900 Active 21 DOM
-
2026-06-08days on market $299,900 Active 20 DOM
-
2026-06-07days on market $299,900 Active 19 DOM
-
2026-06-07days on market $299,900 Active 18 DOM
-
2026-06-04days on market $299,900 Active 15 DOM
-
2026-06-02days on market $299,900 Active 14 DOM
-
2026-06-01days on market $299,900 Active 13 DOM
-
2026-05-31days on market $299,900 Active 12 DOM
-
2026-05-19$299,900 Active
-
2026-04-02historical
-
2025-10-28price $315,000
-
2025-10-02$339,900 Active
-
2025-09-16price $2,500
-
2025-08-15historical
-
2025-08-11$3,000
-
2025-07-25price $349,900
-
2025-07-12price $369,900
-
2025-06-28$395,000 Active
-
2024-06-10soldstatus $185,000
-
2024-06-05soldstatus $185,000 Closed
-
2024-04-23status Pending
-
2024-04-18$179,900 Active
-
2019-09-19soldstatus $130,000
-
2019-09-18soldstatus $130,000 Closed Sale or Rented
-
2019-08-01status Under Contract- Do Not Show
-
2019-06-14historical Continue to Show- Under Contract
-
2019-05-29$134,900 Active
-
2013-10-23soldstatus $107,000
-
2013-04-02historical
-
2013-04-02$119,900
-
2012-09-26$124,900
-
2007-08-16soldstatus $89,900
ⓘ Source: listings_history table (triggers on properties + properties_extension) + one-shot
backfill from property_details.listing_events for pre-trigger history.
Tax reassessment forecast NY · Partial reset (capped growth)
- Current annual tax
- $4,331 · $361/mo
- Projected year-2 tax
- $4,615 · $385/mo
- Expected delta
- +$284/yr (+$24/mo · 6.6%)
ⓘ Screening estimate from a state-policy table — verify with the county assessor before closing.
Climate risk First Street
- Flood 1/10 Low FEMA zone AE · 0% chance over 30 yrs
- Wildfire 3/10 Moderate
- Heat 2/10 Low 7 d/yr ≥95°F today · 16 d/yr by 30 yrs out
- Wind 1/10 Low 100% chance of damaging wind over 30 yrs
- Air quality 2/10 Low 1 unhealthy d/yr today · 1 by 30 yrs out
Nearby sold comps map
Loading sold comps map…
Walkable amenities ~0.75 mi
Loading nearby amenities…
Taxation est. · year 1
- Rental income
- $30,000
- − Mortgage interest
- −$16,239
- − Property taxes
- −$4,331
- − Insurance
- −$6,568
- − Repairs & maintenance
- −$2,400
- − Management
- −$2,400
- − Depreciation
- −$8,433
- Taxable loss
- −$10,372
- Est. tax savings @ 24.0%
- +$2,489
- After-tax cash flow
- $-2,953/yr
For passive investors: Depreciation is non-cash, so a rental often shows a tax loss while cash-flowing — sheltering income. Rental losses are passive: they offset passive income freely, and up to $25,000/yr can offset ordinary (W-2) income if you actively participate and your MAGI is under $100k (phasing out to $0 by $150k); unused losses carry forward. On sale, claimed depreciation is recaptured at up to 25%, and gains may owe capital-gains tax (a 1031 exchange can defer both). Figures are a year-1 estimate at your 24.0% rate — not tax advice; consult a CPA.
Schools (NCES district)
- District
- Central Square Central School District
- NCES district ID
- 3606900
- Math proficiency
- 40% ▼ -18.00%
- Reading proficiency
- 40% ▼ -12.00%
- Median HH income
- $55,807
- Composite
- 35.05/100
- National rank
- #5035
- State rank
- #507 of 590 in NY
Livability — Sand Ridge
- Score
- 61/100
- State rank
- #926
- US rank
- #18073
Category grades
Schools grade is shown separately in the Schools card above.
Census & demographics
- Population (ZIP)
- 3,561
Population outlook (Oswego County) Hauer SSP2
- Today (2025)
- 114,465 people
- By 2030
- 109,968 · -3.9%
- By 2040
- 99,205 · -13.3%
- By 2050
- 87,979 · -23.1%
- By 2075
- 65,100 · -43.1%
- By 2100
- 47,117 · -58.8%
Race, ethnicity, and origin ACS 2023
- Neighborhood character
- Predominantly White (93%)
- Race & ethnicity
- White 93% Two or more races 6% Hispanic / Latino 2%
- Common ancestry
- Romanian 11% Lithuanian 4% Slovak 2%
- Foreign-born
- 1%
- Languages at home
- 99% English-only · Other Indo-European 1% Spanish 0%
Political lean MEDSL · Oswego
- 2024 margin
- Strong R (+24.2) · D 37.9% · R 62.1%
- 2008→2024 swing
- -26.6pp toward R · 2008: 2.5pp · 2024: -24.2pp
- All cycles
- 2024: R+24.2 2020: R+20.2 2016: R+23.2 2012: D+7.9 2008: D+2.5
Not yet ingested
- Civics
- —
Market trends
- HPI YoY
- ▲ 21.77%
- Current HPI
- 297.8008
- Rent YoY
- —
- Metro
- —
- State GDP YoY
- ▲ 2.60%
- F500 in state
- 92
Industry mix (Fortune 500 HQ in NY)
| Industry | F500 HQs | Revenue |
|---|---|---|
| Financial Services | 10 | $950B |
|
||
| Consumer Goods | 9 | $162B |
|
||
| Insurance | 4 | $225B |
|
||
| Telecommunications | 2 | $144B |
|
||
| Pharmaceuticals | 2 | $112B |
|
||
| Media / Entertainment | 2 | $69B |
|
||
Price history
+233.6% since first listed24 events — show timeline
- 2026-05-19 Listed $299,900 CNYIS
- 2026-04-02 Listing Removed — CNYIS
- 2025-10-28 Price Changed $315,000 CNYIS
- 2025-10-02 Listed $339,900 CNYIS
- 2025-09-16 Price Changed $2,500 REDFIN
- 2025-08-15 Listing Removed — CNYIS
- 2025-08-11 Listed for Rent $3,000 REDFIN
- 2025-07-25 Price Changed $349,900 CNYIS
- 2025-07-12 Price Changed $369,900 CNYIS
- 2025-06-28 Listed $395,000 CNYIS
- 2024-06-10 Sold (Public Records) $185,000 Public Records
- 2024-06-05 Sold (MLS) $185,000 CNYIS
- 2024-04-23 Pending — CNYIS
- 2024-04-18 Listed $179,900 CNYIS
- 2019-09-19 Sold (Public Records) $130,000 Public Records
- 2019-09-18 Sold (MLS) $130,000 CNYIS
- 2019-08-01 Pending — CNYIS
- 2019-06-14 Contingent — CNYIS
- 2019-05-29 Listed $134,900 CNYIS
- 2013-10-23 Sold (MLS) $107,000 CNYIS
- 2013-04-02 Listed $119,900 CNYIS
- 2013-04-02 Listing Removed — CNYIS
- 2012-09-26 Listed $124,900 CNYIS
- 2007-08-16 Sold (Public Records) $89,900 Public Records
Property tax history
+5.2%/yrLatest (2025): $4,331 · -0.2% YoY. Source: county tax records.
Cash-flow waterfall
monthlySold comps — $/sqft
last 12 mo · ≤1 miLoading sold comps…