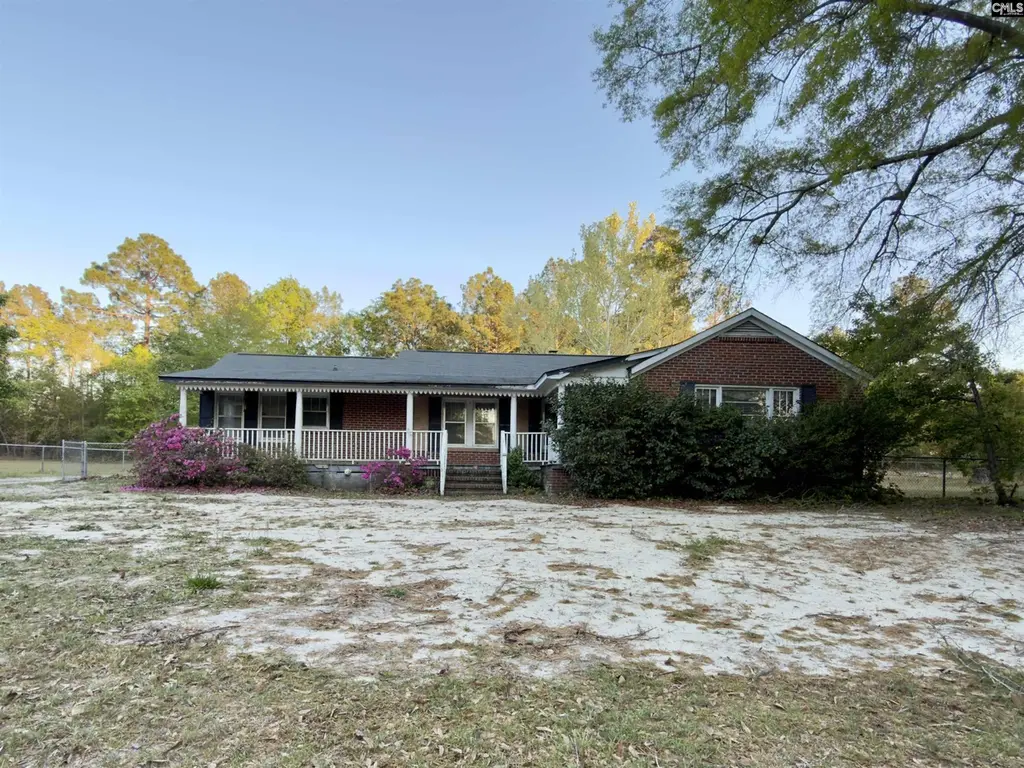
1927 Hwy 1 South · Lugoff, SC
Flood risk 1/10 · Minimal
- FEMA flood zone
- X (unshaded)
- Chance of flooding over 30 yrs
- 0.0%
- Est. flood insurance / yr
- $507 – $1,088
Fire risk 6/10 · Moderate
- Est. fire insurance / yr
- $783 – $1,453
Heat risk 7/10 · Major
- Hot days now (above 106°F)
- 7 days/yr
- Hot days in 30 yrs
- 16 days/yr
Wind risk 6/10 · Moderate
- Chance of severe wind over 30 yrs
- 74.0%
Air-quality risk 2/10 · Minimal
- Unhealthy air days now
- 2 days/yr
- Unhealthy air days in 30 yrs
- 2 days/yr
Risk factors via First Street. Map © Google.
Why this score? — see what drove the C+ grade
The composite is a weighted blend of 9 inputs, each scored 0–100. Each bar is that input's sub-score; the figure is the points it added to the 100-point composite (weight × sub-score).
- Cash flow +26.0/30.0
- DSCR +8.7/10.0
- ARV discount +7.5/15.0
- 1% rule +6.2/10.0
- Schools +3.8/10.0
- Livability +3.6/5.0
- Rent growth +2.5/5.0
- Condition / age +2.5/5.0
- Appreciation +0.0/10.0
$199,000
🖨 Deal sheet 📄 Offer letter ✓ Due diligence
Listing remarks
GENERAL DEVELOPMENT ZONING - Recent Price Improvement! Positioned along the high-visibility corridor of Hwy 1 in Lugoff, this nearly 2-acre property offers a rare blend of residential comfort and commercial potential under General Development (GD) zoning. With 2094 sq ft, 3 bedrooms, and 1.5 baths, the existing home provides the perfect foundation for a live/work setup, professional office conversion, or income-producing opportunity. The expansive, fully fenced backyard allows room for parking, expansion, or future business use, while dual septic systems and well availability add flexibility for development. Ideal for a boutique business, salon, real estate office, or service-based operatio
Key facts
- Two septic tanks
- Well water
- 1.89 acre lot
Tags
Property features AI
Exterior
- Parking: Carport attached (1 garage/carport space)
- Utilities: Septic sewer; Community water
- Home design: Single-family property; Total heated area approximately 2,094
- Construction: Crawlspace foundation
- Exterior features: Brick exterior on all sides above the foundation; Paved road frontage; Access to community water
Interior
- Bedrooms: Master bedroom on the main level
- Bathrooms: One full bathroom; One half bathroom
- Interior features: One fireplace; Central heating and central cooling
Neighborhood map
What this means for you Summary
Snapshot
- This is a 3-bed/1.5-bath other listed at $199k.
Deal economics
- At list price, monthly cash flow is $492 ($6k/yr) — positive.
- The deal already cash-flows at list — no discount required.
- Meets the 1% rule at list price ($2k rent vs $199k).
- Recommended offer: $187k (6.0% below list) — sets the bar for market timing.
Location & tenants
- Location reads 71/100 on livability (#47 in SC) — a middle-class / working-renter tenant base. Strengths: cost of living A+, housing A+, health & safety A+; Watch: amenities F, commute F.
- Kershaw 01 (rural): math 38% / reading 51% proficiency, ranked #25 of 80 in SC (top 31%) — families likely to look elsewhere, expect single-tenant / working-renter base with shorter leases.
- Zoned schools: Wateree Elementary (math 51% / reading 51%, grade C-, #158 of 597 statewide, top 27%, 732 students, 72% FRL); Lugoff-Elgin High (math 65% / reading 89%, grade A-, #28 of 196 statewide, top 16%, 1,744 students, 62% FRL) — zoned schools average 67% FRL vs 49% district-wide (18 pts higher); higher-poverty schools than district average — tighter screening recommended.
- Zoned-school proficiency averages 64% at this address vs 44% district-wide (+20 pts) — the actual schools serving this property are materially stronger than the Kershaw 01 average implies; a family-tenant draw the district grade alone would hide.
- Market conditions: 178 active listings in the ZIP; 2 comparable units currently listed for rent nearby; 491 units permitted in Kershaw County in 2024 (0 in 5+ unit buildings).
- This rent runs 39% of the median local income ($68k/yr) — at the standard rent-burdened threshold; future hikes will face affordability resistance.
Forward outlook
- Local home prices are declining (-3.0%/yr); year-one equity from $1k of loan paydown is wiped out by about $6k of value loss. Plan a longer hold.
- Kershaw County population projected at +8% by 2050 — modest demand growth; plan on rents tracking national, not racing it.
Negotiation context
- It's been on market 67 days — a 6% lower offer ($187k) is reasonable based on typical stale-listing flexibility.
- 2 sale attempts; this cycle's ask has dropped $36k (15%) from the opening price — seller is motivated, your offer sets the floor, not the list.
- Current owner paid $60k; list at $199k implies a 232% gain — meaningful room to come down on a strong offer.
Risks & watch-outs
- Watch-outs: built in 1950 — expect roof / HVAC / electrical / plumbing capex.
- Climate carrying-cost: major wind risk, 74% chance of damaging wind over 30y; major wildfire risk; extreme-heat days projected 7→16/yr by 2055 (HVAC capex compounding) — expect insurance premiums to compound above CPI over the hold.
Questions for the listing agent
- It's been on market 67 days. Have you received any prior offers? Is the seller open to a 6% concession, seller financing, or rate buy-down credit?
- Built in 1950 — when were the roof, HVAC, electrical panel, plumbing, and water heater last replaced?
- Why hasn't it sold? Are there any deal-killer items the seller is aware of (foundation, flood, title, zoning, code violations)?
- Is there a deadline driving the sale (1031 exchange, divorce, estate, relocation)? That informs how much negotiation room exists.
- What's the average days-on-market for RENTAL listings here right now (not sales)? A rising rental-DOM trend means longer vacancies and softer asking-rent achievability than the comps imply.
- What's the recent tenant-quality profile in this submarket — average credit score on applications, eviction rate, late-payment / NSF rate, and stable-employment percentage? A property-management company in the area should have these aggregated.
- How much new for-sale + rental construction is in the pipeline within 1–3 miles? Heavy new supply typically softens prices + rents 12–24 months out; constrained supply supports both.
Investment metrics
- 1% rule
- 1.12% ✓
- Cap rate
- 9.26%
- Cash-on-cash
- 10.61%
- DSCR
- 1.47
- GRM
- 7.4
CMA / ARV
No comps found within radius.
Projected returns pro-forma
-3.0% appreciation · 3.0% rent growth · sell at horizon
- IRR
- -0.4%
- Equity multiple
- 0.98×
- Total profit
- $-916
- Equity at exit
- $29,672
- IRR
- 9.2%
- Equity multiple
- 1.71×
- Total profit
- $39,454
- Equity at exit
- $17,206
Cash invested: $55,720 (down + closing). Projections, not guarantees.
Landlord ↔ Tenant lean methodology
- Overall (STATE)
- 90 Strongly Landlord-Friendly
- State South Carolina
- 90 Strongly Landlord-Friendly · R+6
- County
- — inherits STATE
- City
- — inherits STATE
ZIP-level market 29078
- Home prices YoY
- -22.9%
- Active inventory
- 178
- Price-to-rent
- 7.4×
Monthly cashflow live
- Estimated rent
- $2,228 medium interval (Pro) →
- Mortgage (P&I)
- −$1,044
- Tax from tax record
- −$141 /mo · $1,690/yr
- Insurance
- −$83
- HOA
- −$0
- Vacancy / Maint / Mgmt
- −$468
- Net cashflow
- $492
Break-even live
UW: 25.0% down · 7.5% · 30yr · 1.5% tax · 5.0% vac · 8.0% maint · 8.0% mgmt
Financing live
Cash to close
- Down payment
- $49,750
- Closing costs
- $5,970
- Reserves months
- —
- Total cash needed
- —
Loan-product check · same deal, 3 products live
Conventional
25% down · 7.5% · 30yr
- Down + closing
- —
- Monthly P&I
- —
- Monthly cashflow
- —
- DSCR
- —
- Eligible?
- —
Personal DTI + credit; lowest rate.
DSCR
20% down · 8.5% · 30yr
- Down + closing
- —
- Monthly P&I
- —
- Monthly cashflow
- —
- DSCR
- —
- Eligible?
- —
No personal income docs; deal must DSCR.
Hard money
10% down · 12.0% · 12mo
- Down + closing
- —
- Monthly P&I
- —
- Monthly cashflow
- —
- DSCR
- —
- Eligible?
- —
Short-term bridge; refi at stabilization.
Rent comps 2 comps
| Address | Beds | Baths | Sqft | Rent | $/sqft | DOM | Units | Dist |
|---|---|---|---|---|---|---|---|---|
| 11 Sedge Ct Elgin, SC | 4.0 | 2.0 | 1576 | $2,099 | $1.33 | 3d | 1 | 0.34mi |
| 89 Smokewood Dr Elgin, SC | 3.0 | 2.0 | 1840 | $2,129 | $1.16 | 3d | 1 | 0.53mi |
Listing history 21 events
-
2026-06-18days on market $199,000 Active 67 DOM
-
2026-06-17days on market $199,000 Active 66 DOM
-
2026-06-16days on market $199,000 Active 65 DOM
-
2026-06-15days on market $199,000 Active 64 DOM
-
2026-06-14days on market $199,000 Active 62 DOM
-
2026-06-10days on market $199,000 Active 60 DOM
-
2026-06-09days on market $199,000 Active 59 DOM
-
2026-06-08days on market $199,000 Active 58 DOM
-
2026-06-07days on market $199,000 Active 57 DOM
-
2026-06-05pricedays on market $199,000 Active 54 DOM
-
2026-06-03days on market $210,000 Active 53 DOM
-
2026-06-03days on market $210,000 Active 52 DOM
-
2026-06-02days on market $210,000 Active 51 DOM
-
2026-05-31days on market $210,000 Active 50 DOM
-
2026-05-23price $210,000
-
2026-05-11status Active
-
2026-05-11historical
-
2026-05-04price $220,000
-
2026-04-23price $225,000
-
2026-04-10$235,000 Active
-
2004-07-15soldstatus $60,000
ⓘ Source: listings_history table (triggers on properties + properties_extension) + one-shot
backfill from property_details.listing_events for pre-trigger history.
Tax reassessment forecast SC · Resets to sale price
- Current annual tax
- $1,690 · $141/mo
- Projected year-2 tax
- $1,690 · $141/mo
- Expected delta
- $0/yr ($0/mo · 0.0%)
ⓘ Screening estimate from a state-policy table — verify with the county assessor before closing.
Climate risk First Street
- Flood 1/10 Low FEMA zone X (unshaded) · 0% chance over 30 yrs
- Wildfire 6/10 Major
- Heat 7/10 Severe 7 d/yr ≥106°F today · 16 d/yr by 30 yrs out
- Wind 6/10 Major 74% chance of damaging wind over 30 yrs
- Air quality 2/10 Low 2 unhealthy d/yr today · 2 by 30 yrs out
Nearby sold comps map
Loading sold comps map…
Walkable amenities ~0.75 mi
Loading nearby amenities…
Taxation est. · year 1
- Rental income
- $26,731
- − Mortgage interest
- −$11,147
- − Property taxes
- −$1,690
- − Insurance
- −$995
- − Repairs & maintenance
- −$2,138
- − Management
- −$2,138
- − Depreciation
- −$5,789
- Taxable income
- $2,832
- Est. tax owed @ 24.0%
- −$680
- After-tax cash flow
- $5,229/yr
For passive investors: Depreciation is non-cash, so a rental often shows a tax loss while cash-flowing — sheltering income. Rental losses are passive: they offset passive income freely, and up to $25,000/yr can offset ordinary (W-2) income if you actively participate and your MAGI is under $100k (phasing out to $0 by $150k); unused losses carry forward. On sale, claimed depreciation is recaptured at up to 25%, and gains may owe capital-gains tax (a 1031 exchange can defer both). Figures are a year-1 estimate at your 24.0% rate — not tax advice; consult a CPA.
Schools (NCES district)
- District
- Kershaw 01
- NCES district ID
- 4502550
- Math proficiency
- 38% ▼ -7.00%
- Reading proficiency
- 51% ▲ 6.00%
- Median HH income
- $44,585
- Composite
- 37.66/100
- National rank
- #4371
- State rank
- #25 of 80 in SC
Livability — Lugoff
- Score
- 71/100
- State rank
- #47
- US rank
- #6636
Category grades
Schools grade is shown separately in the Schools card above.
Census & demographics
- Census place
- Lugoff, SC
- County
- Kershaw County · 47,655 people
- City population
- 16,283
- Metro
- Columbia, SC
- Population (ZIP)
- 16,283
- Household income
- $67,727
- Rent vs Own
- Severe rent burden
- 61.0
Population outlook (Kershaw County) Hauer SSP2
- Today (2025)
- 67,683 people
- By 2030
- 69,374 · +2.5%
- By 2040
- 71,936 · +6.3%
- By 2050
- 73,292 · +8.3%
- By 2075
- 75,762 · +11.9%
- By 2100
- 72,620 · +7.3%
Race, ethnicity, and origin ACS 2023
- Neighborhood character
- Predominantly White (74%)
- Race & ethnicity
- White 74% Black 18% Hispanic / Latino 6% Two or more races 4%
- Hispanic origin (detail)
- Puerto Rican 3%
- Common ancestry
- Italian 2% Lithuanian 2% Slovak 1%
- Foreign-born
- 2% · Canada
- Languages at home
- 93% English-only · Spanish 6%
Political lean MEDSL · Kershaw
- 2024 margin
- Strong R (+28.2) · D 35.3% · R 63.5% · Other 1.2%
- 2008→2024 swing
- -9.5pp toward R · 2008: -18.7pp · 2024: -28.2pp
- All cycles
- 2024: R+28.2 2020: R+23.1 2016: R+24.8 2012: R+18.6 2008: R+18.7
Not yet ingested
- Civics
- —
Market trends
- HPI YoY
- ▼ -62.83%
- Current HPI
- 211.3661
- Rent YoY
- —
- Metro
- Columbia, SC
- State GDP YoY
- ▲ 4.51%
- F500 in state
- 2
Industry mix (Fortune 500 HQ in SC)
| Industry | F500 HQs | Revenue |
|---|---|---|
| Packaging | 1 | $7B |
|
||
Price history
+250.0% since first listed7 events — show timeline
- 2026-05-23 Price Changed $210,000 Consolidated MLS
- 2026-05-11 Relisted — Consolidated MLS
- 2026-05-11 Delisted — Consolidated MLS
- 2026-05-04 Price Changed $220,000 Consolidated MLS
- 2026-04-23 Price Changed $225,000 Consolidated MLS
- 2026-04-10 Listed $235,000 Consolidated MLS
- 2004-07-15 Sold (Public Records) $60,000 Public Records
Property tax history
+4.0%/yrLatest (2025): $1,690 · +4.0% YoY. Source: county tax records.
Cash-flow waterfall
monthlySold comps — $/sqft
last 12 mo · ≤1 miLoading sold comps…