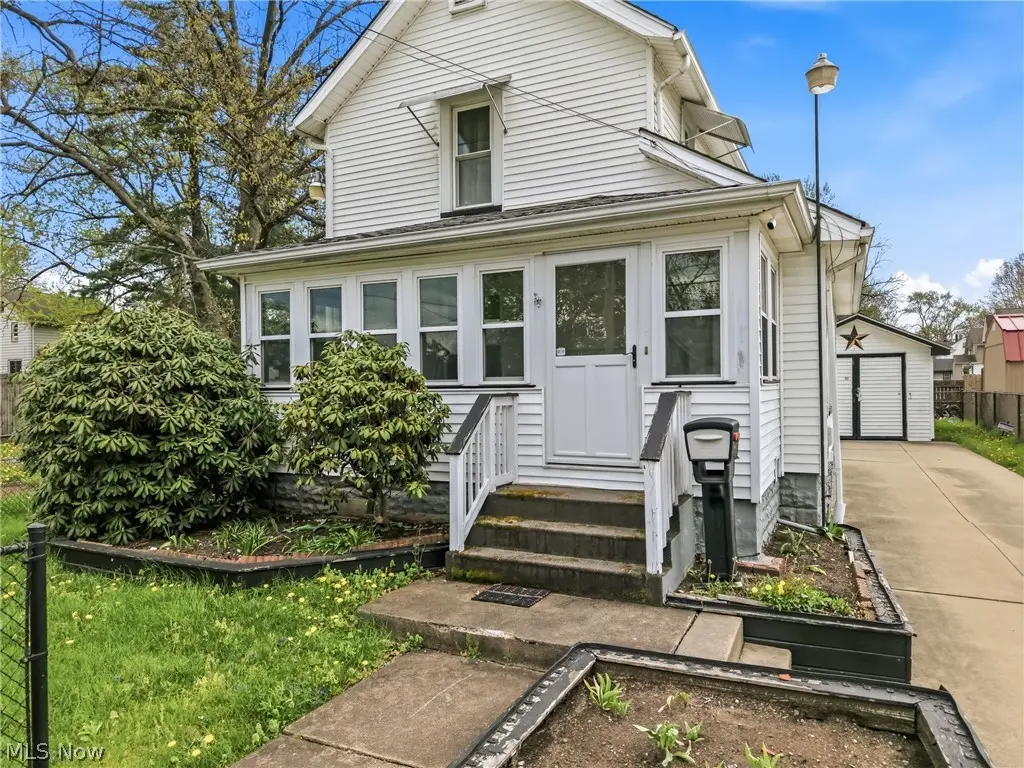
1224 Buena Vista Ave NE · Warren, OH
Flood risk 1/10 · Minimal
- FEMA flood zone
- X (unshaded)
- Chance of flooding over 30 yrs
- 0.0%
- Est. flood insurance / yr
- $473 – $860
Fire risk 1/10 · Minimal
- Est. fire insurance / yr
- $713 – $1,323
Heat risk 3/10 · Minor
- Hot days now (above 97°F)
- 7 days/yr
- Hot days in 30 yrs
- 17 days/yr
Wind risk 1/10 · Minimal
- Chance of severe wind over 30 yrs
- —
Air-quality risk 3/10 · Minor
- Unhealthy air days now
- 1 days/yr
- Unhealthy air days in 30 yrs
- 4 days/yr
Risk factors via First Street. Map © Google.
Why this score? — see what drove the C grade
The composite is a weighted blend of 9 inputs, each scored 0–100. Each bar is that input's sub-score; the figure is the points it added to the 100-point composite (weight × sub-score).
- Cash flow +27.5/30.0
- DSCR +9.6/10.0
- 1% rule +6.7/10.0
- Livability +3.7/5.0
- ARV discount +2.5/15.0
- Rent growth +2.5/5.0
- Condition / age +2.5/5.0
- Schools +2.2/10.0
- Appreciation +0.0/10.0
$78,000
🖨 Deal sheet (PDF) 📄 Offer letter ✓ Due diligence
Listing remarks
This charming two-bedroom, one-bath home is full of character and offers a great opportunity as a starter home, downsizing option or investment property. With inviting curb appeal, it's ready for your personal touch. Inside, you'll find a spacious kitchen, a bright dining room, and a large living room-perfect for everyday living and entertaining. The full basement includes a practical cold cellar, ideal for canned goods and pantry overflow. Enjoy the enclosed front sun porch or the enclosed back porch for additional flexible space. Featuring newer windows throughout, this property also offers a one-car garage with an attached carport, a fenced in yard, and additional parcel providing ample
Key facts
- Spacious kitchen
- Bright dining room
- Large living room
Tags
Property features AI
Exterior
- Parking: Detached garage (1 car); Detached carport (1 car); Paved driveway
- Utilities: Public water; Public sewer
- Home design: Two-story home; Vinyl siding; Asphalt/fiberglass roof
- Construction: Built per public records; Vinyl siding construction; Asphalt/fiberglass roof
- Exterior features: Enclosed porch and patio; Chain link fencing
Interior
- Kitchen: Range; Refrigerator; Disposal
- Bedrooms: Two bedrooms (both on the second level)
- Flooring: Carpet in living room, dining room, and bedrooms; Linoleum in kitchen and bathroom
- Bathrooms: One full bathroom (on the second level)
- Heating & cooling: Forced air gas heating; Central air conditioning
- Interior features: Window treatments throughout; Full unfinished basement with storage space
- Laundry & utility: Washer and dryer located in the basement
Neighborhood map
What this means for you Summary
Snapshot
- This is a 2-bed/1.0-bath single-family listed at $78k.
Deal economics
- At list price, monthly cash flow is $231 ($3k/yr) — positive.
- The deal already cash-flows at list — no discount required.
- Meets the 1% rule at list price ($913 rent vs $78k).
- Recommended offer: $76k (3.0% below list) — sets the bar for market timing.
- Cap rate 9.8% vs local median 5.9% in Warren — top-decile yield for the area; either an underpriced asset or a hidden risk that comps aren't pricing in. Stress-test before assuming the spread holds.
Location & tenants
- Location reads 73/100 on livability (#312 in OH) — a middle-class / working-renter tenant base. Strengths: cost of living A+, health & safety A+, housing A; Watch: crime D-, commute F, employment F.
- Warren City (urban): math 22% / reading 32% proficiency, ranked #599 of 656 in OH (top 91%) — low school quality limits family demand, transient renter base, plan for 1-2y turnover; 75% free/reduced lunch — lower-income household profile, screen leases tightly.
- Zoned schools: Lincoln Pk-8 School (math 31% / reading 39%, grade F, #1,110 of 1,584 statewide, top 70%, 1,066 students, 0% FRL); Warren G Harding High School (math 16% / reading 32%, grade F, #665 of 781 statewide, top 85%, 1,155 students, 0% FRL) — zoned schools average 0% FRL vs 75% district-wide (75 pts lower); this property's tenant base skews higher-income than the district average.
- Market conditions: 110 active listings in the ZIP; 3 comparable units currently listed for rent nearby; rentals at typical pace (median 15d on market — plan ~3-4 weeks tenant-placement turnaround); 129 units permitted in Trumbull County in 2024 (0 in 5+ unit buildings).
Forward outlook
- Local home prices are declining (-3.0%/yr); year-one equity from $539 of loan paydown is wiped out by about $2k of value loss. Plan a longer hold.
- Trumbull County population projected at -22% by 2050 — secular population decline; favor cash flow + early exit over multi-decade hold.
- At projected returns (-3.0% appreciation + 3.0% rent growth), your $22k cash investment doubles in ~9 years — after that, you're playing with house money.
Negotiation context
- It's been on market 32 days — a 3% lower offer ($76k) is reasonable based on typical stale-listing flexibility.
- Current owner paid $65k; 20% above their basis — modest negotiation headroom, anchor on the comps not their cost.
Risks & watch-outs
- Watch-outs: built in 1917 — expect roof / HVAC / electrical / plumbing capex.
Questions for the listing agent
- It's been on market 32 days. Have you received any prior offers? Is the seller open to a 3% concession, seller financing, or rate buy-down credit?
- Built in 1917 — when were the roof, HVAC, electrical panel, plumbing, and water heater last replaced?
- Is there a deadline driving the sale (1031 exchange, divorce, estate, relocation)? That informs how much negotiation room exists.
- Crime grade is D in this area — have there been break-ins, vandalism, or insurance claims at this property in the last 3 years? What carrier currently insures it and at what premium?
- What's the average days-on-market for RENTAL listings here right now (not sales)? A rising rental-DOM trend means longer vacancies and softer asking-rent achievability than the comps imply.
- What's the recent tenant-quality profile in this submarket — average credit score on applications, eviction rate, late-payment / NSF rate, and stable-employment percentage? A property-management company in the area should have these aggregated.
- How much new for-sale + rental construction is in the pipeline within 1–3 miles? Heavy new supply typically softens prices + rents 12–24 months out; constrained supply supports both.
Investment metrics
- 1% rule
- 1.17% ✓
- Cap rate
- 9.85%
- Cash-on-cash
- 12.70%
- DSCR
- 1.56
- GRM
- 7.1
CMA / ARV
- ARV (on-the-fly)
- $70,224
- Comps found
- 12
Show comp detail 12 sales within ~0.75 mi
| Address | Dist | Beds/Ba | Sqft | Sold | Price | $/sf | Match |
|---|---|---|---|---|---|---|---|
| 1224 Buena Vista Ave NE | 0.00mi | 2/1.0 | 912 (0%) | 1mo | $70,500 | $77 | 99 |
| 578 Forest St NE | 0.20mi | 2/1.0 | 904 (-1%) | 14mo | $40,800 | $45 | 77 |
| 1964 Bonnie Brae Ave NE | 0.73mi | 2/1.0 | 920 (+1%) | 10mo | $98,000 | $107 | 56 |
| 242 Idylwild St NE | 0.55mi | 3/1.0 (+1) | 968 (+6%) | 7mo | $22,500 | $23 | 54 |
| 1554 Edgewood NE | 0.57mi | 3/1.5 (+1) | 864 (-5%) | 6mo | $154,000 | $178 | 52 |
| 1856 Sheridan Ave NE | 0.61mi | 2/1.0 | 800 (-12%) | 2mo | $132,000 | $165 | 50 |
| 1787 Bonnie Brae Ave NE | 0.58mi | 3/1.0 (+1) | 1,008 (+10%) | 2mo | $80,000 | $79 | 48 |
| 1727 Sheridan Ave NE | 0.50mi | 3/2.0 (+1) | 876 (-4%) | 24mo | $60,000 | $68 | 41 |
| 1123 Mckinley St NE | 0.50mi | 3/1.0 (+1) | 976 (+7%) | 23mo | $69,500 | $71 | 41 |
| 1701 Beechwood St NE | 0.60mi | 2/1.0 | 800 (-12%) | 18mo | $107,500 | $134 | 37 |
| 138 Maryland St NE | 0.71mi | 2/1.5 | 1,047 (+15%) | 5mo | $26,500 | $25 | 36 |
| 157 Roosevelt St NW | 0.67mi | 3/1.0 (+1) | 1,040 (+14%) | 13mo | $19,000 | $18 | 29 |
Match score weights: distance 35% · size 25% · config 20% · recency 20%. Top-matched comps best support the ARV.
Projected returns pro-forma
-3.0% appreciation · 3.0% rent growth · sell at horizon
- IRR
- 2.5%
- Equity multiple
- 1.09×
- Total profit
- $2,064
- Equity at exit
- $11,630
- IRR
- 12.0%
- Equity multiple
- 1.95×
- Total profit
- $20,685
- Equity at exit
- $6,744
Cash invested: $21,840 (down + closing). Projections, not guarantees.
Landlord ↔ Tenant lean methodology
- Overall (STATE)
- 73 Landlord-Friendly
- State Ohio
- 73 Landlord-Friendly · R+6
- County
- — inherits STATE
- City
- — inherits STATE
ZIP-level market 44483
- Home prices YoY
- -16.3%
- Active inventory
- 110
- Price-to-rent
- 7.1×
Monthly cashflow live
- Estimated rent
- $913 medium interval (Pro) →
- Mortgage (P&I)
- −$409
- Tax from tax record
- −$49 /mo · $587/yr
- Insurance
- −$32
- HOA
- −$0
- Vacancy / Maint / Mgmt
- −$192
- Net cashflow
- $231
Break-even live
Sensitivity live
| Price | -10% $275 | -5% $253 | +0% $231 | +5% $209 | +10% $187 |
|---|---|---|---|---|---|
| Rent | -10% $159 | -5% $195 | +0% $231 | +5% $267 | +10% $303 |
| Rate | -1.0pp $270 | -0.5pp $251 | base $231 | +0.5pp $211 | +1.0pp $190 |
UW: 25.0% down · 7.5% · 30yr · 1.5% tax · 5.0% vac · 8.0% maint · 8.0% mgmt
Financing live
Cash to close
- Down payment
- $19,500
- Closing costs
- $2,340
- Reserves months
- —
- Total cash needed
- —
Loan-product check · same deal, 3 products live
Conventional
25% down · 7.5% · 30yr
- Down + closing
- —
- Monthly P&I
- —
- Monthly cashflow
- —
- DSCR
- —
- Eligible?
- —
Personal DTI + credit; lowest rate.
DSCR
20% down · 8.5% · 30yr
- Down + closing
- —
- Monthly P&I
- —
- Monthly cashflow
- —
- DSCR
- —
- Eligible?
- —
No personal income docs; deal must DSCR.
Hard money
10% down · 12.0% · 12mo
- Down + closing
- —
- Monthly P&I
- —
- Monthly cashflow
- —
- DSCR
- —
- Eligible?
- —
Short-term bridge; refi at stabilization.
Rent comps 3 comps
| Address | Beds | Baths | Sqft | Rent | $/sqft | DOM | Units | Dist |
|---|---|---|---|---|---|---|---|---|
| 259 Perkinswood Blvd NE Warren, OH | 1.0–2.0 | 1.0 | 743 | $845 | $1.14 | 15d | 3 | 1.28mi |
| 2661 South St SE Unit J Warren, OH | 2.0 | 1.0 | 670 | $800 | $1.19 | 15d | 1 | 1.39mi |
| 840 Woodbine Ave SE Unit 838 Warren, OH | 2.0 | 1.0 | 1009 | $1,000 | $0.99 | 15d | 1 | 1.40mi |
Listing history 3 events
-
2026-04-28historical Contingent
-
2026-04-24$78,000 Active
-
2023-07-19soldstatus $65,000
ⓘ Source: listings_history table (triggers on properties + properties_extension) + one-shot
backfill from property_details.listing_events for pre-trigger history.
Tax reassessment forecast OH · Partial reset (capped growth)
- Current annual tax
- $587 · $49/mo
- Projected year-2 tax
- $902 · $75/mo
- Expected delta
- +$315/yr (+$26/mo · 53.6%)
ⓘ Screening estimate from a state-policy table — verify with the county assessor before closing.
Climate risk First Street
- Flood 1/10 Low FEMA zone X (unshaded) · 0% chance over 30 yrs
- Wildfire 1/10 Low
- Heat 3/10 Moderate 7 d/yr ≥97°F today · 17 d/yr by 30 yrs out
- Wind 1/10 Low
- Air quality 3/10 Moderate 1 unhealthy d/yr today · 4 by 30 yrs out
Nearby sold comps map
Loading sold comps map…
Walkable amenities ~0.75 mi
Loading nearby amenities…
Taxation est. · year 1
- Rental income
- $10,961
- − Mortgage interest
- −$4,369
- − Property taxes
- −$587
- − Insurance
- −$390
- − Repairs & maintenance
- −$877
- − Management
- −$877
- − Depreciation
- −$2,269
- Taxable income
- $1,591
- Est. tax owed @ 24.0%
- −$382
- After-tax cash flow
- $2,391/yr
For passive investors: Depreciation is non-cash, so a rental often shows a tax loss while cash-flowing — sheltering income. Rental losses are passive: they offset passive income freely, and up to $25,000/yr can offset ordinary (W-2) income if you actively participate and your MAGI is under $100k (phasing out to $0 by $150k); unused losses carry forward. On sale, claimed depreciation is recaptured at up to 25%, and gains may owe capital-gains tax (a 1031 exchange can defer both). Figures are a year-1 estimate at your 24.0% rate — not tax advice; consult a CPA.
Schools (NCES district)
- District
- Warren City
- NCES district ID
- 3904499
- Math proficiency
- 22% ▼ -16.00%
- Reading proficiency
- 32% ▼ -9.00%
- Median HH income
- $28,222
- Composite
- 21.6/100
- National rank
- #8299
- State rank
- #599 of 656 in OH
Livability — Warren
- Score
- 73/100
- State rank
- #312
- US rank
- #5068
Category grades
Schools grade is shown separately in the Schools card above.
Census & demographics
- Census place
- Warren, OH
- County
- Trumbull County · 61,158 people
- City population
- 25,805
- Metro
- Youngstown-Warren-Boardman, OH-PA
- Population (ZIP)
- 25,805
- Household income
- $49,017
- Rent vs Own
- Severe rent burden
- 989.0
Population outlook (Trumbull County) Hauer SSP2
- Today (2025)
- 191,696 people
- By 2030
- 184,015 · -4.0%
- By 2040
- 166,810 · -13.0%
- By 2050
- 149,857 · -21.8%
- By 2075
- 115,769 · -39.6%
- By 2100
- 83,617 · -56.4%
Race, ethnicity, and origin ACS 2023
- Neighborhood character
- Predominantly White (77%)
- Race & ethnicity
- White 77% Black 14% Two or more races 7% Hispanic / Latino 4%
- Common ancestry
- Romanian 3% Slovak 2% Italian 1%
- Foreign-born
- 2% · Canada
- Languages at home
- 96% English-only · Other Indo-European 2% Spanish 2%
Political lean MEDSL · Trumbull
- 2024 margin
- R (+16.8) · D 41.2% · R 58.0%
- 2008→2024 swing
- -39.2pp toward R · 2008: 22.4pp · 2024: -16.8pp
- All cycles
- 2024: R+16.8 2020: R+10.6 2016: R+6.4 2012: D+22.2 2008: D+22.4
Not yet ingested
- Civics
- —
Market trends
- HPI YoY
- ▼ -42.50%
- Current HPI
- 218.3455
- Rent YoY
- —
- Metro
- Youngstown-Warren-Boardman, OH-PA
- State GDP YoY
- ▲ 1.98%
- F500 in state
- 48
Industry mix (Fortune 500 HQ in OH)
| Industry | F500 HQs | Revenue |
|---|---|---|
| Insurance | 3 | $145B |
|
||
| Industrial Machinery | 3 | $49B |
|
||
| Financial Services | 3 | $24B |
|
||
| Consumer Goods | 2 | $93B |
|
||
| Aerospace / Defense | 2 | $47B |
|
||
| Utilities | 2 | $33B |
|
||
Price history
+20.0% since first listed3 events — show timeline
- 2026-04-28 Contingent — MLSNOW
- 2026-04-24 Listed $78,000 MLSNOW
- 2023-07-19 Sold (Public Records) $65,000 Public Records
Property tax history
+160.0%/yrLatest (2025): $587 · +1.9% YoY. Source: county tax records.
Cash-flow waterfall
monthlySold comps — $/sqft
last 12 mo · ≤1 miLoading sold comps…