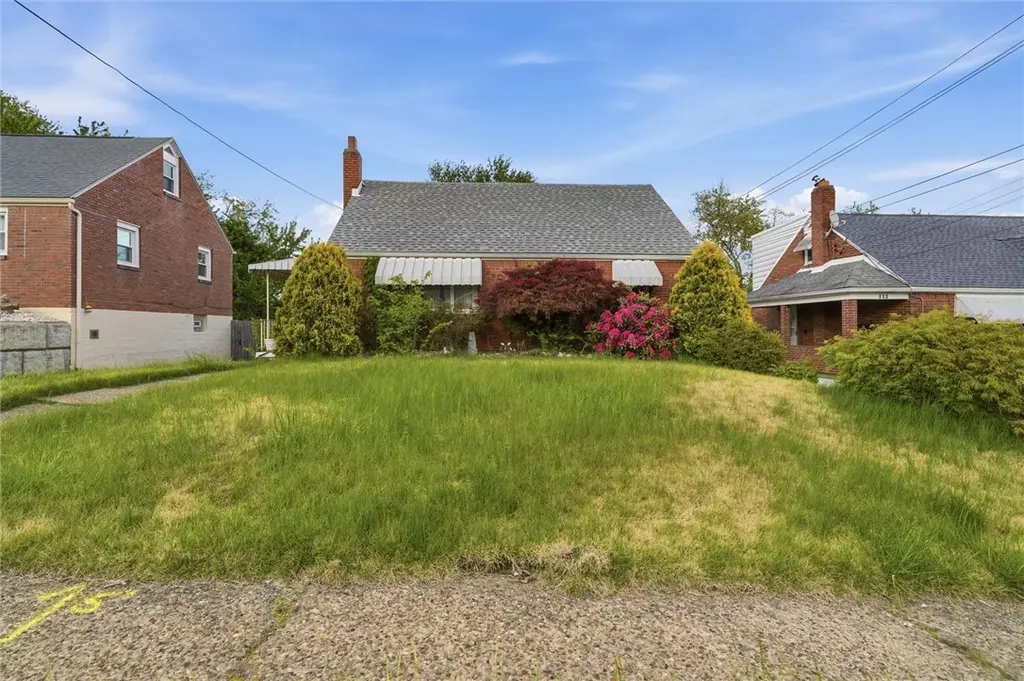
111 Arlene Ave · White Oak, PA
Flood risk 1/10 · Minimal
- FEMA flood zone
- X (unshaded)
- Chance of flooding over 30 yrs
- 0.0%
- Est. flood insurance / yr
- $473 – $860
Fire risk 1/10 · Minimal
- Est. fire insurance / yr
- $511 – $949
Heat risk 3/10 · Minor
- Hot days now (above 96°F)
- 7 days/yr
- Hot days in 30 yrs
- 17 days/yr
Wind risk 2/10 · Minimal
- Chance of severe wind over 30 yrs
- —
Air-quality risk 4/10 · Minor
- Unhealthy air days now
- 5 days/yr
- Unhealthy air days in 30 yrs
- 7 days/yr
Risk factors via First Street. Map © Google.
Why this score? — see what drove the B- grade
The composite is a weighted blend of 9 inputs, each scored 0–100. Each bar is that input's sub-score; the figure is the points it added to the 100-point composite (weight × sub-score).
- Cash flow +30.0/30.0
- 1% rule +10.0/10.0
- DSCR +10.0/10.0
- ARV discount +7.5/15.0
- Livability +3.9/5.0
- Rent growth +2.5/5.0
- Condition / age +2.5/5.0
- Schools +1.8/10.0
- Appreciation +0.0/10.0
$80,000
🖨 Deal sheet 📄 Offer letter ✓ Due diligence
Listing remarks
Spacious 4 bedroom brick home with strong bones and serious upside potential in the heart of North Versailles. Situated on a generous 8,050 sq ft lot, 111 Arlene offers over 1,300 sq ft of living space, an attached garage, central air, and a classic layout ready for your value-add vision. Built in 1950 with solid brick construction, this property has the kind of structure investors look for when evaluating long-term rental or flip opportunities. The home features four true bedrooms, making it attractive for larger households and maximizing rental demand. Large lot, off-street parking, and solid neighborhood fundamentals create a compelling opportunity to renovate and customize to your needs
Key facts
- Generous lot
- True bedrooms
- Off-street parking
Tags
Property features AI
Exterior
- Parking: Attached garage (built-in), 1 parking space
- Utilities: Sewer available; Water available; Property has power
- Home design: Brick construction; Asphalt roof
- Construction: Brick exterior; Asphalt roof
- Exterior features: Lot approximately 0.1848 acres; Resale condition
Interior
- Kitchen: Kitchen on main level (11x11)
- Bedrooms: Bedroom on upper level (14x10); Bedroom on upper level (15x14); Bedroom on main level (10x9)
- Flooring: Carpet; Vinyl
- Bathrooms: 1 full bathroom; 1 half bathroom
- Heating & cooling: Gas forced-air heating; Central air conditioning
- Interior features: Finished basement with walk-up access; 8 total rooms
- Laundry & utility: Laundry room in lower level (18x16)
Neighborhood map
What this means for you Summary
Snapshot
- This is a 4-bed/1.0-bath single-family listed at $80k.
Deal economics
- At list price, monthly cash flow is $618 ($7k/yr) — positive.
- The deal already cash-flows at list — no discount required.
- Meets the 1% rule at list price ($2k rent vs $80k).
- Recommended offer: $79k (1.5% below list) — sets the bar for market timing.
- Cap rate 15.6% vs local median 4.1% in White Oak — top-decile yield for the area; either an underpriced asset or a hidden risk that comps aren't pricing in. Stress-test before assuming the spread holds.
Location & tenants
- Location reads 77/100 on livability (#339 in PA, #2,982 nationally) — a middle-class / working-renter tenant base. Strengths: cost of living A+, housing A+, crime B+; Watch: schools D, amenities D-, commute F.
- East Allegheny SD (suburban): math 14% / reading 30% proficiency, ranked #485 of 539 in PA (top 90%) — low school quality limits family demand, transient renter base, plan for 1-2y turnover.
- Market conditions: 31 active listings in the ZIP; 1 comparable units currently listed for rent nearby; 2,996 units permitted in Allegheny County in 2024 (1,588 in 5+ unit buildings).
- This rent runs 36% of the median local income ($54k/yr) — at the standard rent-burdened threshold; future hikes will face affordability resistance.
Forward outlook
- Local home prices are declining (-3.0%/yr); year-one equity from $553 of loan paydown is wiped out by about $2k of value loss. Plan a longer hold.
- At projected returns (-3.0% appreciation + 3.0% rent growth), your $22k cash investment doubles in ~4 years — after that, you're playing with house money.
Negotiation context
- It's been on market 26 days — a 2% lower offer ($79k) is reasonable based on typical stale-listing flexibility.
- Current owner paid $51k; list at $80k implies a 57% gain — meaningful room to come down on a strong offer.
Risks & watch-outs
- Watch-outs: property tax is 2.8% of price; built in 1950 — expect roof / HVAC / electrical / plumbing capex.
Questions for the listing agent
- Built in 1950 — when were the roof, HVAC, electrical panel, plumbing, and water heater last replaced?
- Property tax is high relative to price — has the assessment been appealed recently, and will the sale trigger a re-assessment?
- Is there a deadline driving the sale (1031 exchange, divorce, estate, relocation)? That informs how much negotiation room exists.
- Schools are D-rated, which usually means shorter tenancies and higher turnover. Who's the typical renter profile here, and what's been the actual vacancy rate?
- What's the average days-on-market for RENTAL listings here right now (not sales)? A rising rental-DOM trend means longer vacancies and softer asking-rent achievability than the comps imply.
- What's the recent tenant-quality profile in this submarket — average credit score on applications, eviction rate, late-payment / NSF rate, and stable-employment percentage? A property-management company in the area should have these aggregated.
- How much new for-sale + rental construction is in the pipeline within 1–3 miles? Heavy new supply typically softens prices + rents 12–24 months out; constrained supply supports both.
Investment metrics
- 1% rule
- 1.99% ✓
- Cap rate
- 15.56%
- Cash-on-cash
- 33.11%
- DSCR
- 2.47
- GRM
- 4.2
CMA / ARV
- ARV (on-the-fly)
- $204,290
- Comps found
- 12
Show comp detail 12 sales within ~0.75 mi
| Address | Dist | Beds/Ba | Sqft | Sold | Price | $/sf | Match |
|---|---|---|---|---|---|---|---|
| 111 Arlene Ave | 0.00mi | 4/1.5 | 1,318 (0%) | 0mo | $90,000 | $68 | 98 |
| 170 Maryellen Dr | 0.24mi | 3/1.0 (-1) | 1,326 (+1%) | 9mo | $215,000 | $162 | 75 |
| 166 Maryellen Dr | 0.26mi | 3/1.5 (-1) | 1,370 (+4%) | 0mo | $223,500 | $163 | 74 |
| 173 Maryellen Dr | 0.21mi | 3/1.5 (-1) | 1,380 (+5%) | 2mo | $230,000 | $167 | 74 |
| 109 Arlene Ave | 0.01mi | 4/1.5 | 1,163 (-12%) | 15mo | $185,000 | $159 | 66 |
| 878 Joan Dr | 0.23mi | 3/2.0 (-1) | 1,281 (-3%) | 12mo | $194,900 | $152 | 66 |
| 411 Woodland Rd | 0.69mi | 4/1.0 | 1,323 (+0%) | 3mo | $115,000 | $87 | 65 |
| 136 Mckee Rd | 0.25mi | 3/1.5 (-1) | 1,366 (+4%) | 14mo | $160,000 | $117 | 64 |
| 3812 Alice Ave | 0.50mi | 3/1.0 (-1) | 1,152 (-13%) | 3mo | $161,500 | $140 | 48 |
| 1011 Taylor St | 0.64mi | 5/2.0 (+1) | 1,489 (+13%) | 1mo | $240,000 | $161 | 39 |
| 1303 Denning Way | 0.41mi | 3/2.0 (-1) | 1,150 (-13%) | 15mo | $168,000 | $146 | 38 |
| 1001 Taylor St | 0.67mi | 3/1.5 (-1) | 1,480 (+12%) | 13mo | $230,000 | $155 | 30 |
Match score weights: distance 35% · size 25% · config 20% · recency 20%. Top-matched comps best support the ARV.
Projected returns pro-forma
-3.0% appreciation · 3.0% rent growth · sell at horizon
- IRR
- 28.4%
- Equity multiple
- 2.18×
- Total profit
- $26,480
- Equity at exit
- $11,928
- IRR
- 35.8%
- Equity multiple
- 4.31×
- Total profit
- $74,062
- Equity at exit
- $6,917
Cash invested: $22,400 (down + closing). Projections, not guarantees.
Landlord ↔ Tenant lean methodology
- Overall (STATE)
- 62 Landlord-Friendly
- State Pennsylvania
- 62 Landlord-Friendly · EVEN
- County
- — inherits STATE
- City
- — inherits STATE
ZIP-level market 15137
- Home prices YoY
- -9.2%
- Active inventory
- 31
- Price-to-rent
- 4.2×
Monthly cashflow live
- Estimated rent
- $1,592 medium interval (Pro) →
- Mortgage (P&I)
- −$420
- Tax from tax record
- −$187 /mo · $2,241/yr
- Insurance
- −$33
- HOA
- −$0
- Vacancy / Maint / Mgmt
- −$334
- Net cashflow
- $618
Break-even live
UW: 25.0% down · 7.5% · 30yr · 1.5% tax · 5.0% vac · 8.0% maint · 8.0% mgmt
Financing live
Cash to close
- Down payment
- $20,000
- Closing costs
- $2,400
- Reserves months
- —
- Total cash needed
- —
Loan-product check · same deal, 3 products live
Conventional
25% down · 7.5% · 30yr
- Down + closing
- —
- Monthly P&I
- —
- Monthly cashflow
- —
- DSCR
- —
- Eligible?
- —
Personal DTI + credit; lowest rate.
DSCR
20% down · 8.5% · 30yr
- Down + closing
- —
- Monthly P&I
- —
- Monthly cashflow
- —
- DSCR
- —
- Eligible?
- —
No personal income docs; deal must DSCR.
Hard money
10% down · 12.0% · 12mo
- Down + closing
- —
- Monthly P&I
- —
- Monthly cashflow
- —
- DSCR
- —
- Eligible?
- —
Short-term bridge; refi at stabilization.
Rent comps 1 comps
| Address | Beds | Baths | Sqft | Rent | $/sqft | DOM | Units | Dist |
|---|---|---|---|---|---|---|---|---|
| 200 Delaware Ave North Versailles, PA | 3.0 | 1.5 | 1470 | $1,450 | $0.99 | 14d | 1 | 1.10mi |
Listing history 8 events
-
2026-06-07statusdays on market $80,000 Pending 26 DOM
-
2026-06-03days on market $80,000 Contingent 25 DOM
-
2026-06-02days on market $80,000 Contingent 24 DOM
-
2026-06-01days on market $80,000 Contingent 23 DOM
-
2026-05-31days on market $80,000 Contingent 22 DOM
-
2026-05-13historical Contingent
-
2026-05-09$80,000 Active
-
1992-09-01soldstatus $51,000
ⓘ Source: listings_history table (triggers on properties + properties_extension) + one-shot
backfill from property_details.listing_events for pre-trigger history.
Tax reassessment forecast PA · Partial reset (capped growth)
- Current annual tax
- $2,241 · $187/mo
- Projected year-2 tax
- $2,241 · $187/mo
- Expected delta
- $0/yr ($0/mo · 0.0%)
ⓘ Screening estimate from a state-policy table — verify with the county assessor before closing.
Climate risk First Street
- Flood 1/10 Low FEMA zone X (unshaded) · 0% chance over 30 yrs
- Wildfire 1/10 Low
- Heat 3/10 Moderate 7 d/yr ≥96°F today · 17 d/yr by 30 yrs out
- Wind 2/10 Low
- Air quality 4/10 Moderate 5 unhealthy d/yr today · 7 by 30 yrs out
Nearby sold comps map
Loading sold comps map…
Walkable amenities ~0.75 mi
Loading nearby amenities…
Taxation est. · year 1
- Rental income
- $19,104
- − Mortgage interest
- −$4,481
- − Property taxes
- −$2,241
- − Insurance
- −$400
- − Repairs & maintenance
- −$1,528
- − Management
- −$1,528
- − Depreciation
- −$2,327
- Taxable income
- $6,598
- Est. tax owed @ 24.0%
- −$1,584
- After-tax cash flow
- $5,833/yr
For passive investors: Depreciation is non-cash, so a rental often shows a tax loss while cash-flowing — sheltering income. Rental losses are passive: they offset passive income freely, and up to $25,000/yr can offset ordinary (W-2) income if you actively participate and your MAGI is under $100k (phasing out to $0 by $150k); unused losses carry forward. On sale, claimed depreciation is recaptured at up to 25%, and gains may owe capital-gains tax (a 1031 exchange can defer both). Figures are a year-1 estimate at your 24.0% rate — not tax advice; consult a CPA.
Schools (NCES district)
- District
- East Allegheny SD
- NCES district ID
- 4208060
- Math proficiency
- 14% ▼ -13.00%
- Reading proficiency
- 30% ▼ -19.00%
- Median HH income
- $38,748
- Composite
- 18.44/100
- National rank
- #8930
- State rank
- #485 of 539 in PA
Livability — White Oak
- Score
- 77/100
- State rank
- #339
- US rank
- #2982
Category grades
Schools grade is shown separately in the Schools card above.
Census & demographics
- County
- Allegheny County · 1,022,028 people
- City population
- 8,451
- Metro
- Pittsburgh, PA
- Population (ZIP)
- 10,043
- Household income
- $53,632
- Rent vs Own
- Severe rent burden
- 393.0
Population outlook (Allegheny County) Hauer SSP2
- Today (2025)
- 1,250,282 people
- By 2030
- 1,256,482 · +0.5%
- By 2040
- 1,256,318 · +0.5%
- By 2050
- 1,244,169 · -0.5%
- By 2075
- 1,197,693 · -4.2%
- By 2100
- 1,093,187 · -12.6%
Race, ethnicity, and origin ACS 2023
- Neighborhood character
- Predominantly White (77%)
- Race & ethnicity
- White 77% Black 18% Two or more races 2% Asian 2%
- Common ancestry
- Romanian 6% Slovak 3% Lithuanian 1%
- Foreign-born
- 2% · Vietnam
- Languages at home
- 97% English-only · Vietnamese 2%
Political lean MEDSL · Allegheny
- 2024 margin
- Strong D (+20.3) · D 59.7% · R 39.4%
- 2008→2024 swing
- +4.8pp toward D · 2008: 15.5pp · 2024: 20.3pp
- All cycles
- 2024: D+20.3 2020: D+20.4 2016: D+16.4 2012: D+14.4 2008: D+15.5
Not yet ingested
- Civics
- —
Market trends
- HPI YoY
- ▼ -25.43%
- Current HPI
- 252.4089
- Rent YoY
- —
- Metro
- Pittsburgh, PA
- State GDP YoY
- ▲ 1.68%
- F500 in state
- 34
Industry mix (Fortune 500 HQ in PA)
| Industry | F500 HQs | Revenue |
|---|---|---|
| Healthcare | 2 | $309B |
|
||
| Insurance | 2 | $27B |
|
||
| Telecommunications / Media | 1 | $124B |
|
||
| Industrial Distribution | 1 | $22B |
|
||
| Financial Services | 1 | $20B |
|
||
| Chemicals / Materials | 1 | $18B |
|
||
Price history
+56.9% since first listed3 events — show timeline
- 2026-05-13 Contingent — West Penn MLS
- 2026-05-09 Listed $80,000 West Penn MLS
- 1992-09-01 Sold (Public Records) $51,000 Public Records
Property tax history
-0.1%/yrLatest (2026): $2,241 · +0.0% YoY. Source: county tax records.
Cash-flow waterfall
monthlySold comps — $/sqft
last 12 mo · ≤1 miLoading sold comps…