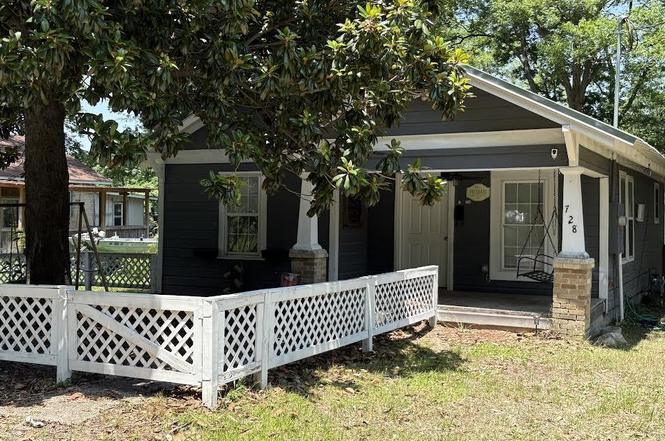
728 Mcbee St · Malvern, AR
Flood risk 1/10 · Minimal
- FEMA flood zone
- X (unshaded)
- Chance of flooding over 30 yrs
- 0.0%
- Est. flood insurance / yr
- $507 – $1,088
Fire risk 4/10 · Minor
- Est. fire insurance / yr
- $1,499 – $2,785
Heat risk 6/10 · Moderate
- Hot days now (above 111°F)
- 7 days/yr
- Hot days in 30 yrs
- 20 days/yr
Wind risk 4/10 · Minor
- Chance of severe wind over 30 yrs
- 14.0%
Air-quality risk 2/10 · Minimal
- Unhealthy air days now
- 0 days/yr
- Unhealthy air days in 30 yrs
- 1 days/yr
Risk factors via First Street. Map © Google.
Why this score? — see what drove the D grade
The composite is a weighted blend of 9 inputs, each scored 0–100. Each bar is that input's sub-score; the figure is the points it added to the 100-point composite (weight × sub-score).
- Cash flow +20.8/30.0
- DSCR +6.6/10.0
- 1% rule +4.4/10.0
- Livability +3.1/5.0
- Rent growth +2.5/5.0
- Condition / age +2.5/5.0
- Schools +1.8/10.0
- ARV discount +0.0/15.0
- Appreciation +0.0/10.0
$98,500
🖨 Deal sheet 📄 Offer letter ✓ Due diligence
Listing remarks MLS
Just right size, Just right price, just right neighborhood, updated, cute bungalow move-in ready. Fresh paint, new flooring throughout, updated kitchen and bathroom. You will love this home! Come see today.
Key facts
- Fenced yard
- Adorable porch
- Electric stove
Tags
Property features AI
Finance
- Financial info: Accepts VA, FHA, conventional loans and cash
Exterior
- Parking: Carport (1 car)
- Utilities: Public sewer; Public water; Municipal electric (Entergy); Natural gas
- Home design: Frame construction; Metal roof; Crawl space foundation; Single-family property
- Construction: Frame exterior; Metal roof; Crawl space foundation
- Exterior features: Deck; Porch; Paved road access; Level lot; Located in a subdivision; Inside city limits
Interior
- Kitchen: Free-standing stove; Gas range
- Flooring: Vinyl
- Bathrooms: 1 full bathroom
- Heating & cooling: Window air units; Gas space heater
- Interior features: Washer connection; Electric water heater
- Laundry & utility: Washer connection
Neighborhood map
What this means for you Summary
Snapshot
- This is a 2-bed/1.0-bath single-family listed at $98k.
Deal economics
- At list price, monthly cash flow is $135 ($2k/yr) — positive.
- The deal already cash-flows at list — no discount required.
- To meet the 1% rule (rent ≥ 1% of price), the offer needs to be $93k (6.1% below list).
- Recommended offer: $87k (12.0% below list) — sets the bar for market timing.
- Cap rate 7.9% vs local median 5.3% in Malvern — top-decile yield for the area; either an underpriced asset or a hidden risk that comps aren't pricing in. Stress-test before assuming the spread holds.
Location & tenants
- Location reads 62/100 on livability (#215 in AR) — a middle-class / working-renter tenant base. Strengths: cost of living A+, housing A+, health & safety A-; Watch: crime F, amenities F, commute F.
- Malvern School District (town): math 21% / reading 22% proficiency, ranked #207 of 238 in AR (top 87%) — low school quality limits family demand, transient renter base, plan for 1-2y turnover; 64% free/reduced lunch — lower-income household profile, screen leases tightly.
- Zoned schools: Malvern Elementary School (math 28% / reading 20%, grade F, #359 of 454 statewide, top 79%, 701 students, 77% FRL); Malvern High School (math 14% / reading 25%, grade F, #239 of 292 statewide, top 85%, 575 students, 66% FRL).
- Market conditions: 171 active listings in the ZIP; 5 comparable units currently listed for rent nearby; rentals at typical pace (median 14d on market — plan ~3-4 weeks tenant-placement turnaround); 4 units permitted in Hot Spring County in 2024 (0 in 5+ unit buildings).
Forward outlook
- Local home prices are declining (-3.0%/yr); year-one equity from $681 of loan paydown is wiped out by about $3k of value loss. Plan a longer hold.
- Hot Spring County population projected to shrink 3% by 2050 — rents likely to lag national; underwrite the cash flow, not the appreciation.
Negotiation context
- It's been on market 164 days — a 12% lower offer ($87k) is reasonable based on typical stale-listing flexibility.
- 4 sale attempts since 4y ago with the ask held roughly flat each time — persistent listings suggest the price (not the market) is what's stuck; bring a comps-based counter.
Risks & watch-outs
- Climate carrying-cost: extreme-heat days projected 7→20/yr by 2055 (HVAC capex compounding) — expect insurance premiums to compound above CPI over the hold.
Questions for the listing agent
- It's been on market 164 days. Have you received any prior offers? Is the seller open to a 12% concession, seller financing, or rate buy-down credit?
- Built in 1960 — when were the roof, HVAC, electrical panel, plumbing, and water heater last replaced?
- Why hasn't it sold? Are there any deal-killer items the seller is aware of (foundation, flood, title, zoning, code violations)?
- Is there a deadline driving the sale (1031 exchange, divorce, estate, relocation)? That informs how much negotiation room exists.
- Schools are D-rated, which usually means shorter tenancies and higher turnover. Who's the typical renter profile here, and what's been the actual vacancy rate?
- Crime grade is F in this area — have there been break-ins, vandalism, or insurance claims at this property in the last 3 years? What carrier currently insures it and at what premium?
- The area grade is low — what's the realistic commute time and amenity access for the typical tenant pool here? Any planned neighborhood developments (good or bad) we should know about?
- What's the average days-on-market for RENTAL listings here right now (not sales)? A rising rental-DOM trend means longer vacancies and softer asking-rent achievability than the comps imply.
- What's the recent tenant-quality profile in this submarket — average credit score on applications, eviction rate, late-payment / NSF rate, and stable-employment percentage? A property-management company in the area should have these aggregated.
- How much new for-sale + rental construction is in the pipeline within 1–3 miles? Heavy new supply typically softens prices + rents 12–24 months out; constrained supply supports both.
Investment metrics
- 1% rule
- 0.94% ✗
- Cap rate
- 7.93%
- Cash-on-cash
- 5.86%
- DSCR
- 1.26
- GRM
- 8.9
CMA / ARV
- ARV (on-the-fly)
- $76,560
- Comps found
- 7
Show comp detail 7 sales within ~0.75 mi
| Address | Dist | Beds/Ba | Sqft | Sold | Price | $/sf | Match |
|---|---|---|---|---|---|---|---|
| 917 Mcbee St | 0.12mi | 2/1.0 | 884 (+0%) | 21mo | $56,000 | $63 | 76 |
| 903 Edward St | 0.21mi | 2/1.0 | 840 (-4%) | 13mo | $73,000 | $87 | 72 |
| 841 Hall St | 0.25mi | 2/1.0 | 868 (-1%) | 18mo | $105,000 | $121 | 71 |
| 1426 Porter St | 0.55mi | 2/1.0 | 920 (+4%) | 7mo | $106,800 | $116 | 61 |
| 1312 Monroe St | 0.42mi | 3/1.0 (+1) | 940 (+7%) | 21mo | $119,000 | $127 | 46 |
| 1327 Locust St | 0.67mi | 2/1.0 | 977 (+11%) | 17mo | $59,900 | $61 | 36 |
| 1611 Willow St | 0.74mi | 2/1.0 | 792 (-10%) | 23mo | $15,000 | $19 | 29 |
Match score weights: distance 35% · size 25% · config 20% · recency 20%. Top-matched comps best support the ARV.
Projected returns pro-forma
-3.0% appreciation · 3.0% rent growth · sell at horizon
- IRR
- -7.3%
- Equity multiple
- 0.73×
- Total profit
- $-7,420
- Equity at exit
- $14,687
- IRR
- 2.3%
- Equity multiple
- 1.16×
- Total profit
- $4,431
- Equity at exit
- $8,516
Cash invested: $27,580 (down + closing). Projections, not guarantees.
Landlord ↔ Tenant lean methodology
- Overall (STATE)
- 92 Strongly Landlord-Friendly
- State Arkansas
- 92 Strongly Landlord-Friendly · R+14
- County
- — inherits STATE
- City
- — inherits STATE
ZIP-level market 72104
- Home prices YoY
- -7.3%
- Active inventory
- 171
- Price-to-rent
- 8.9×
Monthly cashflow live
- Estimated rent
- $925 high interval (Pro) →
- Mortgage (P&I)
- −$517
- Tax from tax record
- −$39 /mo · $465/yr
- Insurance
- −$41
- HOA
- −$0
- Vacancy / Maint / Mgmt
- −$194
- Net cashflow
- $135
Break-even live
UW: 25.0% down · 7.5% · 30yr · 1.5% tax · 5.0% vac · 8.0% maint · 8.0% mgmt
Financing live
Cash to close
- Down payment
- $24,625
- Closing costs
- $2,955
- Reserves months
- —
- Total cash needed
- —
Loan-product check · same deal, 3 products live
Conventional
25% down · 7.5% · 30yr
- Down + closing
- —
- Monthly P&I
- —
- Monthly cashflow
- —
- DSCR
- —
- Eligible?
- —
Personal DTI + credit; lowest rate.
DSCR
20% down · 8.5% · 30yr
- Down + closing
- —
- Monthly P&I
- —
- Monthly cashflow
- —
- DSCR
- —
- Eligible?
- —
No personal income docs; deal must DSCR.
Hard money
10% down · 12.0% · 12mo
- Down + closing
- —
- Monthly P&I
- —
- Monthly cashflow
- —
- DSCR
- —
- Eligible?
- —
Short-term bridge; refi at stabilization.
Rent comps 5 comps
| Address | Beds | Baths | Sqft | Rent | $/sqft | DOM | Units | Dist |
|---|---|---|---|---|---|---|---|---|
| 1226 School St Malvern, AR | 2.0 | 1.0 | 768 | $900 | $1.17 | 14d | 1 | 0.47mi |
| 1627 Willow St Malvern, AR | 3.0 | 1.0 | 960 | $1,200 | $1.25 | 14d | 1 | 0.82mi |
| 330 Elmo St Unit 1 Malvern, AR | 2.0 | 1.0 | 800 | $800 | $1.00 | 14d | 1 | 0.86mi |
| 1426 Stanley St Malvern, AR | 2.0 | 1.0 | 800 | $850 | $1.06 | 14d | 1 | 1.09mi |
| 1426 Stanley St Malvern, AR | 2.0 | 1.0 | 800 | $850 | $1.06 | 21d | 1 | 1.09mi |
Listing history 30 events
-
2026-06-19days on market $98,500 Active 164 DOM
-
2026-06-18days on market $98,500 Active 163 DOM
-
2026-06-17days on market $98,500 Active 162 DOM
-
2026-06-16days on market $98,500 Active 161 DOM
-
2026-06-15days on market $98,500 Active 160 DOM
-
2026-06-14days on market $98,500 Active 158 DOM
-
2026-06-13days on market $98,500 Active 157 DOM
-
2026-06-10days on market $98,500 Active 155 DOM
-
2026-06-09days on market $98,500 Active 154 DOM
-
2026-06-08days on market $98,500 Active 153 DOM
-
2026-06-07days on market $98,500 Active 152 DOM
-
2026-06-02days on market $98,500 Active 147 DOM
-
2026-06-01days on market $98,500 Active 146 DOM
-
2026-05-31days on market $98,500 Active 145 DOM
-
2026-05-30days on market $98,500 Active 144 DOM
-
2026-04-23price $98,500
-
2026-03-21price $99,000
-
2026-01-04$100,000 New Listing
-
2026-01-01historical
-
2025-09-03price $100,000
-
2025-08-19price $128,000
-
2025-08-08$130,000 New Listing
-
2022-10-06soldstatus $95,000
-
2022-09-29soldstatus $95,000 207-char remark
Show marketing remark (207 chars)
Just right size, Just right price, just right neighborhood, updated, cute bungalow move-in ready. Fresh paint, new flooring throughout, updated kitchen and bathroom. You will love this home! Come see today.
-
2022-09-16soldstatus $95,000 Sold
-
2022-07-26status Under Contract
-
2022-07-24$118,000 207-char remark
Show marketing remark (207 chars)
Just right size, Just right price, just right neighborhood, updated, cute bungalow move-in ready. Fresh paint, new flooring throughout, updated kitchen and bathroom. You will love this home! Come see today.
-
2022-06-14price $118,000
-
2022-05-05$120,000 New Listing
-
2021-06-09soldstatus $7,000
ⓘ Source: listings_history table (triggers on properties + properties_extension) + one-shot
backfill from property_details.listing_events for pre-trigger history.
Tax reassessment forecast AR · Resets to sale price
- Current annual tax
- $465 · $39/mo
- Projected year-2 tax
- $630 · $53/mo
- Expected delta
- +$165/yr (+$14/mo · 35.6%)
ⓘ Screening estimate from a state-policy table — verify with the county assessor before closing.
Climate risk First Street
- Flood 1/10 Low FEMA zone X (unshaded) · 0% chance over 30 yrs
- Wildfire 4/10 Moderate
- Heat 6/10 Major 7 d/yr ≥111°F today · 20 d/yr by 30 yrs out
- Wind 4/10 Moderate 14% chance of damaging wind over 30 yrs
- Air quality 2/10 Low 0 unhealthy d/yr today · 1 by 30 yrs out
Nearby sold comps map
Loading sold comps map…
Walkable amenities ~0.75 mi
Loading nearby amenities…
Taxation est. · year 1
- Rental income
- $11,104
- − Mortgage interest
- −$5,518
- − Property taxes
- −$465
- − Insurance
- −$492
- − Repairs & maintenance
- −$888
- − Management
- −$888
- − Depreciation
- −$2,865
- Taxable loss
- −$13
- Est. tax savings @ 24.0%
- +$3
- After-tax cash flow
- $1,619/yr
For passive investors: Depreciation is non-cash, so a rental often shows a tax loss while cash-flowing — sheltering income. Rental losses are passive: they offset passive income freely, and up to $25,000/yr can offset ordinary (W-2) income if you actively participate and your MAGI is under $100k (phasing out to $0 by $150k); unused losses carry forward. On sale, claimed depreciation is recaptured at up to 25%, and gains may owe capital-gains tax (a 1031 exchange can defer both). Figures are a year-1 estimate at your 24.0% rate — not tax advice; consult a CPA.
Schools (NCES district)
- District
- Malvern School District
- NCES district ID
- 0509240
- Math proficiency
- 21% ▼ -11.00%
- Reading proficiency
- 22% ▼ -9.00%
- Median HH income
- $35,370
- Composite
- 17.76/100
- National rank
- #9017
- State rank
- #207 of 238 in AR
Livability — Malvern
- Score
- 62/100
- State rank
- #215
- US rank
- #16632
Category grades
Schools grade is shown separately in the Schools card above.
Census & demographics
- Census place
- Malvern, AR
- Population (ZIP)
- 23,222
Population outlook (Hot Spring County) Hauer SSP2
- Today (2025)
- 34,464 people
- By 2030
- 34,659 · +0.6%
- By 2040
- 34,486 · +0.1%
- By 2050
- 33,419 · -3.0%
- By 2075
- 28,702 · -16.7%
- By 2100
- 21,415 · -37.9%
Race, ethnicity, and origin ACS 2023
- Neighborhood character
- Predominantly White (75%)
- Race & ethnicity
- White 75% Black 16% Two or more races 5% Hispanic / Latino 4%
- Common ancestry
- Serbian 2% Slovak 1% Iranian 1%
- Foreign-born
- 1% · Canada
- Languages at home
- 97% English-only · Spanish 3%
Political lean MEDSL · Hot Spring
- 2024 margin
- Solid R (+52.2) · D 22.9% · R 75.1% · Other 1.9%
- 2008→2024 swing
- -27.7pp toward R · 2008: -24.4pp · 2024: -52.2pp
- All cycles
- 2024: R+52.2 2020: R+48.7 2016: R+42.5 2012: R+29.0 2008: R+24.4
Not yet ingested
- Civics
- —
Market trends
- HPI YoY
- ▼ -16.79%
- Current HPI
- 211.6419
- Rent YoY
- —
- Metro
- —
- State GDP YoY
- ▲ 3.80%
- F500 in state
- 10
Industry mix (Fortune 500 HQ in AR)
| Industry | F500 HQs | Revenue |
|---|---|---|
| Retail | 1 | $681B |
|
||
| Food / Agriculture | 1 | $53B |
|
||
| Retail / Energy | 1 | $22B |
|
||
| Transportation / Logistics | 1 | $12B |
|
||
| Energy | 1 | $4B |
|
||
Price history
+1307.1% since first listed15 events — show timeline
- 2026-04-23 Price Changed $98,500 CARMLS
- 2026-03-21 Price Changed $99,000 CARMLS
- 2026-01-04 Listed $100,000 CARMLS
- 2026-01-01 Listing Removed — CARMLS
- 2025-09-03 Price Changed $100,000 CARMLS
- 2025-08-19 Price Changed $128,000 CARMLS
- 2025-08-08 Listed $130,000 CARMLS
- 2022-10-06 Sold (Public Records) $95,000 Public Records
- 2022-09-29 Sold (MLS) $95,000 HSBOR
- 2022-09-16 Sold (MLS) $95,000 CARMLS
- 2022-07-26 Pending — CARMLS
- 2022-07-24 Listed $118,000 HSBOR
- 2022-06-14 Price Changed $118,000 CARMLS
- 2022-05-05 Listed $120,000 CARMLS
- 2021-06-09 Sold (Public Records) $7,000 Public Records
Property tax history
+16.4%/yrLatest (2025): $465 · +1061.7% YoY. Source: county tax records.
Cash-flow waterfall
monthlySold comps — $/sqft
last 12 mo · ≤1 miLoading sold comps…