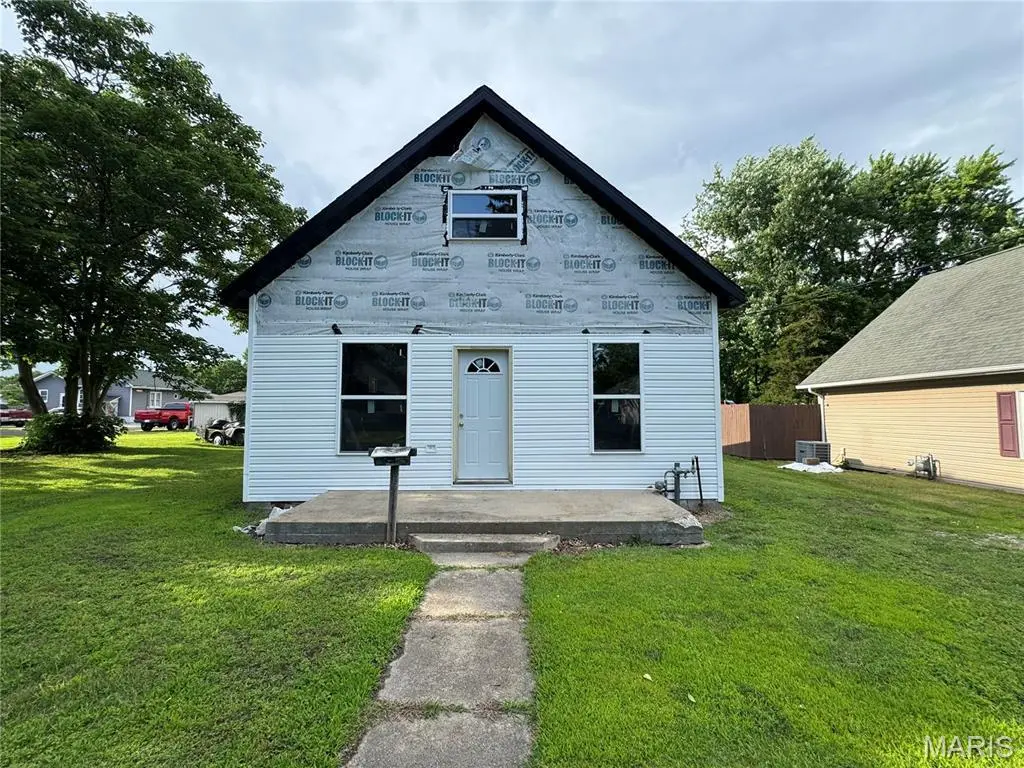
603 E Chestnut St · Gillespie, IL
Flood risk 3/10 · Minor
- FEMA flood zone
- X
- Chance of flooding over 30 yrs
- 0.2%
- Est. flood insurance / yr
- $473 – $860
Fire risk 1/10 · Minimal
- Est. fire insurance / yr
- $804 – $1,492
Heat risk 4/10 · Minor
- Hot days now (above 105°F)
- 7 days/yr
- Hot days in 30 yrs
- 20 days/yr
Wind risk 2/10 · Minimal
- Chance of severe wind over 30 yrs
- 1.0%
Air-quality risk 4/10 · Minor
- Unhealthy air days now
- 3 days/yr
- Unhealthy air days in 30 yrs
- 6 days/yr
Risk factors via First Street. Map © Google.
Why this score? — see what drove the B- grade
The composite is a weighted blend of 9 inputs, each scored 0–100. Each bar is that input's sub-score; the figure is the points it added to the 100-point composite (weight × sub-score).
- Cash flow +30.0/30.0
- 1% rule +10.0/10.0
- DSCR +10.0/10.0
- ARV discount +7.5/15.0
- Livability +3.7/5.0
- Rent growth +2.5/5.0
- Condition / age +2.5/5.0
- Schools +1.5/10.0
- Appreciation +0.0/10.0
$50,000
🖨 Deal sheet 📄 Offer letter ✓ Due diligence
Listing remarks
Investor or Handyman Opportunity! Bring your vision and finishing touches to this promising property. This home is a blank slate and has already seen several major improvements and is ready for completion. The current layout is designed for 3 bedrooms and 1.5 bathrooms, offering plenty of potential for a homeowner or investor. Recent updates include a new roof, black soffit, new windows, and the start of electrical upgrades. New siding has been installed and only requires finishing work. Situated on two lots, the property features a spacious yard with room to enjoy or expand. As an added bonus, many of the building materials already purchased for the renovation will be included with the sal
Key facts
- Spacious yard
- Two lots
- New siding
Tags
Property features AI
Exterior
- Utilities: Public water; Public sewer; Electric: Other
- Home design: Single family residence; Residential property
- Construction: Vinyl siding; Architectural shingle roof
- Exterior features: Corner lot; Few trees on the lot
Interior
- Bedrooms: 3 bedrooms total; 2 bedrooms on the main level; 1 bedroom on the upper level
- Bathrooms: 1 full bathroom; 1 half bathroom (main level)
- Heating & cooling: Other heating; Other cooling
- Interior features: One and one-half story layout; Estimated above-grade finished area of 1,124
Neighborhood map
What this means for you Summary
Snapshot
- This is a 3-bed/1.5-bath single-family listed at $50k.
Deal economics
- At list price, monthly cash flow is $455 ($5k/yr) — positive.
- The deal already cash-flows at list — no discount required.
- Meets the 1% rule at list price ($994 rent vs $50k).
- Recommended offer: $49k (1.5% below list) — sets the bar for market timing.
Location & tenants
- Location reads 74/100 on livability (#261 in IL, #4,848 nationally) — a middle-class / working-renter tenant base. Strengths: cost of living A+, housing A+, crime A; Watch: amenities F, commute D-, employment F.
- Gillespie CUSD 7 (town): math 14% / reading 20% proficiency, ranked #485 of 620 in IL (top 78%) — low school quality limits family demand, transient renter base, plan for 1-2y turnover.
- Zoned schools: Gillespie High School (math 27% / reading 32%, grade F, #187 of 693 statewide, top 30%, 340 students, 0% FRL) — zoned schools average 0% FRL vs 57% district-wide (57 pts lower); this property's tenant base skews higher-income than the district average.
- Zoned-school proficiency averages 30% at this address vs 17% district-wide (+12 pts) — the actual schools serving this property are materially stronger than the Gillespie CUSD 7 average implies; a family-tenant draw the district grade alone would hide.
- Market conditions: 21 active listings in the ZIP; 70 units permitted in Macoupin County in 2024 (0 in 5+ unit buildings).
Forward outlook
- Local home prices are declining (-3.0%/yr); year-one equity from $346 of loan paydown is wiped out by about $2k of value loss. Plan a longer hold.
- Macoupin County population projected at -27% by 2050 — secular population decline; favor cash flow + early exit over multi-decade hold.
- At projected returns (-3.0% appreciation + 3.0% rent growth), your $14k cash investment doubles in ~4 years — after that, you're playing with house money.
Negotiation context
- It's been on market 17 days — a 2% lower offer ($49k) is reasonable based on typical stale-listing flexibility.
Risks & watch-outs
- Watch-outs: built in 1940 — expect roof / HVAC / electrical / plumbing capex.
Questions for the listing agent
- Built in 1940 — when were the roof, HVAC, electrical panel, plumbing, and water heater last replaced?
- Is there a deadline driving the sale (1031 exchange, divorce, estate, relocation)? That informs how much negotiation room exists.
- Schools are D-rated, which usually means shorter tenancies and higher turnover. Who's the typical renter profile here, and what's been the actual vacancy rate?
- What's the average days-on-market for RENTAL listings here right now (not sales)? A rising rental-DOM trend means longer vacancies and softer asking-rent achievability than the comps imply.
- What's the recent tenant-quality profile in this submarket — average credit score on applications, eviction rate, late-payment / NSF rate, and stable-employment percentage? A property-management company in the area should have these aggregated.
- How much new for-sale + rental construction is in the pipeline within 1–3 miles? Heavy new supply typically softens prices + rents 12–24 months out; constrained supply supports both.
Investment metrics
- 1% rule
- 1.99% ✓
- Cap rate
- 17.21%
- Cash-on-cash
- 39.00%
- DSCR
- 2.74
- GRM
- 4.2
CMA / ARV
- ARV (on-the-fly)
- $131,508
- Comps found
- 12
Show comp detail 12 sales within ~0.75 mi
| Address | Dist | Beds/Ba | Sqft | Sold | Price | $/sf | Match |
|---|---|---|---|---|---|---|---|
| 422 E Elm St | 0.33mi | 2/1.0 (-1) | 1,140 (+1%) | 9mo | $70,000 | $61 | 68 |
| 503 Henry St | 0.52mi | 3/1.0 | 1,200 (+7%) | 5mo | $160,000 | $133 | 58 |
| 708 Madison St | 0.61mi | 3/2.0 | 1,180 (+5%) | 7mo | $149,900 | $127 | 56 |
| 422 Henry St | 0.47mi | 3/1.0 | 1,100 (-2%) | 22mo | $129,000 | $117 | 54 |
| 803 S Madison St | 0.63mi | 3/1.0 | 1,200 (+7%) | 12mo | $21,000 | $18 | 47 |
| 708 Springfield Rd | 0.60mi | 3/1.0 | 1,200 (+7%) | 15mo | $159,000 | $133 | 46 |
| 811 Adams St | 0.67mi | 2/1.0 (-1) | 1,000 (-11%) | 1mo | $115,000 | $115 | 42 |
| 411 W Chestnut St | 0.64mi | 2/1.0 (-1) | 1,092 (-3%) | 23mo | $19,900 | $18 | 39 |
| 414 W Walnut | 0.66mi | 2/1.5 (-1) | 1,060 (-6%) | 20mo | $27,500 | $26 | 38 |
| 300 W Maple St | 0.64mi | 2/1.5 (-1) | 1,032 (-8%) | 21mo | $124,800 | $121 | 34 |
| 211 W Baker St | 0.64mi | 2/1.0 (-1) | 1,010 (-10%) | 18mo | $50,000 | $50 | 32 |
| 400 E Broadway | 0.70mi | 2/1.0 (-1) | 988 (-12%) | 13mo | $124,900 | $126 | 29 |
Match score weights: distance 35% · size 25% · config 20% · recency 20%. Top-matched comps best support the ARV.
Projected returns pro-forma
-3.0% appreciation · 3.0% rent growth · sell at horizon
- IRR
- 35.2%
- Equity multiple
- 2.49×
- Total profit
- $20,880
- Equity at exit
- $7,455
- IRR
- 42.0%
- Equity multiple
- 4.97×
- Total profit
- $55,518
- Equity at exit
- $4,323
Cash invested: $14,000 (down + closing). Projections, not guarantees.
Landlord ↔ Tenant lean methodology
- Overall (STATE)
- 43 Moderately Tenant-Leaning
- State Illinois
- 43 Moderately Tenant-Leaning · D+7
- County
- — inherits STATE
- City
- — inherits STATE
ZIP-level market 62033
- Home prices YoY
- -25.4%
- Active inventory
- 21
- Price-to-rent
- 4.2×
Monthly cashflow live
- Estimated rent
- $994 medium interval (Pro) →
- Mortgage (P&I)
- −$262
- Tax from tax record
- −$48 /mo · $571/yr
- Insurance
- −$21
- HOA
- −$0
- Vacancy / Maint / Mgmt
- −$209
- Net cashflow
- $455
Break-even live
UW: 25.0% down · 7.5% · 30yr · 1.5% tax · 5.0% vac · 8.0% maint · 8.0% mgmt
Financing live
Cash to close
- Down payment
- $12,500
- Closing costs
- $1,500
- Reserves months
- —
- Total cash needed
- —
Loan-product check · same deal, 3 products live
Conventional
25% down · 7.5% · 30yr
- Down + closing
- —
- Monthly P&I
- —
- Monthly cashflow
- —
- DSCR
- —
- Eligible?
- —
Personal DTI + credit; lowest rate.
DSCR
20% down · 8.5% · 30yr
- Down + closing
- —
- Monthly P&I
- —
- Monthly cashflow
- —
- DSCR
- —
- Eligible?
- —
No personal income docs; deal must DSCR.
Hard money
10% down · 12.0% · 12mo
- Down + closing
- —
- Monthly P&I
- —
- Monthly cashflow
- —
- DSCR
- —
- Eligible?
- —
Short-term bridge; refi at stabilization.
Listing history 13 events
-
2026-06-18days on market $50,000 Active 17 DOM
-
2026-06-17days on market $50,000 Active 16 DOM
-
2026-06-16days on market $50,000 Active 15 DOM
-
2026-06-15days on market $50,000 Active 14 DOM
-
2026-06-13days on market $50,000 Active 12 DOM
-
2026-06-12days on market $50,000 Active 11 DOM
-
2026-06-09days on market $50,000 Active 8 DOM
-
2026-06-08days on market $50,000 Active 7 DOM
-
2026-06-07days on market $50,000 Active 6 DOM
-
2026-06-05days on market $50,000 Active 4 DOM
-
2026-06-04days on market $50,000 Active 2 DOM
-
2026-06-02remarks 699-char remark
-
2026-06-02$50,000 Active 1 DOM
ⓘ Source: listings_history table (triggers on properties + properties_extension) + one-shot
backfill from property_details.listing_events for pre-trigger history.
Tax reassessment forecast IL · Partial reset (capped growth)
- Current annual tax
- $571 · $48/mo
- Projected year-2 tax
- $853 · $71/mo
- Expected delta
- +$282/yr (+$23/mo · 49.3%)
ⓘ Screening estimate from a state-policy table — verify with the county assessor before closing.
Climate risk First Street
- Flood 3/10 Moderate FEMA zone X · 20% chance over 30 yrs
- Wildfire 1/10 Low
- Heat 4/10 Moderate 7 d/yr ≥105°F today · 20 d/yr by 30 yrs out
- Wind 2/10 Low 100% chance of damaging wind over 30 yrs
- Air quality 4/10 Moderate 3 unhealthy d/yr today · 6 by 30 yrs out
Nearby sold comps map
Loading sold comps map…
Walkable amenities ~0.75 mi
Loading nearby amenities…
Taxation est. · year 1
- Rental income
- $11,934
- − Mortgage interest
- −$2,801
- − Property taxes
- −$571
- − Insurance
- −$250
- − Repairs & maintenance
- −$955
- − Management
- −$955
- − Depreciation
- −$1,455
- Taxable income
- $4,947
- Est. tax owed @ 24.0%
- −$1,187
- After-tax cash flow
- $4,272/yr
For passive investors: Depreciation is non-cash, so a rental often shows a tax loss while cash-flowing — sheltering income. Rental losses are passive: they offset passive income freely, and up to $25,000/yr can offset ordinary (W-2) income if you actively participate and your MAGI is under $100k (phasing out to $0 by $150k); unused losses carry forward. On sale, claimed depreciation is recaptured at up to 25%, and gains may owe capital-gains tax (a 1031 exchange can defer both). Figures are a year-1 estimate at your 24.0% rate — not tax advice; consult a CPA.
Schools (NCES district)
- District
- Gillespie CUSD 7
- NCES district ID
- 1716680
- Math proficiency
- 14% ▼ -12.00%
- Reading proficiency
- 20% ▼ -19.00%
- Median HH income
- $41,399
- Composite
- 14.59/100
- National rank
- #9413
- State rank
- #485 of 620 in IL
Livability — Gillespie
- Score
- 74/100
- State rank
- #261
- US rank
- #4848
Category grades
Schools grade is shown separately in the Schools card above.
Census & demographics
- Census place
- Gillespie, IL
- Population (ZIP)
- 4,398
Population outlook (Macoupin County) Hauer SSP2
- Today (2025)
- 42,867 people
- By 2030
- 40,796 · -4.8%
- By 2040
- 36,135 · -15.7%
- By 2050
- 31,469 · -26.6%
- By 2075
- 22,102 · -48.4%
- By 2100
- 15,380 · -64.1%
Race, ethnicity, and origin ACS 2023
- Neighborhood character
- Predominantly White (93%)
- Race & ethnicity
- White 93% Two or more races 6%
- Common ancestry
- Slovak 3% Romanian 2% Serbian 1%
- Foreign-born
- 0%
Political lean MEDSL · Macoupin
- 2024 margin
- Solid R (+39.2) · D 29.4% · R 68.7% · Other 1.9%
- 2008→2024 swing
- -49.0pp toward R · 2008: 9.8pp · 2024: -39.2pp
- All cycles
- 2024: R+39.2 2020: R+36.5 2016: R+35.0 2012: R+7.0 2008: D+9.8
Not yet ingested
- Civics
- —
Market trends
- HPI YoY
- ▼ -46.59%
- Current HPI
- 136.9671
- Rent YoY
- —
- Metro
- —
- State GDP YoY
- ▲ 1.59%
- F500 in state
- 60
Industry mix (Fortune 500 HQ in IL)
| Industry | F500 HQs | Revenue |
|---|---|---|
| Insurance | 4 | $201B |
|
||
| Consumer Goods | 4 | $87B |
|
||
| Industrial Machinery | 3 | $64B |
|
||
| Healthcare | 2 | $55B |
|
||
| Retail / Pharmacy | 1 | $148B |
|
||
| Agriculture / Food | 1 | $86B |
|
||
Price history
1 event — show timeline
- 2026-06-01 Listed $50,000 MARIS as Distributed by MLS Grid
Property tax history
-7.1%/yrLatest (2024): $571 · +1.2% YoY. Source: county tax records.
Cash-flow waterfall
monthlySold comps — $/sqft
last 12 mo · ≤1 miLoading sold comps…