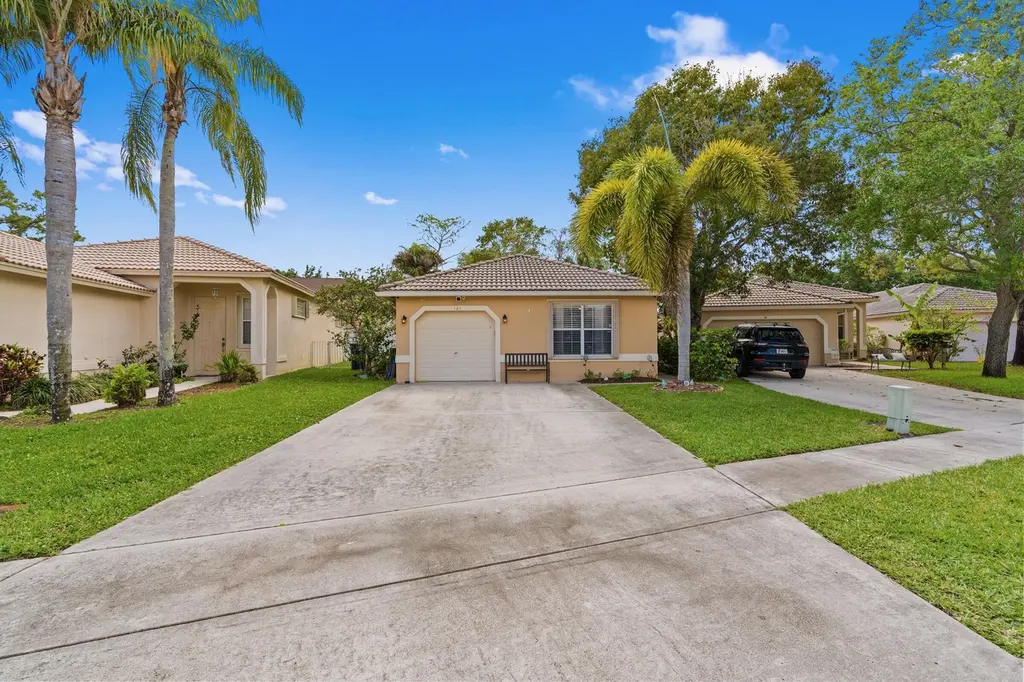
121 Prestige Dr · Royal Palm Beach, FL
Flood risk 1/10 · Minimal
- FEMA flood zone
- X (unshaded)
- Chance of flooding over 30 yrs
- 0.0%
- Est. flood insurance / yr
- $507 – $1,088
Fire risk 4/10 · Minor
- Est. fire insurance / yr
- $947 – $1,759
Heat risk 10/10 · Severe
- Hot days now (above 107°F)
- 7 days/yr
- Hot days in 30 yrs
- 25 days/yr
Wind risk 10/10 · Severe
- Chance of severe wind over 30 yrs
- 99.0%
Air-quality risk 2/10 · Minimal
- Unhealthy air days now
- 0 days/yr
- Unhealthy air days in 30 yrs
- 1 days/yr
Risk factors via First Street. Map © Google.
Why this score? — see what drove the D- grade
The composite is a weighted blend of 9 inputs, each scored 0–100. Each bar is that input's sub-score; the figure is the points it added to the 100-point composite (weight × sub-score).
- Appreciation +10.0/10.0
- ARV discount +7.5/15.0
- Cash flow +4.9/30.0
- Schools +4.3/10.0
- Livability +4.0/5.0
- Rent growth +2.7/5.0
- Condition / age +2.5/5.0
- 1% rule +1.3/10.0
- DSCR +0.0/10.0
$430,000
🖨 Deal sheet (PDF) 📄 Offer letter ✓ Due diligence
Listing remarks MLS
ALMOST NEW 3 BEDROOM HOME-TILE IN ALL LIVING AREAS-GATED COMM. COMM. POOL-TILE ROOF-1 CAR GARAGE
Key facts
- 4,999 sq ft lot
- Garage
- Built 2000
Tags
Property features AI
Finance
- Financial info: Pets allowed with no restrictions
- HOA & community: Association with monthly fee of $200 covering common areas; Association amenities: Other
Exterior
- Parking: 3 parking spaces total; Attached 1-car garage; Covered space (1); Driveway
- Utilities: Public water; Public sewer; Electricity connected
- Home design: Single family residence; One story; Resale property; Faces east
- Construction: CBS construction; Built with tile roof
- Exterior features: Not waterfront; Tile roof
Interior
- Kitchen: Dishwasher; Electric range; Microwave; Refrigerator
- Bedrooms: 2 bedrooms on the main level
- Flooring: Other flooring
- Bathrooms: 2 full bathrooms
- Heating & cooling: Central heating; Central air conditioning; Ceiling fan(s)
- Interior features: Dishwasher; Electric range; Microwave; Refrigerator; Laundry inside
- Laundry & utility: Indoor laundry
Neighborhood map
What this means for you Summary
Snapshot
- This is a 3-bed/2.0-bath single-family listed at $430k.
Deal economics
- At list price, monthly cash flow is $-1k ($-12k/yr) — negative.
- To cash-flow at today's rent, offer at most $282k (34.4% below list).
- To meet the 1% rule (rent ≥ 1% of price), the offer needs to be $272k (36.7% below list).
- Recommended offer: $272k (36.7% below list) — sets the bar for 1% rule.
Location & tenants
- Location reads 79/100 on livability (#135 in FL, #2,039 nationally) — a middle-class / working-renter tenant base. Strengths: employment A+, housing A+, health & safety A+; Watch: cost of living C-, amenities F, commute F.
- Palm Beach (suburban): math 46% / reading 53% proficiency, ranked #34 of 73 in FL (top 47%) — families likely to look elsewhere, expect single-tenant / working-renter base with shorter leases.
- Zoned schools: H. L. Johnson Elementary School (math 70% / reading 69%, grade A-, #364 of 2,144 statewide, top 19%, 817 students, 40% FRL); Crestwood Community Middle (math 49% / reading 52%, grade C, #246 of 571 statewide, top 44%, 724 students, 50% FRL); Royal Palm Beach High School (math 22% / reading 38%, grade F, #441 of 667 statewide, top 67%, 2,343 students, 57% FRL) — zoned schools at 49% FRL track the district average.
- Market conditions: Rents flat; 583 active listings in the ZIP; 40 comparable units currently listed for rent nearby; rentals at typical pace (median 24d on market — plan ~3-4 weeks tenant-placement turnaround); solid renter incomes; 3,974 units permitted in Palm Beach County in 2024 (1,012 in 5+ unit buildings).
- This rent runs 35% of the median local income ($93k/yr) — at the standard rent-burdened threshold; future hikes will face affordability resistance.
Forward outlook
- In year one you build about $46k of equity ($3k loan paydown + $43k appreciation (10.0% local appreciation)).
- Palm Beach County population projected at +30% by 2050 — long-run rental-demand tailwind backs the buy-and-hold thesis.
- By year 2, paydown + projected appreciation supports a ~$74k cash-out refi (75% LTV) — recoverable capital for the next deal without selling this one.
Negotiation context
- It's been on market 75 days — a 6% lower offer ($404k) is reasonable based on typical stale-listing flexibility.
- 7 sale attempts since 24y ago with the ask held roughly flat each time — persistent listings suggest the price (not the market) is what's stuck; bring a comps-based counter.
- Current owner paid $148k; list at $430k implies a 191% gain — meaningful room to come down on a strong offer.
Risks & watch-outs
- Climate carrying-cost: severe wind risk, 99% chance of damaging wind over 30y; extreme-heat days projected 7→25/yr by 2055 (HVAC capex compounding) — expect insurance premiums to compound above CPI over the hold.
Questions for the listing agent
- What do current leases actually rent for vs. the listed asking? Can we see a recent rent roll and the last 12 months of T-12 income?
- It's been on market 75 days. Have you received any prior offers? Is the seller open to a 37% concession, seller financing, or rate buy-down credit?
- What does the HOA fee cover, when was the last increase, and are there any pending special assessments or reserve-fund shortfalls?
- Why hasn't it sold? Are there any deal-killer items the seller is aware of (foundation, flood, title, zoning, code violations)?
- Is there a deadline driving the sale (1031 exchange, divorce, estate, relocation)? That informs how much negotiation room exists.
- Schools are B-rated — typically a magnet for longer-tenancy family renters. What's the average tenant stay here, and is there a school-zone premium baked into asking?
- The area grade is low — what's the realistic commute time and amenity access for the typical tenant pool here? Any planned neighborhood developments (good or bad) we should know about?
- What's the average days-on-market for RENTAL listings here right now (not sales)? A rising rental-DOM trend means longer vacancies and softer asking-rent achievability than the comps imply.
- What's the recent tenant-quality profile in this submarket — average credit score on applications, eviction rate, late-payment / NSF rate, and stable-employment percentage? A property-management company in the area should have these aggregated.
- How much new for-sale + rental construction is in the pipeline within 1–3 miles? Heavy new supply typically softens prices + rents 12–24 months out; constrained supply supports both.
Investment metrics
- 1% rule
- 0.63% ✗
- Cap rate
- 3.44%
- Cash-on-cash
- -10.19%
- DSCR
- 0.55
- GRM
- 13.2
CMA / ARV
No comps found within radius.
Projected returns pro-forma
10.0% appreciation · 0.85% rent growth · sell at horizon
- IRR
- 16.6%
- Equity multiple
- 2.36×
- Total profit
- $163,459
- Equity at exit
- $387,378
- IRR
- 15.5%
- Equity multiple
- 5.34×
- Total profit
- $522,212
- Equity at exit
- $835,395
Cash invested: $120,400 (down + closing). Projections, not guarantees.
Landlord ↔ Tenant lean methodology
- Overall (STATE)
- 87 Strongly Landlord-Friendly
- State Florida
- 87 Strongly Landlord-Friendly · R+3
- County
- — inherits STATE
- City
- — inherits STATE
ZIP-level market 33411
- Home prices YoY
- 1.9%
- Rents YoY
- 0.8%
- Active inventory
- 583
- Price-to-rent
- 13.2×
Monthly cashflow live
- Estimated rent
- $2,720 high interval (Pro) →
- Mortgage (P&I)
- −$2,255
- Tax est. 1.5%
- −$538 /mo · $6,450/yr
- Insurance
- −$179
- HOA
- −$200
- Vacancy / Maint / Mgmt
- −$571
- Net cashflow
- $-1,023
Break-even live
Sensitivity live
| Price | -10% $-725 | -5% $-874 | +0% $-1,023 | +5% $-1,171 | +10% $-1,320 |
|---|---|---|---|---|---|
| Rent | -10% $-1,238 | -5% $-1,130 | +0% $-1,023 | +5% $-915 | +10% $-808 |
| Rate | -1.0pp $-806 | -0.5pp $-913 | base $-1,023 | +0.5pp $-1,134 | +1.0pp $-1,247 |
UW: 25.0% down · 7.5% · 30yr · 1.5% tax · 5.0% vac · 8.0% maint · 8.0% mgmt
Financing live
Cash to close
- Down payment
- $107,500
- Closing costs
- $12,900
- Reserves months
- —
- Total cash needed
- —
Loan-product check · same deal, 3 products live
Conventional
25% down · 7.5% · 30yr
- Down + closing
- —
- Monthly P&I
- —
- Monthly cashflow
- —
- DSCR
- —
- Eligible?
- —
Personal DTI + credit; lowest rate.
DSCR
20% down · 8.5% · 30yr
- Down + closing
- —
- Monthly P&I
- —
- Monthly cashflow
- —
- DSCR
- —
- Eligible?
- —
No personal income docs; deal must DSCR.
Hard money
10% down · 12.0% · 12mo
- Down + closing
- —
- Monthly P&I
- —
- Monthly cashflow
- —
- DSCR
- —
- Eligible?
- —
Short-term bridge; refi at stabilization.
Rent comps 40 comps
| Address | Beds | Baths | Sqft | Rent | $/sqft | DOM | Units | Dist |
|---|---|---|---|---|---|---|---|---|
| 1605 Palm Beach Trace Dr Royal Palm Beach, FL | 2.0 | 2.0 | 1201 | $2,100 | $1.75 | 14d | 1 | 0.09mi |
| 1803 Palm Beach Trace Dr Royal Palm Beach, FL | 2.0 | 2.0 | 1201 | $2,000 | $1.67 | 20d | 1 | 0.11mi |
| 101 Fairway Ln Royal Palm Beach, FL | 3.0 | 2.5 | 1684 | $3,300 | $1.96 | 23d | 1 | 0.12mi |
| 145 Prestige Dr Royal Palm Beach, FL | 3.0 | 2.0 | 1464 | $2,900 | $1.98 | 18d | 1 | 0.12mi |
| 180 Heatherwood Dr Royal Palm Beach, FL | 3.0 | 2.0 | 1462 | $2,710 | $1.85 | 7d | 1 | 0.17mi |
| 43 Essex Ct Unit A Royal Palm Beach, FL | 2.0 | 2.5 | 1398 | $2,500 | $1.79 | 26d | 1 | 0.22mi |
| 1407 Lakeview Dr E Royal Palm Beach, FL | 2.0 | 2.0 | 1165 | $2,300 | $1.97 | 9d | 1 | 0.27mi |
| 36 Danbury Ct Unit B Royal Palm Beach, FL | 2.0 | 2.5 | 1398 | $2,300 | $1.65 | 12d | 1 | 0.27mi |
| 1601 Lakeview Dr W Unit 1601 Royal Palm Beach, FL | 3.0 | 2.5 | 1296 | $2,375 | $1.83 | 23d | 1 | 0.31mi |
| 212 Trace Ct Royal Palm Beach, FL | 3.0 | 2.0 | 1740 | $3,050 | $1.75 | 7d | 1 | 0.33mi |
| 202 Lakeside Landing Dr Royal Palm Beach, FL | 3.0 | 2.5 | 1532 | $3,200 | $2.09 | 5d | 1 | 0.49mi |
| 182 Sparrow Dr Unit A Royal Palm Beach, FL | 3.0 | 2.0 | 1485 | $3,000 | $2.02 | 26d | 1 | 0.62mi |
| 81 Westecunk Dr Royal Palm Beach, FL | 2.0 | 2.0 | 1347 | $2,550 | $1.89 | 19d | 1 | 0.63mi |
| 216 Cordoba Cir Royal Palm Beach, FL | 3.0 | 2.0 | 1461 | $3,440 | $2.35 | 1d | 1 | 0.65mi |
| 190 Parkwood Dr Royal Palm Beach, FL | 3.0 | 2.0 | 1644 | $3,200 | $1.95 | 26d | 1 | 0.67mi |
| 210 Sparrow Dr #4 Royal Palm Beach, FL | 2.0 | 2.0 | 930 | $1,900 | $2.04 | 22d | 1 | 0.67mi |
| 139 Sparrow Dr Royal Palm Beach, FL | 2.0–3.0 | 1.5–2.5 | 1100 | $2,390 | $2.17 | 16d | 3 | 0.69mi |
| 202 Sparrow Dr #1 Royal Palm Beach, FL | 3.0 | 2.0 | 1020 | $2,400 | $2.35 | 26d | 1 | 0.69mi |
| 110 Weybridge Cir Unit A Royal Palm Beach, FL | 2.0 | 2.5 | 1470 | $2,350 | $1.60 | 23d | 1 | 0.69mi |
| 296 Sandpiper Ave Royal Palm Beach, FL | 3.0 | 2.0 | 1569 | $3,100 | $1.98 | 26d | 1 | 0.73mi |
| 100 Miramar Ave Royal Palm Beach, FL | 3.0 | 2.0 | 1812 | $3,600 | $1.99 | 26d | 1 | 0.76mi |
| 111 Weybridge Cir Royal Palm Beach, FL | 3.0 | 2.5 | 1710 | $3,100 | $1.81 | 6d | 1 | 0.78mi |
| 151 Cordoba Cir Royal Palm Beach, FL | 3.0 | 2.0 | 1421 | $3,300 | $2.32 | 26d | 1 | 0.81mi |
| 132 Weybridge Cir Royal Palm Beach, FL | 2.0 | 2.5 | 1470 | $3,000 | $2.04 | 26d | 1 | 0.81mi |
| 240 Bilbao St Royal Palm Beach, FL | 3.0 | 2.0 | 1440 | $3,400 | $2.36 | 26d | 1 | 0.88mi |
| 263 Deerfield Ct Royal Palm Beach, FL | 2.0 | 2.0 | 1120 | $1,800 | $1.61 | 26d | 1 | 0.88mi |
| 73 Macadamia Ct Royal Palm Beach, FL | 2.0 | 2.0 | 1112 | $2,000 | $1.80 | 13d | 1 | 0.91mi |
| 100 Sparrow Dr #14 Royal Palm Beach, FL | 3.0 | 2.0 | 1737 | $2,725 | $1.57 | 26d | 1 | 0.96mi |
| 100 Sparrow Dr #2 Royal Palm Beach, FL | 3.0 | 2.0 | 1824 | $2,725 | $1.49 | 20d | 1 | 0.98mi |
| 221 Bilbao St Royal Palm Beach, FL | 3.0 | 2.0 | 1657 | $3,700 | $2.23 | 26d | 1 | 1.01mi |
| 113 Madrid St Royal Palm Beach, FL | 4.0 | 3.0 | 1720 | $4,500 | $2.62 | 26d | 1 | 1.01mi |
| 113 Madrid St Royal Palm Beach, FL | 3.0 | 3.0 | 1720 | $4,500 | $2.62 | 12d | 1 | 1.01mi |
| 179 Dove Cir Royal Palm Beach, FL | 3.0 | 2.0 | 1642 | $3,500 | $2.13 | 26d | 1 | 1.11mi |
| 7 Greenway Vlg N Royal Palm Beach, FL | 1.0–2.0 | 1.5–2.0 | 930 | $1,700 | $1.83 | 18d | 2 | 1.17mi |
| 2 Greenway Vlg N #210 Royal Palm Beach, FL | 2.0 | 2.0 | 1080 | $2,000 | $1.85 | 26d | 1 | 1.18mi |
| 118 Bobwhite Rd Royal Palm Beach, FL | 3.0 | 2.0 | 1444 | $3,200 | $2.22 | 19d | 1 | 1.18mi |
| 4 Greenway Vlg N #203 Royal Palm Beach, FL | 2.0 | 2.0 | 1080 | $2,000 | $1.85 | 26d | 1 | 1.20mi |
| 10863 Dalmany Way Royal Palm Beach, FL | 3.0 | 2.0 | 1232 | $3,500 | $2.84 | 26d | 1 | 1.23mi |
| 10360 Fox Trail Rd S #1602 West Palm Beach, FL | 2.0 | 2.0 | 1048 | $1,920 | $1.83 | 22d | 1 | 1.34mi |
| 12007 Poinciana Blvd #205 Royal Palm Beach, FL | 2.0 | 2.0 | 1088 | $1,590 | $1.46 | 16d | 1 | 1.34mi |
HOA detail
- Monthly dues
- $200 · $2,400/yr
- Likely covers
- poolsecurity
Listing history 32 events
-
2026-06-21days on market $430,000 Active 75 DOM
-
2026-06-18days on market $430,000 Active 72 DOM
-
2026-06-17days on market $430,000 Active 71 DOM
-
2026-06-16days on market $430,000 Active 70 DOM
-
2026-06-15days on market $430,000 Active 69 DOM
-
2026-06-13days on market $430,000 Active 67 DOM
-
2026-06-09days on market $430,000 Active 63 DOM
-
2026-06-08days on market $430,000 Active 62 DOM
-
2026-06-07days on market $430,000 Active 61 DOM
-
2026-06-04days on market $430,000 Active 58 DOM
-
2026-06-03days on market $430,000 Active 57 DOM
-
2026-06-02pricedays on market $430,000 Active 56 DOM
-
2026-06-01days on market $439,900 Active 55 DOM
-
2026-05-31days on market $439,900 Active 54 DOM
-
2026-04-22price $439,900
-
2026-04-07$449,900 Active
-
2021-08-01historical
-
2021-07-29status Active
-
2021-07-24status Pending
-
2021-07-21status Active
-
2021-07-19historical Active Under Contract
-
2021-07-18price $344,500
-
2021-07-17status Active
-
2021-07-11historical Active Under Contract
-
2021-07-09status Active
-
2021-07-04status Pending
-
2021-06-23$349,500 Active
-
2003-01-03soldstatus $148,000
-
2002-12-28soldstatus $148,000 96-char remark
Show marketing remark (96 chars)
ALMOST NEW 3 BEDROOM HOME-TILE IN ALL LIVING AREAS-GATED COMM. COMM. POOL-TILE ROOF-1 CAR GARAGE
-
2002-11-26historical 96-char remark
Show marketing remark (96 chars)
ALMOST NEW 3 BEDROOM HOME-TILE IN ALL LIVING AREAS-GATED COMM. COMM. POOL-TILE ROOF-1 CAR GARAGE
-
2002-11-19$159,900 96-char remark
Show marketing remark (96 chars)
ALMOST NEW 3 BEDROOM HOME-TILE IN ALL LIVING AREAS-GATED COMM. COMM. POOL-TILE ROOF-1 CAR GARAGE
-
2000-03-27soldstatus $1,510,500
ⓘ Source: listings_history table (triggers on properties + properties_extension) + one-shot
backfill from property_details.listing_events for pre-trigger history.
Climate risk First Street
- Flood 1/10 Low FEMA zone X (unshaded) · 0% chance over 30 yrs
- Wildfire 4/10 Moderate
- Heat 10/10 Extreme 7 d/yr ≥107°F today · 25 d/yr by 30 yrs out
- Wind 10/10 Extreme 99% chance of damaging wind over 30 yrs
- Air quality 2/10 Low 0 unhealthy d/yr today · 1 by 30 yrs out
Nearby sold comps map
Loading sold comps map…
Walkable amenities ~0.75 mi
Loading nearby amenities…
Taxation est. · year 1
- Rental income
- $32,643
- − Mortgage interest
- −$24,087
- − Property taxes
- −$6,450
- − Insurance
- −$2,150
- − Repairs & maintenance
- −$2,611
- − Management
- −$2,611
- − HOA
- −$2,400
- − Depreciation
- −$12,509
- Taxable loss
- −$20,176
- Est. tax savings @ 24.0%
- +$4,842
- After-tax cash flow
- $-7,430/yr
For passive investors: Depreciation is non-cash, so a rental often shows a tax loss while cash-flowing — sheltering income. Rental losses are passive: they offset passive income freely, and up to $25,000/yr can offset ordinary (W-2) income if you actively participate and your MAGI is under $100k (phasing out to $0 by $150k); unused losses carry forward. On sale, claimed depreciation is recaptured at up to 25%, and gains may owe capital-gains tax (a 1031 exchange can defer both). Figures are a year-1 estimate at your 24.0% rate — not tax advice; consult a CPA.
Schools (NCES district)
- District
- Palm Beach
- NCES district ID
- 1201500
- Math proficiency
- 46% ▼ -16.00%
- Reading proficiency
- 53% ▼ -4.00%
- Median HH income
- $53,943
- Composite
- 42.72/100
- National rank
- #3160
- State rank
- #34 of 73 in FL
Livability — Royal Palm Beach
- Score
- 79/100
- State rank
- #135
- US rank
- #2039
Category grades
Schools grade is shown separately in the Schools card above.
Census & demographics
- Census place
- Royal Palm Beach, FL
- County
- Palm Beach County · 1,438,312 people
- City population
- 222,012
- Metro
- Miami-Fort Lauderdale-Pompano Beach, FL
- Population (ZIP)
- 76,863
- Household income
- $92,591
- Rent vs Own
- Severe rent burden
- 1870.0
Population outlook (Palm Beach County) Hauer SSP2
- Today (2025)
- 1,637,487 people
- By 2030
- 1,743,255 · +6.5%
- By 2040
- 1,948,712 · +19.0%
- By 2050
- 2,132,979 · +30.3%
- By 2075
- 2,530,027 · +54.5%
- By 2100
- 2,706,979 · +65.3%
Race, ethnicity, and origin ACS 2023
- Neighborhood character
- Diverse neighborhood (Simpson 0.70)
- Race & ethnicity
- White 44% Hispanic / Latino 24% Black 23% Two or more races 16% Asian 5%
- Hispanic origin (detail)
- Mexican 2% Puerto Rican 5% Cuban 4% Dominican 2%
- Common ancestry
- Hispanic 6% Romanian 2% Italian 1%
- Foreign-born
- 26% · Canada, Jamaica, China
- Languages at home
- 73% English-only · Spanish 17% French/Haitian/Cajun 4% Other Indo-European 2%
Political lean MEDSL · Palm Beach
- 2024 margin
- Toss-up / Even · D 50.0% · R 49.2%
- 2008→2024 swing
- -22.1pp toward R · 2008: 22.9pp · 2024: 0.8pp
- All cycles
- 2024: D+0.8 2020: D+12.8 2016: D+15.3 2012: D+17.0 2008: D+22.9
Not yet ingested
- Civics
- —
Market trends
- HPI YoY
- ▲ 17.04%
- Current HPI
- 903.78
- Rent YoY
- ▲ 0.85%
- Metro
- Miami-Fort Lauderdale-Pompano Beach, FL
- State GDP YoY
- ▲ 3.28%
- F500 in state
- 36
Industry mix (Fortune 500 HQ in FL)
| Industry | F500 HQs | Revenue |
|---|---|---|
| Industrial Technology | 2 | $29B |
|
||
| Insurance | 2 | $17B |
|
||
| Retail | 1 | $60B |
|
||
| Technology Distribution | 1 | $58B |
|
||
| Homebuilding | 1 | $35B |
|
||
| Technology Manufacturing | 1 | $35B |
|
||
Price history
-70.9% since first listed18 events — show timeline
- 2026-04-22 Price Changed $439,900 Beaches MLS
- 2026-04-07 Listed $449,900 Beaches MLS
- 2021-08-01 Listing Removed — Beaches MLS
- 2021-07-29 Relisted — Beaches MLS
- 2021-07-24 Pending — Beaches MLS
- 2021-07-21 Relisted — Beaches MLS
- 2021-07-19 Contingent — Beaches MLS
- 2021-07-18 Price Changed $344,500 Beaches MLS
- 2021-07-17 Relisted — Beaches MLS
- 2021-07-11 Contingent — Beaches MLS
- 2021-07-09 Relisted — Beaches MLS
- 2021-07-04 Pending — Beaches MLS
- 2021-06-23 Listed $349,500 Beaches MLS
- 2003-01-03 Sold (Public Records) $148,000 Public Records
- 2002-12-28 Sold (MLS) $148,000 Beaches MLS
- 2002-11-26 Listing Removed — Beaches MLS
- 2002-11-19 Listed $159,900 Beaches MLS
- 2000-03-27 Sold (Public Records) $1,510,500 Public Records
Property tax history
+1.2%/yrLatest (2025): $205 · +5.7% YoY. Source: county tax records.
Cash-flow waterfall
monthlySold comps — $/sqft
last 12 mo · ≤1 miLoading sold comps…