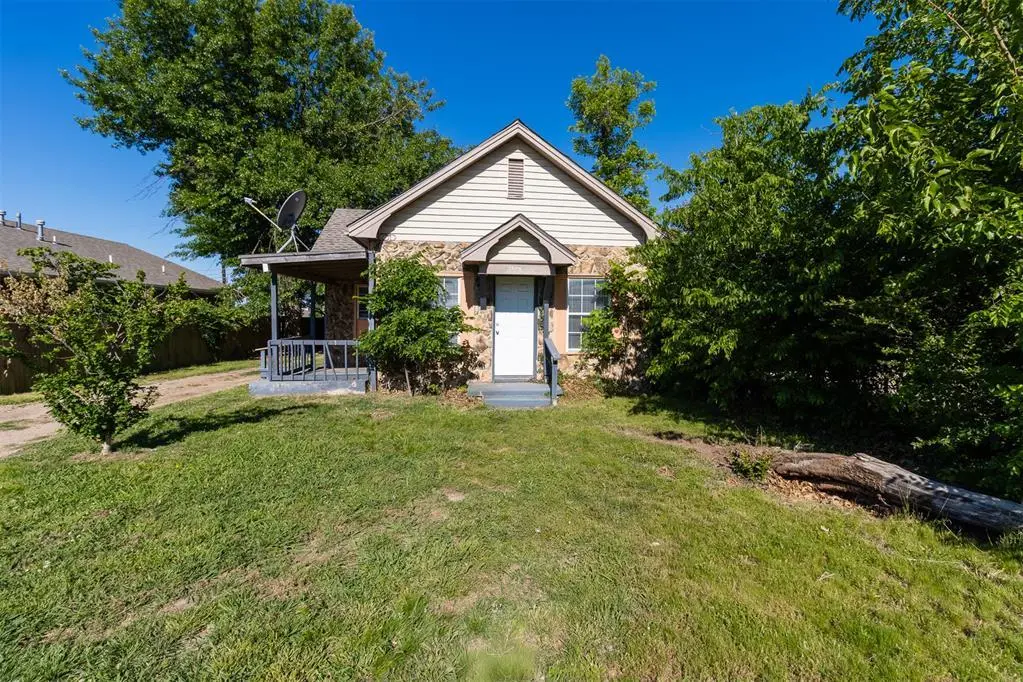
1804 N Louisa Ave · Shawnee, OK
Flood risk 1/10 · Minimal
- FEMA flood zone
- X (unshaded)
- Chance of flooding over 30 yrs
- 0.0%
- Est. flood insurance / yr
- $507 – $1,088
Fire risk 7/10 · Major
- Est. fire insurance / yr
- $2,463 – $4,575
Heat risk 5/10 · Moderate
- Hot days now (above 109°F)
- 7 days/yr
- Hot days in 30 yrs
- 18 days/yr
Wind risk 3/10 · Minor
- Chance of severe wind over 30 yrs
- 5.0%
Air-quality risk 2/10 · Minimal
- Unhealthy air days now
- 1 days/yr
- Unhealthy air days in 30 yrs
- 1 days/yr
Risk factors via First Street. Map © Google.
Why this score? — see what drove the C grade
The composite is a weighted blend of 9 inputs, each scored 0–100. Each bar is that input's sub-score; the figure is the points it added to the 100-point composite (weight × sub-score).
- Cash flow +30.0/30.0
- 1% rule +10.0/10.0
- DSCR +10.0/10.0
- Livability +3.2/5.0
- Rent growth +3.1/5.0
- Condition / age +2.5/5.0
- Schools +1.1/10.0
- ARV discount +0.0/15.0
- Appreciation +0.0/10.0
$61,000
🖨 Deal sheet 📄 Offer letter ✓ Due diligence
Listing remarks MLS
Available investment property in Shawnee! The property conveys as-is, as the seller will not perform any repairs. Being vacant, it's easily available to view. Buyer to verify all information.
Key facts
- Ample natural light
- Generous lot
- Functional layout
Tags
Property features AI
Finance
- Other: Located in the North Lawn addition; Manual geocode; directions available
- Financial info: Not assumable; Loan qualification unknown; Annual tax amount listed (not included per instructions)
- HOA & community: No mandatory association dues
Exterior
- Utilities: No flood insurance requirement indicated
- Home design: Single-family residence; One level; Existing property
- Construction: Brick and frame construction; Shingle roof; Conventional foundation; Built (existing) — year not specified
- Exterior features: No notable exterior features listed; Campus area lot
Interior
- Bedrooms: 1 bedroom
- Bathrooms: 1 full bathroom
- Interior features: One living area; Fireplace (other type); No study; No in-law plan
Neighborhood map
What this means for you Summary
Snapshot
- This is a 2-bed/1.0-bath single-family listed at $61k.
Deal economics
- At list price, monthly cash flow is $401 ($5k/yr) — positive.
- The deal already cash-flows at list — no discount required.
- Meets the 1% rule at list price ($983 rent vs $61k).
- Cap rate 14.2% vs local median 3.9% in Shawnee — top-decile yield for the area; either an underpriced asset or a hidden risk that comps aren't pricing in. Stress-test before assuming the spread holds.
Location & tenants
- Location reads 63/100 on livability (#217 in OK) — a middle-class / working-renter tenant base. Strengths: cost of living A+, housing A+; Watch: crime F, amenities F, commute F.
- Shawnee (town): math 11% / reading 17% proficiency, ranked #238 of 270 in OK (top 88%) — low school quality limits family demand, transient renter base, plan for 1-2y turnover; 70% free/reduced lunch — lower-income household profile, screen leases tightly.
- Zoned schools: Shawnee Ec Ctr (384 students, 0% FRL); Shawnee Hs (math 16% / reading 35%, grade F, #142 of 447 statewide, top 32%, 987 students, 0% FRL) — zoned schools average 0% FRL vs 70% district-wide (70 pts lower); this property's tenant base skews higher-income than the district average.
- Market conditions: Rents rising (+2.5%/yr); 389 active listings in the ZIP; 2 comparable units currently listed for rent nearby; 183 units permitted in Pottawatomie County in 2024 (16 in 5+ unit buildings).
- This rent is only 17% of the median local income ($68k/yr) — well below the 30% rent-burden line; pricing power to push rent on renewal without tenant pushback.
Forward outlook
- Local home prices are declining (-3.0%/yr); year-one equity from $422 of loan paydown is wiped out by about $2k of value loss. Plan a longer hold.
- Pottawatomie County population projected at +12% by 2050 — modest demand growth; plan on rents tracking national, not racing it.
- At projected returns (-3.0% appreciation + 2.5% rent growth), your $17k cash investment doubles in ~5 years — after that, you're playing with house money.
Negotiation context
- Only 9 days on market — expect competitive offers; lowballing is unlikely to land.
- 2 sale attempts with the ask held roughly flat each time — persistent listings suggest the price (not the market) is what's stuck; bring a comps-based counter.
- Current owner paid $36k; list at $61k implies a 69% gain — meaningful room to come down on a strong offer.
Risks & watch-outs
- Watch-outs: built in 1950 — expect roof / HVAC / electrical / plumbing capex.
- Climate carrying-cost: major wildfire risk; extreme-heat days projected 7→18/yr by 2055 (HVAC capex compounding) — expect insurance premiums to compound above CPI over the hold.
Questions for the listing agent
- Built in 1950 — when were the roof, HVAC, electrical panel, plumbing, and water heater last replaced?
- Is there a deadline driving the sale (1031 exchange, divorce, estate, relocation)? That informs how much negotiation room exists.
- Schools are F-rated, which usually means shorter tenancies and higher turnover. Who's the typical renter profile here, and what's been the actual vacancy rate?
- Crime grade is F in this area — have there been break-ins, vandalism, or insurance claims at this property in the last 3 years? What carrier currently insures it and at what premium?
- What's the average days-on-market for RENTAL listings here right now (not sales)? A rising rental-DOM trend means longer vacancies and softer asking-rent achievability than the comps imply.
- What's the recent tenant-quality profile in this submarket — average credit score on applications, eviction rate, late-payment / NSF rate, and stable-employment percentage? A property-management company in the area should have these aggregated.
- How much new for-sale + rental construction is in the pipeline within 1–3 miles? Heavy new supply typically softens prices + rents 12–24 months out; constrained supply supports both.
Investment metrics
- 1% rule
- 1.61% ✓
- Cap rate
- 14.19%
- Cash-on-cash
- 28.20%
- DSCR
- 2.25
- GRM
- 5.2
CMA / ARV
- ARV (on-the-fly)
- $43,896
- Comps found
- 4
Show comp detail 4 sales within ~0.75 mi
| Address | Dist | Beds/Ba | Sqft | Sold | Price | $/sf | Match |
|---|---|---|---|---|---|---|---|
| 1725 N Louisa Ave | 0.07mi | 2/1.0 | 743 (-0%) | 3mo | $43,500 | $59 | 94 |
| 1804 N Louisa Ave | 0.00mi | 1/1.0 (-1) | 744 (0%) | 15mo | $36,000 | $48 | 83 |
| 413 W Burns St | 0.69mi | 2/1.0 | 725 (-3%) | 16mo | $50,000 | $69 | 51 |
| 913 W Franklin St | 0.46mi | 2/1.0 | 852 (+14%) | 13mo | $45,000 | $53 | 44 |
Match score weights: distance 35% · size 25% · config 20% · recency 20%. Top-matched comps best support the ARV.
Projected returns pro-forma
-3.0% appreciation · 2.49% rent growth · sell at horizon
- IRR
- 21.8%
- Equity multiple
- 1.89×
- Total profit
- $15,168
- Equity at exit
- $9,095
- IRR
- 29.6%
- Equity multiple
- 3.58×
- Total profit
- $44,038
- Equity at exit
- $5,274
Cash invested: $17,080 (down + closing). Projections, not guarantees.
Landlord ↔ Tenant lean methodology
- Overall (STATE)
- 83 Strongly Landlord-Friendly
- State Oklahoma
- 83 Strongly Landlord-Friendly · R+20
- County
- — inherits STATE
- City
- — inherits STATE
ZIP-level market 74804
- Home prices YoY
- -25.1%
- Rents YoY
- 2.5%
- Active inventory
- 389
- Price-to-rent
- 5.2×
Monthly cashflow live
- Estimated rent
- $983 medium interval (Pro) →
- Mortgage (P&I)
- −$320
- Tax from tax record
- −$30 /mo · $361/yr
- Insurance
- −$25
- HOA
- −$0
- Vacancy / Maint / Mgmt
- −$207
- Net cashflow
- $401
Break-even live
UW: 25.0% down · 7.5% · 30yr · 1.5% tax · 5.0% vac · 8.0% maint · 8.0% mgmt
Financing live
Cash to close
- Down payment
- $15,250
- Closing costs
- $1,830
- Reserves months
- —
- Total cash needed
- —
Loan-product check · same deal, 3 products live
Conventional
25% down · 7.5% · 30yr
- Down + closing
- —
- Monthly P&I
- —
- Monthly cashflow
- —
- DSCR
- —
- Eligible?
- —
Personal DTI + credit; lowest rate.
DSCR
20% down · 8.5% · 30yr
- Down + closing
- —
- Monthly P&I
- —
- Monthly cashflow
- —
- DSCR
- —
- Eligible?
- —
No personal income docs; deal must DSCR.
Hard money
10% down · 12.0% · 12mo
- Down + closing
- —
- Monthly P&I
- —
- Monthly cashflow
- —
- DSCR
- —
- Eligible?
- —
Short-term bridge; refi at stabilization.
Rent comps 2 comps
| Address | Beds | Baths | Sqft | Rent | $/sqft | DOM | Units | Dist |
|---|---|---|---|---|---|---|---|---|
| 1810 N Harrison St Shawnee, OK | 1.0 | 1.0–1.5 | 675 | $762 | $1.13 | 23d | 2 | 0.94mi |
| 1001 E Independence St Shawnee, OK | 1.0–2.0 | 1.0 | 690 | $900 | $1.30 | 4d | 2 | 1.18mi |
Listing history 8 events
-
2026-06-19days on market $61,000 Active 9 DOM
-
2026-06-18days on market $61,000 Active 8 DOM
-
2026-06-17days on market $61,000 Active 7 DOM
-
2026-06-16days on market $61,000 Active 6 DOM
-
2026-06-15days on market $61,000 Active 5 DOM
-
2026-06-14days on market $61,000 Active 3 DOM
-
2026-06-12remarks 687-char remark
-
2026-06-12$61,000 Active 2 DOM
ⓘ Source: listings_history table (triggers on properties + properties_extension) + one-shot
backfill from property_details.listing_events for pre-trigger history.
Tax reassessment forecast OK · Resets to sale price
- Current annual tax
- $361 · $30/mo
- Projected year-2 tax
- $549 · $46/mo
- Expected delta
- +$188/yr (+$16/mo · 52.1%)
ⓘ Screening estimate from a state-policy table — verify with the county assessor before closing.
Climate risk First Street
- Flood 1/10 Low FEMA zone X (unshaded) · 0% chance over 30 yrs
- Wildfire 7/10 Severe
- Heat 5/10 Major 7 d/yr ≥109°F today · 18 d/yr by 30 yrs out
- Wind 3/10 Moderate 5% chance of damaging wind over 30 yrs
- Air quality 2/10 Low 1 unhealthy d/yr today · 1 by 30 yrs out
Nearby sold comps map
Loading sold comps map…
Walkable amenities ~0.75 mi
Loading nearby amenities…
Taxation est. · year 1
- Rental income
- $11,800
- − Mortgage interest
- −$3,417
- − Property taxes
- −$361
- − Insurance
- −$305
- − Repairs & maintenance
- −$944
- − Management
- −$944
- − Depreciation
- −$1,775
- Taxable income
- $4,055
- Est. tax owed @ 24.0%
- −$973
- After-tax cash flow
- $3,844/yr
For passive investors: Depreciation is non-cash, so a rental often shows a tax loss while cash-flowing — sheltering income. Rental losses are passive: they offset passive income freely, and up to $25,000/yr can offset ordinary (W-2) income if you actively participate and your MAGI is under $100k (phasing out to $0 by $150k); unused losses carry forward. On sale, claimed depreciation is recaptured at up to 25%, and gains may owe capital-gains tax (a 1031 exchange can defer both). Figures are a year-1 estimate at your 24.0% rate — not tax advice; consult a CPA.
Schools (NCES district)
- District
- Shawnee
- NCES district ID
- 4027570
- Math proficiency
- 11% ▼ -10.00%
- Reading proficiency
- 17% ▼ -10.00%
- Median HH income
- $32,128
- Composite
- 11.21/100
- National rank
- #9724
- State rank
- #238 of 270 in OK
Livability — Shawnee
- Score
- 63/100
- State rank
- #217
- US rank
- #15593
Category grades
Schools grade is shown separately in the Schools card above.
Census & demographics
- Census place
- Shawnee, OK
- County
- Pottawatomie County · 45,194 people
- City population
- 45,194
- Metro
- Shawnee, OK
- Population (ZIP)
- 23,227
- Household income
- $67,631
- Rent vs Own
- Severe rent burden
- 442.0
Population outlook (Pottawatomie County) Hauer SSP2
- Today (2025)
- 76,622 people
- By 2030
- 78,816 · +2.9%
- By 2040
- 82,766 · +8.0%
- By 2050
- 86,031 · +12.3%
- By 2075
- 93,316 · +21.8%
- By 2100
- 95,820 · +25.1%
Race, ethnicity, and origin ACS 2023
- Neighborhood character
- Predominantly White (70%)
- Race & ethnicity
- White 70% Two or more races 11% Native American 11% Hispanic / Latino 6% Black 4%
- Hispanic origin (detail)
- Mexican 4%
- Common ancestry
- Slovak 2% Lithuanian 2% Italian 1%
- Foreign-born
- 3% · Canada
- Languages at home
- 96% English-only · Spanish 3%
Political lean MEDSL · Pottawatomie
- 2024 margin
- Solid R (+47.4) · D 25.2% · R 72.7% · Other 2.1%
- 2008→2024 swing
- -9.1pp toward R · 2008: -38.4pp · 2024: -47.4pp
- All cycles
- 2024: R+47.4 2020: R+46.0 2016: R+46.5 2012: R+38.7 2008: R+38.4
Not yet ingested
- Civics
- —
Market trends
- HPI YoY
- ▼ -83.01%
- Current HPI
- 247.115
- Rent YoY
- ▲ 2.49%
- Metro
- Shawnee, OK
- State GDP YoY
- ▲ 1.55%
- F500 in state
- 6
Industry mix (Fortune 500 HQ in OK)
| Industry | F500 HQs | Revenue |
|---|---|---|
| Energy | 3 | $48B |
|
||
Price history
+617.6% since first listed6 events — show timeline
- 2026-06-10 Listed $61,000 MLSOK
- 2025-03-26 Sold (MLS) $36,000 MLSOK
- 2025-02-17 Pending — MLSOK
- 2025-02-05 Listed $44,000 MLSOK
- 1998-09-02 Sold (Public Records) $18,500 Public Records
- 1996-06-21 Sold (Public Records) $8,500 Public Records
Property tax history
+4.7%/yrLatest (2025): $361 · +4.0% YoY. Source: county tax records.
Cash-flow waterfall
monthlySold comps — $/sqft
last 12 mo · ≤1 miLoading sold comps…