7 Lincoln · Cathedral City, CA
Flood risk 5/10 · Moderate
- FEMA flood zone
- X (shaded)
- Chance of flooding over 30 yrs
- 0.52%
- Est. flood insurance / yr
- $507 – $1,088
Fire risk 4/10 · Minor
- Est. fire insurance / yr
- $659 – $1,223
Heat risk 9/10 · Severe
- Hot days now (above 112°F)
- 7 days/yr
- Hot days in 30 yrs
- 21 days/yr
Wind risk 1/10 · Minimal
- Chance of severe wind over 30 yrs
- —
Air-quality risk 5/10 · Moderate
- Unhealthy air days now
- 6 days/yr
- Unhealthy air days in 30 yrs
- 8 days/yr
Risk factors via First Street. Map © Google.
Why this score? — see what drove the B- grade
The composite is a weighted blend of 9 inputs, each scored 0–100. Each bar is that input's sub-score; the figure is the points it added to the 100-point composite (weight × sub-score).
- Cash flow +23.4/30.0
- ARV discount +15.0/15.0
- 1% rule +10.0/10.0
- DSCR +7.5/10.0
- Rent growth +3.3/5.0
- Livability +3.3/5.0
- Schools +2.7/10.0
- Condition / age +2.5/5.0
- Appreciation +0.0/10.0
$119,000
🖨 Deal sheet 📄 Offer letter ✓ Due diligence
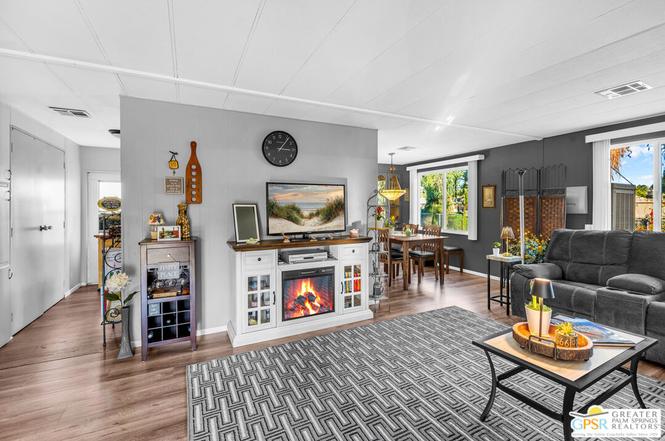
Listing remarks
Stylish Traditional Home in TramView Mobile Home Park. Tucked away on one of the most desirable streets in TramView Mobile Home Park, this upgraded and well-kept 2-bedroom, 2-bath home offers a serene desert retreat with exceptional charm. Located toward the quiet back end of the community, the property enjoys peaceful surroundings, beautifully maintained landscaping, and paved walkways all framed by sweeping mountain views and vistas overlooking Cathedral Canyon Country Club. Inside, the home features updated bathrooms and a refreshed kitchen, complemented by laminated hardwood floors that add warmth and modern appeal. The standout feature is the expansive two-level, covered outdoor deck,
Key facts
- Ground-level pool
- Refreshed kitchen
- Upgraded bathrooms
Tags
Property features AI
Finance
- Other: 230 units in the complex; One shed on the property; Two spaces associated with the listing
- Financial info: Land lease (annual amount listed separately); Rent includes trash collection, water, and pool
- HOA & community: Situated in Tramview Mobile Home Park (senior park); Community amenities include clubhouse, pool, spa, billiard room, card room, meeting room, guest parking, onsite property management, controlled access; Manager approval required for tenancy; Association dues apply (fee listed); Park manager onsite
Exterior
- Parking: Carport with covered parking and attached carport; Driveway; 2 covered parking spaces
- Security: Controlled access (community amenity)
- Utilities: Water service in street; Shared septic
- Home design: Manufactured residential mobile home; Single-story; Faces south / southeast; Aluminum skirt
- Construction: Manufactured by Boise Cascade, model KJ; Manufacture date: 1973; Dimensions approximately 43 x 12
- Exterior features: End unit; Patio home with covered and open patio areas; Sliding glass doors; Workshop; Service entrance; Corner lot; Landscaped lot; Utilities underground; Paved streets with street lighting; Mountain and walk-street views; Community heated in-ground pool (fenced)
Interior
- Kitchen: Dishwasher; Range/oven; Microwave; Hood fan; Garbage disposal; Refrigerator; Freezer; Ice maker; Pantry
- Bedrooms: Not specified
- Flooring: Carpeted floors
- Bathrooms: 2 full bathrooms
- Heating & cooling: Central heat; A/C with central cooling
- Interior features: Furnished or unfurnished available; Double pane windows with screens and blinds; Custom window coverings; Ceiling fan; Gas water heater
- Laundry & utility: Washer and dryer included; Gas or electric dryer hookup; Laundry in unit, community laundry, and laundry in closet
Neighborhood map
What this means for you Summary
Snapshot
- This is a 2-bed/2.0-bath manufactured listed at $119k.
Deal economics
- At list price, monthly cash flow is $220 ($3k/yr) — positive.
- The deal already cash-flows at list — no discount required.
- Meets the 1% rule at list price ($2k rent vs $119k).
- Recommended offer: $105k (12.0% below list) — sets the bar for market timing.
- Cap rate 8.5% vs local median 5.1% in Cathedral City — top-decile yield for the area; either an underpriced asset or a hidden risk that comps aren't pricing in. Stress-test before assuming the spread holds.
Location & tenants
- Location reads 66/100 on livability (#344 in CA) — a middle-class / working-renter tenant base. Strengths: commute A+, housing B+; Watch: employment D+, schools F, amenities D-.
- Palm Springs Unified (suburban): math 21% / reading 42% proficiency, ranked #328 of 517 in CA (top 63%) — families likely to look elsewhere, expect single-tenant / working-renter base with shorter leases; 73% free/reduced lunch — lower-income household profile, screen leases tightly.
- Market conditions: Rents rising (+3.2%/yr); 525 active listings in the ZIP; 40 comparable units currently listed for rent nearby; rentals at typical pace (median 24d on market — plan ~3-4 weeks tenant-placement turnaround); 9,195 units permitted in Riverside County in 2024 (1,512 in 5+ unit buildings).
- This rent runs 40% of the median local income ($74k/yr) — at the standard rent-burdened threshold; future hikes will face affordability resistance.
Forward outlook
- Local home prices are declining (-3.0%/yr); year-one equity from $823 of loan paydown is wiped out by about $4k of value loss. Plan a longer hold.
- Riverside County population projected at +22% by 2050 — long-run rental-demand tailwind backs the buy-and-hold thesis.
Negotiation context
- It's been on market 149 days — a 12% lower offer ($105k) is reasonable based on typical stale-listing flexibility.
- 3 sale attempts since 4y ago; this cycle's ask has dropped $10k (8%) from the opening price — seller is motivated, your offer sets the floor, not the list.
Risks & watch-outs
- Watch-outs: HOA is 37% of rent.
- Climate carrying-cost: moderate flood risk; extreme-heat days projected 7→21/yr by 2055 (HVAC capex compounding) — expect insurance premiums to compound above CPI over the hold.
Questions for the listing agent
- It's been on market 149 days. Have you received any prior offers? Is the seller open to a 12% concession, seller financing, or rate buy-down credit?
- Built in 1973 — when were the roof, HVAC, electrical panel, plumbing, and water heater last replaced?
- What does the HOA fee cover, when was the last increase, and are there any pending special assessments or reserve-fund shortfalls?
- Why hasn't it sold? Are there any deal-killer items the seller is aware of (foundation, flood, title, zoning, code violations)?
- Is there a deadline driving the sale (1031 exchange, divorce, estate, relocation)? That informs how much negotiation room exists.
- Schools are F-rated, which usually means shorter tenancies and higher turnover. Who's the typical renter profile here, and what's been the actual vacancy rate?
- What's the average days-on-market for RENTAL listings here right now (not sales)? A rising rental-DOM trend means longer vacancies and softer asking-rent achievability than the comps imply.
- What's the recent tenant-quality profile in this submarket — average credit score on applications, eviction rate, late-payment / NSF rate, and stable-employment percentage? A property-management company in the area should have these aggregated.
- How much new for-sale + rental construction is in the pipeline within 1–3 miles? Heavy new supply typically softens prices + rents 12–24 months out; constrained supply supports both.
Investment metrics
- 1% rule
- 2.08% ✓
- Cap rate
- 8.51%
- Cash-on-cash
- 7.91%
- DSCR
- 1.35
- GRM
- 4.0
CMA / ARV
- ARV (on-the-fly)
- $174,408
- Comps found
- 10
Show comp detail 10 sales within ~0.75 mi
| Address | Dist | Beds/Ba | Sqft | Sold | Price | $/sf | Match |
|---|---|---|---|---|---|---|---|
| 10 Hayes St | 0.05mi | 2/2.0 | 1,021 (-1%) | 3mo | $67,200 | $66 | 93 |
| 199 Juniper | 0.22mi | 2/2.0 | 1,080 (+5%) | 2mo | $235,000 | $218 | 81 |
| 73 Calle Abajo | 0.24mi | 2/2.0 | 1,020 (-1%) | 10mo | $161,000 | $158 | 79 |
| 3 Coolidge Dr | 0.22mi | 2/2.0 | 1,024 (-1%) | 19mo | $60,000 | $59 | 72 |
| 132 Calle Arriba | 0.33mi | 2/2.0 | 1,056 (+2%) | 16mo | $200,000 | $189 | 67 |
| 270 Encino Dr | 0.32mi | 2/2.0 | 1,120 (+8%) | 8mo | $276,000 | $246 | 64 |
| 36 Club Circle Dr | 0.22mi | 2/2.0 | 1,152 (+12%) | 9mo | $195,000 | $169 | 63 |
| 8 Coolidge Dr | 0.20mi | 2/1.0 | 960 (-7%) | 20mo | $52,000 | $54 | 58 |
| 38 Club Circle Dr | 0.22mi | 2/2.0 | 1,152 (+12%) | 21mo | $264,000 | $229 | 53 |
| 2 Washington St | 0.26mi | 2/1.0 | 900 (-13%) | 20mo | $47,000 | $52 | 46 |
Match score weights: distance 35% · size 25% · config 20% · recency 20%. Top-matched comps best support the ARV.
Projected returns pro-forma
-3.0% appreciation · 3.22% rent growth · sell at horizon
- IRR
- -3.3%
- Equity multiple
- 0.88×
- Total profit
- $-4,145
- Equity at exit
- $17,743
- IRR
- 7.3%
- Equity multiple
- 1.57×
- Total profit
- $19,106
- Equity at exit
- $10,289
Cash invested: $33,320 (down + closing). Projections, not guarantees.
Landlord ↔ Tenant lean methodology
- Overall (STATE)
- 18 Strongly Tenant-Friendly
- State California
- 18 Strongly Tenant-Friendly · D+13
- County
- — inherits STATE
- City
- — inherits STATE
ZIP-level market 92234
- Home prices YoY
- -27.7%
- Rents YoY
- 3.2%
- Active inventory
- 525
- Price-to-rent
- 4.0×
Monthly cashflow live
- Estimated rent
- $2,477 high interval (Pro) →
- Mortgage (P&I)
- −$624
- Tax est. 1.5%
- −$149 /mo · $1,785/yr
- Insurance
- −$50
- HOA
- −$915
- Vacancy / Maint / Mgmt
- −$520
- Net cashflow
- $220
Break-even live
UW: 25.0% down · 7.5% · 30yr · 1.5% tax · 5.0% vac · 8.0% maint · 8.0% mgmt
Financing live
Cash to close
- Down payment
- $29,750
- Closing costs
- $3,570
- Reserves months
- —
- Total cash needed
- —
Loan-product check · same deal, 3 products live
Conventional
25% down · 7.5% · 30yr
- Down + closing
- —
- Monthly P&I
- —
- Monthly cashflow
- —
- DSCR
- —
- Eligible?
- —
Personal DTI + credit; lowest rate.
DSCR
20% down · 8.5% · 30yr
- Down + closing
- —
- Monthly P&I
- —
- Monthly cashflow
- —
- DSCR
- —
- Eligible?
- —
No personal income docs; deal must DSCR.
Hard money
10% down · 12.0% · 12mo
- Down + closing
- —
- Monthly P&I
- —
- Monthly cashflow
- —
- DSCR
- —
- Eligible?
- —
Short-term bridge; refi at stabilization.
Rent comps 40 comps
| Address | Beds | Baths | Sqft | Rent | $/sqft | DOM | Units | Dist |
|---|---|---|---|---|---|---|---|---|
| 26 Pueblo Vista Dr Palm Springs, CA | 3.0 | 2.0 | 1487 | $3,200 | $2.15 | 43d | 1 | 0.51mi |
| 2800 Lawrence Crossley Rd Palm Springs, CA | 2.0 | 2.0 | 905 | $2,022 | $2.23 | 43d | 1 | 0.54mi |
| 2700 Lawrence Crossley Rd Unit B15 Palm Springs, CA | 2.0 | 2.0 | 885 | $1,950 | $2.20 | 43d | 1 | 0.54mi |
| 2700 Lawrence Crossley Rd #18 Palm Springs, CA | 2.0 | 2.0 | 885 | $2,050 | $2.32 | 18d | 1 | 0.54mi |
| 35200 Cathedral Canyon Dr Unit B10 Cathedral City, CA | 2.0 | 2.0 | 1384 | $2,600 | $1.88 | 43d | 1 | 0.59mi |
| 5301 E Waverly Dr Palm Springs, CA | 1.0–2.0 | 2.0 | 933 | $2,300 | $2.47 | 18d | 2 | 0.64mi |
| 5301 E Waverly Dr Palm Springs, CA | 1.0–2.0 | 2.0 | 933 | $2,300 | $2.47 | 14d | 2 | 0.64mi |
| 35200 Cathedral Canyon Dr Unit H64 Cathedral City, CA | 2.0 | 2.0 | 1375 | $2,500 | $1.82 | 43d | 1 | 0.66mi |
| 2010 Lawrence Crossley Rd Unit 8 Palm Springs, CA | 2.0 | 1.5 | 993 | $1,895 | $1.91 | 13d | 1 | 0.67mi |
| 5300 E Waverly Dr Palm Springs, CA | 1.0–2.0 | 1.5–2.0 | 768 | $1,900 | $2.47 | 24d | 2 | 0.70mi |
| 5301 E Waverly Dr #120 Palm Springs, CA | 1.0 | 2.0 | 887 | $2,800 | $3.16 | 43d | 1 | 0.72mi |
| 5301 E Waverly Dr #192 Palm Springs, CA | 2.0 | 2.0 | 979 | $2,300 | $2.35 | 24d | 1 | 0.72mi |
| 36953 Bankside Dr Unit A Cathedral City, CA | 1.0 | 1.0 | 700 | $1,495 | $2.14 | 24d | 1 | 0.74mi |
| 36953 Bankside Dr Unit 5 Cathedral City, CA | 1.0 | 1.0 | 700 | $1,595 | $2.28 | 1d | 1 | 0.74mi |
| 36953 Bankside Dr Unit 10 Cathedral City, CA | 1.0 | 1.0 | 700 | $1,495 | $2.14 | 21d | 1 | 0.74mi |
| 68368 Calle Leon Cathedral City, CA | 2.0 | 2.0 | 1406 | $3,790 | $2.70 | 43d | 1 | 0.75mi |
| 68368 Calle Leon Cathedral City, CA | 2.0 | 2.0 | 1406 | $3,790 | $2.70 | 14d | 1 | 0.75mi |
| 36957 Melrose Dr Unit 7 Cathedral City, CA | 1.0 | 1.0 | 700 | $1,495 | $2.14 | 21d | 1 | 0.77mi |
| 36957 Melrose Dr Unit C Cathedral City, CA | 1.0 | 1.0 | 700 | $1,495 | $2.14 | 24d | 1 | 0.77mi |
| 36947 Melrose Dr Unit 4 Cathedral City, CA | 1.0 | 1.0 | 700 | $1,595 | $2.28 | 24d | 1 | 0.78mi |
| 36947 Melrose Dr Unit 4 Cathedral City, CA | 1.0 | 1.0 | 700 | $1,595 | $2.28 | 2d | 1 | 0.78mi |
| 36947 Melrose Dr Unit D Cathedral City, CA | 1.0 | 1.0 | 700 | $1,595 | $2.28 | 21d | 1 | 0.78mi |
| 34197 Calle Mora Cathedral City, CA | 2.0 | 2.0 | 1171 | $2,300 | $1.96 | 10d | 1 | 0.79mi |
| 34197 Calle Mora Cathedral City, CA | 2.0 | 2.0 | 1171 | $2,300 | $1.96 | 21d | 1 | 0.79mi |
| 34197 Calle Mora Cathedral City, CA | 2.0 | 2.0 | 1171 | $2,300 | $1.96 | 13d | 1 | 0.79mi |
| 5300 E Waverly Dr Unit C4 Palm Springs, CA | 2.0 | 1.5 | 768 | $1,900 | $2.47 | 2d | 1 | 0.79mi |
| 68615 Paseo Soria Cathedral City, CA | 2.0 | 2.0 | 1462 | $3,500 | $2.39 | 7d | 1 | 0.83mi |
| 5225 E Waverly Dr #66 Palm Springs, CA | 1.0 | 2.0 | 887 | $3,600 | $4.06 | 43d | 1 | 0.84mi |
| 68153 Lakeland Dr Cathedral City, CA | 2.0 | 2.0 | 1255 | $2,500 | $1.99 | 24d | 1 | 0.86mi |
| 33892 Sky Blue Water Trl Cathedral City, CA | 3.0 | 2.0 | 1352 | $2,800 | $2.07 | 4d | 1 | 0.91mi |
| 68859 Paseo Real Cathedral City, CA | 2.0 | 2.0 | 1406 | $3,960 | $2.82 | 14d | 1 | 0.92mi |
| 68859 Paseo Real Cathedral City, CA | 2.0 | 2.0 | 1406 | $3,960 | $2.82 | 43d | 1 | 0.92mi |
| 6071 Hazeltine Plz Palm Springs, CA | 2.0 | 2.0 | 1168 | $3,200 | $2.74 | 43d | 1 | 0.98mi |
| 35615 Paseo Circulo E Cathedral City, CA | 1.0 | 2.0 | 1029 | $2,250 | $2.19 | 43d | 1 | 0.99mi |
| 2601 S Broadmoor Dr Palm Springs, CA | 2.0 | 2.0 | 1178 | $2,050 | $1.74 | 43d | 2 | 1.02mi |
| 2441 S Birdie Way Unit E Palm Springs, CA | 2.0 | 2.0 | 1438 | $3,250 | $2.26 | 24d | 1 | 1.07mi |
| 33387 Shifting Sands Trl Unit 2 Cathedral City, CA | 2.0 | 2.0 | 1300 | $1,999 | $1.54 | 24d | 1 | 1.11mi |
| 152 Estrada Way #152 Cathedral City, CA | 2.0 | 2.0 | 1500 | $2,200 | $1.47 | 43d | 1 | 1.14mi |
| 4850 N Winners Cir Unit A Palm Springs, CA | 2.0 | 2.0 | 1275 | $2,700 | $2.12 | 16d | 1 | 1.15mi |
| 2104 S Birdie Way Palm Springs, CA | 3.0 | 2.0 | 1456 | $3,600 | $2.47 | 43d | 1 | 1.15mi |
HOA detail
- Monthly dues
- $915 · $10,980/yr
- Likely covers
- landscaping
Listing history 18 events
-
2026-06-15statusdays on market $119,000 Pending 149 DOM
-
2026-06-13days on market $119,000 Backup Offers Accepted 148 DOM
-
2026-06-13days on market $119,000 Backup Offers Accepted 147 DOM
-
2026-06-09days on market $119,000 Backup Offers Accepted 144 DOM
-
2026-06-08days on market $119,000 Backup Offers Accepted 143 DOM
-
2026-06-07days on market $119,000 Backup Offers Accepted 142 DOM
-
2026-06-04days on market $119,000 Backup Offers Accepted 139 DOM
-
2026-06-03days on market $119,000 Backup Offers Accepted 138 DOM
-
2026-06-02days on market $119,000 Backup Offers Accepted 137 DOM
-
2026-06-01days on market $119,000 Backup Offers Accepted 136 DOM
-
2026-05-31days on market $119,000 Backup Offers Accepted 135 DOM
-
2026-04-20historical Backup Offers Accepted
-
2026-02-21status Active
-
2026-02-21price $119,000
-
2026-02-06historical Backup Offers Accepted
-
2026-01-07$129,500 Active
-
2022-05-11historical
-
2022-05-03$99,000 Active
ⓘ Source: listings_history table (triggers on properties + properties_extension) + one-shot
backfill from property_details.listing_events for pre-trigger history.
Climate risk First Street
- Flood 5/10 Major FEMA zone X (shaded) · 52% chance over 30 yrs
- Wildfire 4/10 Moderate
- Heat 9/10 Extreme 7 d/yr ≥112°F today · 21 d/yr by 30 yrs out
- Wind 1/10 Low
- Air quality 5/10 Major 6 unhealthy d/yr today · 8 by 30 yrs out
Nearby sold comps map
Loading sold comps map…
Walkable amenities ~0.75 mi
Loading nearby amenities…
Taxation est. · year 1
- Rental income
- $29,727
- − Mortgage interest
- −$6,666
- − Property taxes
- −$1,785
- − Insurance
- −$595
- − Repairs & maintenance
- −$2,378
- − Management
- −$2,378
- − HOA
- −$10,980
- − Depreciation
- −$3,462
- Taxable income
- $1,483
- Est. tax owed @ 24.0%
- −$356
- After-tax cash flow
- $2,280/yr
For passive investors: Depreciation is non-cash, so a rental often shows a tax loss while cash-flowing — sheltering income. Rental losses are passive: they offset passive income freely, and up to $25,000/yr can offset ordinary (W-2) income if you actively participate and your MAGI is under $100k (phasing out to $0 by $150k); unused losses carry forward. On sale, claimed depreciation is recaptured at up to 25%, and gains may owe capital-gains tax (a 1031 exchange can defer both). Figures are a year-1 estimate at your 24.0% rate — not tax advice; consult a CPA.
Schools (NCES district)
- District
- Palm Springs Unified
- NCES district ID
- 0629550
- Math proficiency
- 21% ▼ -7.00%
- Reading proficiency
- 42% ▬ 0.00%
- Median HH income
- $43,638
- Composite
- 26.76/100
- National rank
- #7131
- State rank
- #328 of 517 in CA
Livability — Cathedral City
- Score
- 66/100
- State rank
- #344
- US rank
- #11749
Category grades
Schools grade is shown separately in the Schools card above.
Census & demographics
- Census place
- Cathedral City, CA
- County
- Riverside County · 2,287,001 people
- City population
- 52,267
- Metro
- Riverside-San Bernardino-Ontario, CA
- Population (ZIP)
- 52,267
- Household income
- $73,572
- Rent vs Own
- Severe rent burden
- 1682.0
Population outlook (Riverside County) Hauer SSP2
- Today (2025)
- 2,664,475 people
- By 2030
- 2,802,692 · +5.2%
- By 2040
- 3,050,904 · +14.5%
- By 2050
- 3,256,783 · +22.2%
- By 2075
- 3,655,058 · +37.2%
- By 2100
- 3,766,594 · +41.4%
Race, ethnicity, and origin ACS 2023
- Neighborhood character
- Diverse neighborhood (Simpson 0.56)
- Race & ethnicity
- Hispanic / Latino 59% White 30% Two or more races 27% Asian 6% Native American 2% Black 2%
- Hispanic origin (detail)
- Mexican 51%
- Common ancestry
- Lithuanian 2% Romanian 1% Italian 1%
- Foreign-born
- 28% · Canada, Vietnam
- Languages at home
- 48% English-only · Spanish 46% Tagalog/Filipino 3% Other Asian/Pacific 1%
Political lean MEDSL · Riverside
- 2024 margin
- Toss-up / Even · D 48.0% · R 49.3% · Other 2.6%
- 2008→2024 swing
- -3.6pp toward R · 2008: 2.3pp · 2024: -1.3pp
- All cycles
- 2024: R+1.3 2020: D+8.0 2016: D+4.3 2012: R+0.4 2008: D+2.3
Not yet ingested
- Civics
- —
Market trends
- HPI YoY
- ▼ -136.57%
- Current HPI
- 356.9845
- Rent YoY
- ▲ 3.22%
- Metro
- Riverside-San Bernardino-Ontario, CA
- State GDP YoY
- ▲ 3.21%
- F500 in state
- 116
Industry mix (Fortune 500 HQ in CA)
| Industry | F500 HQs | Revenue |
|---|---|---|
| Technology | 27 | $1,492B |
|
||
| Financial Services | 3 | $174B |
|
||
| Retail | 3 | $44B |
|
||
| Insurance | 3 | $26B |
|
||
| Media / Entertainment | 2 | $115B |
|
||
| Pharmaceuticals / Biotech | 2 | $62B |
|
||
Price history
+20.2% since first listed7 events — show timeline
- 2026-04-20 Contingent — TheMLS
- 2026-02-21 Relisted — TheMLS
- 2026-02-21 Price Changed $119,000 TheMLS
- 2026-02-06 Contingent — TheMLS
- 2026-01-07 Listed $129,500 TheMLS
- 2022-05-11 Listing Removed — GPSMLS
- 2022-05-03 Listed $99,000 GPSMLS
Cash-flow waterfall
monthlySold comps — $/sqft
last 12 mo · ≤1 miLoading sold comps…