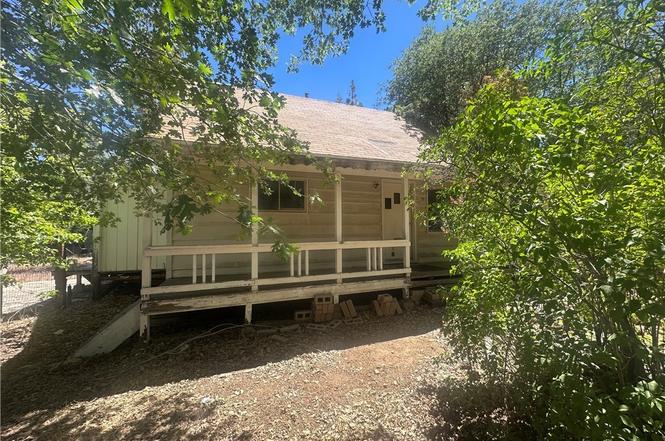
579 Leonard Ln · Big Bear City, CA
Flood risk 1/10 · Minimal
- FEMA flood zone
- D
- Chance of flooding over 30 yrs
- 0.0%
- Est. flood insurance / yr
- $544 – $1,084
Fire risk 7/10 · Major
- Est. fire insurance / yr
- $659 – $1,223
Heat risk 1/10 · Minimal
- Hot days now (above 82°F)
- 11 days/yr
- Hot days in 30 yrs
- 31 days/yr
Wind risk 1/10 · Minimal
- Chance of severe wind over 30 yrs
- —
Air-quality risk 10/10 · Severe
- Unhealthy air days now
- 31 days/yr
- Unhealthy air days in 30 yrs
- 39 days/yr
Risk factors via First Street. Map © Google.
Why this score? — see what drove the C+ grade
The composite is a weighted blend of 9 inputs, each scored 0–100. Each bar is that input's sub-score; the figure is the points it added to the 100-point composite (weight × sub-score).
- Cash flow +26.5/30.0
- DSCR +9.0/10.0
- ARV discount +7.5/15.0
- 1% rule +6.7/10.0
- Schools +2.9/10.0
- Livability +2.6/5.0
- Rent growth +2.5/5.0
- Condition / age +2.5/5.0
- Appreciation +0.0/10.0
$189,000
🖨 Deal sheet 📄 Offer letter ✓ Due diligence
Key facts
- 7,125 sq ft lot
- Built 1960
Neighborhood map
What this means for you Summary
Snapshot
- This is a 3-bed/1.0-bath single-family listed at $189k.
Deal economics
- At list price, monthly cash flow is $498 ($6k/yr) — positive.
- The deal already cash-flows at list — no discount required.
- Meets the 1% rule at list price ($2k rent vs $189k).
- Cap rate 9.5% vs local median 3.3% in Big Bear City — top-decile yield for the area; either an underpriced asset or a hidden risk that comps aren't pricing in. Stress-test before assuming the spread holds.
Location & tenants
- Location reads 52/100 on livability (#988 in CA) — a working-class tenant base; expect higher turnover. Strengths: housing B; Watch: schools D+, crime F, amenities F.
- Bear Valley Unified (town): math 26% / reading 43% proficiency, ranked #289 of 517 in CA (top 56%) — families likely to look elsewhere, expect single-tenant / working-renter base with shorter leases.
- Market conditions: 117 active listings in the ZIP; 19 comparable units currently listed for rent nearby; rentals lingering (median 44d on market — plan ~5-8 weeks vacancy on turnover, expect pricing pressure); 63% of comp listings sitting > 30 days — soft ceiling on asking rent; 5,458 units permitted in San Bernardino County in 2024 (1,500 in 5+ unit buildings).
- At $2,214/mo this rent would consume 52% of the median local household income ($51k/yr) (locally 151% of renters already pay >50% of income on rent) — very limited rent-growth headroom before tenants either downsize or default.
Forward outlook
- Local home prices are declining (-3.0%/yr); year-one equity from $1k of loan paydown is wiped out by about $6k of value loss. Plan a longer hold.
- San Bernardino County population projected at +15% by 2050 — modest demand growth; plan on rents tracking national, not racing it.
- At projected returns (-3.0% appreciation + 3.0% rent growth), your $53k cash investment doubles in ~10 years — after that, you're playing with house money.
Negotiation context
- Only 0 days on market — expect competitive offers; lowballing is unlikely to land.
- Current owner paid $40k; list at $189k implies a 372% gain — meaningful room to come down on a strong offer.
Risks & watch-outs
- Climate carrying-cost: major wildfire risk — expect insurance premiums to compound above CPI over the hold.
Questions for the listing agent
- Built in 1960 — when were the roof, HVAC, electrical panel, plumbing, and water heater last replaced?
- Is there a deadline driving the sale (1031 exchange, divorce, estate, relocation)? That informs how much negotiation room exists.
- Schools are D-rated, which usually means shorter tenancies and higher turnover. Who's the typical renter profile here, and what's been the actual vacancy rate?
- Crime grade is F in this area — have there been break-ins, vandalism, or insurance claims at this property in the last 3 years? What carrier currently insures it and at what premium?
- What's the average days-on-market for RENTAL listings here right now (not sales)? A rising rental-DOM trend means longer vacancies and softer asking-rent achievability than the comps imply.
- What's the recent tenant-quality profile in this submarket — average credit score on applications, eviction rate, late-payment / NSF rate, and stable-employment percentage? A property-management company in the area should have these aggregated.
- How much new for-sale + rental construction is in the pipeline within 1–3 miles? Heavy new supply typically softens prices + rents 12–24 months out; constrained supply supports both.
Investment metrics
- 1% rule
- 1.17% ✓
- Cap rate
- 9.46%
- Cash-on-cash
- 11.30%
- DSCR
- 1.50
- GRM
- 7.1
CMA / ARV
- ARV (on-the-fly)
- $391,300
- Comps found
- 12
Show comp detail 12 sales within ~0.75 mi
| Address | Dist | Beds/Ba | Sqft | Sold | Price | $/sf | Match |
|---|---|---|---|---|---|---|---|
| 682 Leonard Ln | 0.13mi | 3/2.0 | 1,303 (+0%) | 5mo | $370,000 | $284 | 85 |
| 479 Holmes | 0.14mi | 3/2.0 | 1,408 (+8%) | 6mo | $266,000 | $189 | 71 |
| 365 Santa Barbara Ave | 0.48mi | 3/2.0 | 1,320 (+2%) | 3mo | $549,000 | $416 | 68 |
| 713 Los Angeles Ave | 0.26mi | 4/2.5 (+1) | 1,264 (-3%) | 5mo | $430,000 | $340 | 68 |
| 533 Sunset Ln | 0.10mi | 4/2.0 (+1) | 1,424 (+10%) | 4mo | $478,000 | $336 | 67 |
| 510 Sunset Ln | 0.14mi | 2/2.0 (-1) | 1,120 (-14%) | 2mo | $320,000 | $286 | 60 |
| 589 Pine Ln | 0.35mi | 3/2.5 | 1,417 (+9%) | 6mo | $189,000 | $133 | 58 |
| 374 Los Angeles Ave | 0.36mi | 3/2.0 | 1,131 (-13%) | 0mo | $392,700 | $347 | 57 |
| 476 Los Angeles Ave | 0.27mi | 2/2.5 (-1) | 1,464 (+13%) | 6mo | $310,200 | $212 | 50 |
| 244 Moreno Ln | 0.44mi | 2/2.0 (-1) | 1,132 (-13%) | 0mo | $349,000 | $308 | 49 |
| 755 Holmes Ln | 0.22mi | 4/2.5 (+1) | 1,485 (+14%) | 8mo | $306,000 | $206 | 49 |
| 114 Cedar Ln | 0.63mi | 2/2.0 (-1) | 1,112 (-14%) | 2mo | $335,000 | $301 | 36 |
Match score weights: distance 35% · size 25% · config 20% · recency 20%. Top-matched comps best support the ARV.
Projected returns pro-forma
-3.0% appreciation · 3.0% rent growth · sell at horizon
- IRR
- 0.6%
- Equity multiple
- 1.02×
- Total profit
- $1,122
- Equity at exit
- $28,181
- IRR
- 10.2%
- Equity multiple
- 1.79×
- Total profit
- $41,855
- Equity at exit
- $16,341
Cash invested: $52,920 (down + closing). Projections, not guarantees.
Landlord ↔ Tenant lean methodology
- Overall (STATE)
- 18 Strongly Tenant-Friendly
- State California
- 18 Strongly Tenant-Friendly · D+13
- County
- — inherits STATE
- City
- — inherits STATE
ZIP-level market 92386
- Home prices YoY
- -33.0%
- Active inventory
- 117
- Price-to-rent
- 7.1×
Monthly cashflow live
- Estimated rent
- $2,214 high interval (Pro) →
- Mortgage (P&I)
- −$991
- Tax from tax record
- −$180 /mo · $2,164/yr
- Insurance
- −$79
- HOA
- −$0
- Vacancy / Maint / Mgmt
- −$465
- Net cashflow
- $498
Break-even live
UW: 25.0% down · 7.5% · 30yr · 1.5% tax · 5.0% vac · 8.0% maint · 8.0% mgmt
Financing live
Cash to close
- Down payment
- $47,250
- Closing costs
- $5,670
- Reserves months
- —
- Total cash needed
- —
Loan-product check · same deal, 3 products live
Conventional
25% down · 7.5% · 30yr
- Down + closing
- —
- Monthly P&I
- —
- Monthly cashflow
- —
- DSCR
- —
- Eligible?
- —
Personal DTI + credit; lowest rate.
DSCR
20% down · 8.5% · 30yr
- Down + closing
- —
- Monthly P&I
- —
- Monthly cashflow
- —
- DSCR
- —
- Eligible?
- —
No personal income docs; deal must DSCR.
Hard money
10% down · 12.0% · 12mo
- Down + closing
- —
- Monthly P&I
- —
- Monthly cashflow
- —
- DSCR
- —
- Eligible?
- —
Short-term bridge; refi at stabilization.
Rent comps 19 comps
| Address | Beds | Baths | Sqft | Rent | $/sqft | DOM | Units | Dist |
|---|---|---|---|---|---|---|---|---|
| 44634 Barton Ln Sugarloaf, CA | 2.0 | 2.0 | 1079 | $2,150 | $1.99 | 43d | 1 | 0.09mi |
| 790 Highland Ln Sugarloaf, CA | 2.0 | 2.0 | 976 | $2,300 | $2.36 | 43d | 1 | 0.29mi |
| 323 Moreno Ln Sugarloaf, CA | 3.0 | 2.0 | 1404 | $2,200 | $1.57 | 43d | 1 | 0.34mi |
| 531 Santa Barbara Ave Sugarloaf, CA | 2.0 | 1.0 | 900 | $1,800 | $2.00 | 24d | 1 | 0.37mi |
| 870 Holmes Ln Sugarloaf, CA | 2.0 | 2.0 | 987 | $2,000 | $2.03 | 43d | 1 | 0.39mi |
| 336 Spruce Ln Sugarloaf, CA | 2.0 | 1.5 | 896 | $1,799 | $2.01 | 43d | 1 | 0.41mi |
| 855 San Bernardino Ave Sugarloaf, CA | 2.0 | 2.0 | 1322 | $2,200 | $1.66 | 43d | 1 | 0.43mi |
| 231 Riverside Ave Sugarloaf, CA | 2.0 | 1.5 | 1193 | $1,495 | $1.25 | 22d | 1 | 0.51mi |
| 158 Leonard Ln Sugarloaf, CA | 3.0 | 2.0 | 1200 | $2,450 | $2.04 | 18d | 1 | 0.51mi |
| 1336 La Crescenta Dr Big Bear City, CA | 3.0 | 2.0 | 1128 | $2,650 | $2.35 | 43d | 1 | 1.15mi |
| 413 S Marlowe Dr Big Bear City, CA | 4.0 | 2.0 | 1500 | $2,200 | $1.47 | 43d | 1 | 1.19mi |
| 716 Barret Way Big Bear City, CA | 3.0 | 2.5 | 1694 | $1,995 | $1.18 | 43d | 1 | 1.24mi |
| 633 Barret Way Big Bear City, CA | 2.0 | 2.0 | 1120 | $2,450 | $2.19 | 43d | 1 | 1.29mi |
| 43615 Wolf Rd Big Bear Lake, CA | 3.0 | 2.0 | 1588 | $2,850 | $1.79 | 43d | 1 | 1.34mi |
| 43785 Sand Canyon Rd Big Bear Lake, CA | 2.0 | 2.0 | 944 | $2,600 | $2.75 | 43d | 1 | 1.34mi |
| 645 Villa Grove Ave Big Bear Lake, CA | 2.0 | 1.0 | 976 | $2,450 | $2.51 | 24d | 1 | 1.36mi |
| 217 Greenspot Blvd Big Bear City, CA | 3.0 | 2.0 | 1296 | $2,200 | $1.70 | 1d | 1 | 1.36mi |
| 112 Greenspot Blvd Big Bear City, CA | 2.0 | 2.0 | 1193 | $1,795 | $1.50 | 15d | 1 | 1.45mi |
| 300 E Big Bear Blvd Big Bear City, CA | 2.0 | 1.0 | 1008 | $1,450 | $1.44 | 3d | 1 | 1.50mi |
Listing history 1 events
-
2026-06-18$189,000 Pending
ⓘ Source: listings_history table (triggers on properties + properties_extension) + one-shot
backfill from property_details.listing_events for pre-trigger history.
Tax reassessment forecast CA · Resets to sale price
- Current annual tax
- $2,164 · $180/mo
- Projected year-2 tax
- $2,164 · $180/mo
- Expected delta
- $0/yr ($0/mo · 0.0%)
ⓘ Screening estimate from a state-policy table — verify with the county assessor before closing.
Climate risk First Street
- Flood 1/10 Low FEMA zone D · 0% chance over 30 yrs
- Wildfire 7/10 Severe
- Heat 1/10 Low 11 d/yr ≥82°F today · 31 d/yr by 30 yrs out
- Wind 1/10 Low
- Air quality 10/10 Extreme 31 unhealthy d/yr today · 39 by 30 yrs out
Nearby sold comps map
Loading sold comps map…
Walkable amenities ~0.75 mi
Loading nearby amenities…
Taxation est. · year 1
- Rental income
- $26,562
- − Mortgage interest
- −$10,587
- − Property taxes
- −$2,164
- − Insurance
- −$945
- − Repairs & maintenance
- −$2,125
- − Management
- −$2,125
- − Depreciation
- −$5,498
- Taxable income
- $3,119
- Est. tax owed @ 24.0%
- −$748
- After-tax cash flow
- $5,233/yr
For passive investors: Depreciation is non-cash, so a rental often shows a tax loss while cash-flowing — sheltering income. Rental losses are passive: they offset passive income freely, and up to $25,000/yr can offset ordinary (W-2) income if you actively participate and your MAGI is under $100k (phasing out to $0 by $150k); unused losses carry forward. On sale, claimed depreciation is recaptured at up to 25%, and gains may owe capital-gains tax (a 1031 exchange can defer both). Figures are a year-1 estimate at your 24.0% rate — not tax advice; consult a CPA.
Schools (NCES district)
- District
- Bear Valley Unified
- NCES district ID
- 0604230
- Math proficiency
- 26% ▼ -4.00%
- Reading proficiency
- 43% ▼ -4.00%
- Median HH income
- $42,222
- Composite
- 29.12/100
- National rank
- #6588
- State rank
- #289 of 517 in CA
Livability — Big Bear City
- Score
- 52/100
- State rank
- #988
- US rank
- #24706
Category grades
Schools grade is shown separately in the Schools card above.
Census & demographics
- Census place
- Big Bear City, CA
- County
- San Bernardino County · 2,030,291 people
- City population
- 9,334
- Metro
- Riverside-San Bernardino-Ontario, CA
- Population (ZIP)
- 2,042
- Household income
- $50,694
- Rent vs Own
- Severe rent burden
- 151.0
Population outlook (San Bernardino County) Hauer SSP2
- Today (2025)
- 2,300,329 people
- By 2030
- 2,378,907 · +3.4%
- By 2040
- 2,523,137 · +9.7%
- By 2050
- 2,642,388 · +14.9%
- By 2075
- 2,880,769 · +25.2%
- By 2100
- 2,909,436 · +26.5%
Race, ethnicity, and origin ACS 2023
- Neighborhood character
- Predominantly White (78%)
- Race & ethnicity
- White 78% Hispanic / Latino 11% Two or more races 6% Black 6% Asian 3% Native American 1%
- Hispanic origin (detail)
- Mexican 7%
- Common ancestry
- Romanian 7% Russian 4% Portuguese 2%
- Foreign-born
- 5%
- Languages at home
- 92% English-only · Other Asian/Pacific 3% Arabic 2%
Political lean MEDSL · San Bernardino
- 2024 margin
- Toss-up / Even · D 47.5% · R 49.7% · Other 2.8%
- 2008→2024 swing
- -8.5pp toward R · 2008: 6.3pp · 2024: -2.1pp
- All cycles
- 2024: R+2.1 2020: D+10.7 2016: D+9.8 2012: D+5.4 2008: D+6.3
Not yet ingested
- Civics
- —
Market trends
- HPI YoY
- ▼ -198.95%
- Current HPI
- 404.3928
- Rent YoY
- —
- Metro
- Riverside-San Bernardino-Ontario, CA
- State GDP YoY
- ▲ 3.21%
- F500 in state
- 116
Industry mix (Fortune 500 HQ in CA)
| Industry | F500 HQs | Revenue |
|---|---|---|
| Technology | 27 | $1,492B |
|
||
| Financial Services | 3 | $174B |
|
||
| Retail | 3 | $44B |
|
||
| Insurance | 3 | $26B |
|
||
| Media / Entertainment | 2 | $115B |
|
||
| Pharmaceuticals / Biotech | 2 | $62B |
|
||
Price history
+203.9% since first listed4 events — show timeline
- 2026-06-18 Delisted — MRCAOR
- 2026-06-17 Listed $189,000 MRCAOR
- 1988-10-28 Sold (Public Records) $40,000 Public Records
- 1985-05-01 Sold (Public Records) $62,200 Public Records
Property tax history
+2.9%/yrLatest (2025): $2,164 · +5.6% YoY. Source: county tax records.
Cash-flow waterfall
monthlySold comps — $/sqft
last 12 mo · ≤1 miLoading sold comps…