950 S Kanner Hwy · Stuart, FL
Flood risk 7/10 · Major
- FEMA flood zone
- X (shaded)
- Chance of flooding over 30 yrs
- 0.91%
- Est. flood insurance / yr
- $507 – $1,088
Fire risk 1/10 · Minimal
- Est. fire insurance / yr
- $947 – $1,759
Heat risk 10/10 · Severe
- Hot days now (above 106°F)
- 7 days/yr
- Hot days in 30 yrs
- 27 days/yr
Wind risk 10/10 · Severe
- Chance of severe wind over 30 yrs
- 99.0%
Air-quality risk 2/10 · Minimal
- Unhealthy air days now
- 1 days/yr
- Unhealthy air days in 30 yrs
- 1 days/yr
Risk factors via First Street. Map © Google.
Why this score? — see what drove the B- grade
The composite is a weighted blend of 9 inputs, each scored 0–100. Each bar is that input's sub-score; the figure is the points it added to the 100-point composite (weight × sub-score).
- Cash flow +24.4/30.0
- ARV discount +15.0/15.0
- DSCR +7.9/10.0
- 1% rule +6.3/10.0
- Schools +4.5/10.0
- Livability +4.2/5.0
- Condition / age +3.8/5.0
- Rent growth +2.3/5.0
- Appreciation +0.0/10.0
$212,995
🖨 Deal sheet (PDF) 📄 Offer letter ✓ Due diligence
Listing remarks
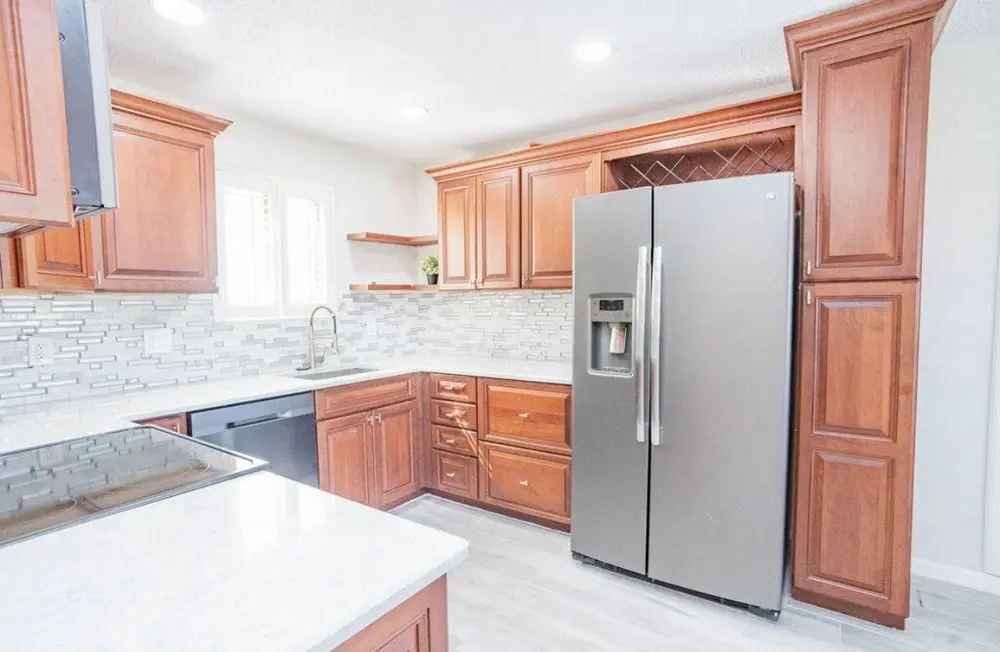
Comfort and convenience in downtown Staurt! This 2 bed, 3 bath townhouse, with oversized porch is exactly what you've been looking for. Renovated kitchen with top-of-the-line Brazilian cherry custom cabinets and quartz counter tops. The community offers two clubhouses, resort style pools, Kayak storage/launch, bike storage and so much more. HOA fee include water, Cable and Wifi! Hurry up, it's time to come home!!
Key facts
- Resort style pools
- Oversized porch
- Two clubhouses
Tags
Neighborhood map
What this means for you Summary
Snapshot
- This is a 2-bed/2.5-bath townhouse listed at $213k. Condition is rated good.
Deal economics
- At list price, monthly cash flow is $367 ($4k/yr) — positive.
- The deal already cash-flows at list — no discount required.
- Meets the 1% rule at list price ($2k rent vs $213k).
- Recommended offer: $210k (1.5% below list) — sets the bar for market timing.
- Cap rate 8.7% vs local median 3.5% in Stuart — top-decile yield for the area; either an underpriced asset or a hidden risk that comps aren't pricing in. Stress-test before assuming the spread holds.
Location & tenants
- Location reads 84/100 on livability (#39 in FL, #790 nationally) — a professional / high-income tenant draw. Strengths: commute A+, housing A+, health & safety A+; Watch: crime C-, employment C-, amenities D.
- Martin (suburban): math 52% / reading 53% proficiency, ranked #24 of 73 in FL (top 33%) — acceptable for families but not a draw, mixed tenant base, ~2y average lease.
- Zoned schools: J. D. Parker School of Technology (math 39% / reading 40%, grade F, #1,513 of 2,144 statewide, top 73%, 519 students, 72% FRL); Stuart Middle School (math 55% / reading 55%, grade B-, #180 of 571 statewide, top 32%, 867 students, 49% FRL); Jensen Beach High School (math 53% / reading 71%, grade B-, #98 of 667 statewide, top 15%, 1,584 students, 36% FRL).
- Market conditions: Rents soft (-0.7%/yr); 259 active listings in the ZIP; 32 comparable units currently listed for rent nearby; rentals at typical pace (median 25d on market — plan ~3-4 weeks tenant-placement turnaround); 737 units permitted in Martin County in 2024 (167 in 5+ unit buildings).
- At $2,412/mo this rent would consume 46% of the median local household income ($63k/yr) (locally 1408% of renters already pay >50% of income on rent) — very limited rent-growth headroom before tenants either downsize or default.
Forward outlook
- Local home prices are declining (-3.0%/yr); year-one equity from $1k of loan paydown is wiped out by about $6k of value loss. Plan a longer hold.
- Martin County population projected at +19% by 2050 — long-run rental-demand tailwind backs the buy-and-hold thesis.
Negotiation context
- It's been on market 17 days — a 2% lower offer ($210k) is reasonable based on typical stale-listing flexibility.
- 27 sale attempts since 23y ago with the ask held roughly flat each time — persistent listings suggest the price (not the market) is what's stuck; bring a comps-based counter.
- Current owner paid $92k; list at $213k implies a 132% gain — meaningful room to come down on a strong offer.
Risks & watch-outs
- Watch-outs: flood insurance adds $66/mo.
- Climate carrying-cost: major flood risk; severe wind risk, 99% chance of damaging wind over 30y; extreme-heat days projected 7→27/yr by 2055 (HVAC capex compounding) — expect insurance premiums to compound above CPI over the hold.
Questions for the listing agent
- What's the actual annual flood-insurance premium (NFIP or private), and is the property in a SFHA with mandatory coverage?
- Is there a deadline driving the sale (1031 exchange, divorce, estate, relocation)? That informs how much negotiation room exists.
- Schools are A-rated — typically a magnet for longer-tenancy family renters. What's the average tenant stay here, and is there a school-zone premium baked into asking?
- What's the average days-on-market for RENTAL listings here right now (not sales)? A rising rental-DOM trend means longer vacancies and softer asking-rent achievability than the comps imply.
- What's the recent tenant-quality profile in this submarket — average credit score on applications, eviction rate, late-payment / NSF rate, and stable-employment percentage? A property-management company in the area should have these aggregated.
- How much new for-sale + rental construction is in the pipeline within 1–3 miles? Heavy new supply typically softens prices + rents 12–24 months out; constrained supply supports both.
Investment metrics
- 1% rule
- 1.13% ✓
- Cap rate
- 8.74%
- Cash-on-cash
- 8.72%
- DSCR
- 1.39
- GRM
- 7.4
CMA / ARV
- ARV (on-the-fly)
- $325,000
- Comps found
- 12
Show comp detail 12 sales within ~0.75 mi
| Address | Dist | Beds/Ba | Sqft | Sold | Price | $/sf | Match |
|---|---|---|---|---|---|---|---|
| 950 S Kanner Hwy Unit TH138 | 0.06mi | 2/2.5 | 1,250 (0%) | 2mo | $209,000 | $167 | 96 |
| 950 S Kanner Hwy #101 | 0.08mi | 2/2.0 | 1,164 (-7%) | 3mo | $305,000 | $262 | 80 |
| 1831 SW Palm City Rd Unit C501 | 0.54mi | 2/2.0 | 1,188 (-5%) | 3mo | $210,000 | $177 | 62 |
| 1852 SW Palm City Rd #202 | 0.67mi | 2/2.0 | 1,191 (-5%) | 4mo | $200,000 | $168 | 56 |
| 1866 SW Palm City Rd #107 | 0.74mi | 2/2.0 | 1,191 (-5%) | 2mo | $296,500 | $249 | 54 |
| 1866 SW Palm City Rd #202 | 0.74mi | 2/2.0 | 1,187 (-5%) | 3mo | $321,000 | $270 | 53 |
| 1864 SW Palm City Rd #204 | 0.73mi | 2/2.0 | 1,191 (-5%) | 4mo | $310,000 | $260 | 53 |
| 1866 SW Palm City Rd #101 | 0.74mi | 2/2.0 | 1,191 (-5%) | 5mo | $310,000 | $260 | 52 |
| 1866 SW Palm City Rd #201 | 0.74mi | 2/2.0 | 1,191 (-5%) | 5mo | $340,000 | $285 | 52 |
| 1862 SW Palm City Rd #206 | 0.71mi | 2/2.0 | 1,191 (-5%) | 8mo | $250,000 | $210 | 51 |
| 41 SW Seminole St #208 | 0.69mi | 2/2.0 | 1,377 (+10%) | 1mo | $1,100,000 | $799 | 48 |
| 40 SE Sedona Cir #104 | 0.72mi | 3/2.0 (+1) | 1,157 (-7%) | 1mo | $265,000 | $229 | 46 |
Match score weights: distance 35% · size 25% · config 20% · recency 20%. Top-matched comps best support the ARV.
Projected returns pro-forma
-3.0% appreciation · 0.0% rent growth · sell at horizon
- IRR
- -8.5%
- Equity multiple
- 0.70×
- Total profit
- $-18,130
- Equity at exit
- $31,758
- IRR
- -3.7%
- Equity multiple
- 0.79×
- Total profit
- $-12,690
- Equity at exit
- $18,416
Cash invested: $59,639 (down + closing). Projections, not guarantees.
Landlord ↔ Tenant lean methodology
- Overall (STATE)
- 87 Strongly Landlord-Friendly
- State Florida
- 87 Strongly Landlord-Friendly · R+3
- County
- — inherits STATE
- City
- — inherits STATE
ZIP-level market 34994
- Home prices YoY
- -27.1%
- Rents YoY
- -0.7%
- Active inventory
- 259
- Price-to-rent
- 7.4×
Monthly cashflow live
- Estimated rent
- $2,412 high interval (Pro) →
- Mortgage (P&I)
- −$1,117
- Tax est. 1.5%
- −$266 /mo · $3,195/yr
- Insurance
- −$89
- Flood insurance flood zone
- −$66 /mo · $798/yr
- HOA
- −$0
- Vacancy / Maint / Mgmt
- −$507
- Net cashflow
- $367
Break-even live
Sensitivity live
| Price | -10% $514 | -5% $441 | +0% $367 | +5% $293 | +10% $220 |
|---|---|---|---|---|---|
| Rent | -10% $176 | -5% $272 | +0% $367 | +5% $462 | +10% $558 |
| Rate | -1.0pp $474 | -0.5pp $421 | base $367 | +0.5pp $312 | +1.0pp $256 |
UW: 25.0% down · 7.5% · 30yr · 1.5% tax · 5.0% vac · 8.0% maint · 8.0% mgmt
Financing live
Cash to close
- Down payment
- $53,249
- Closing costs
- $6,390
- Reserves months
- —
- Total cash needed
- —
Loan-product check · same deal, 3 products live
Conventional
25% down · 7.5% · 30yr
- Down + closing
- —
- Monthly P&I
- —
- Monthly cashflow
- —
- DSCR
- —
- Eligible?
- —
Personal DTI + credit; lowest rate.
DSCR
20% down · 8.5% · 30yr
- Down + closing
- —
- Monthly P&I
- —
- Monthly cashflow
- —
- DSCR
- —
- Eligible?
- —
No personal income docs; deal must DSCR.
Hard money
10% down · 12.0% · 12mo
- Down + closing
- —
- Monthly P&I
- —
- Monthly cashflow
- —
- DSCR
- —
- Eligible?
- —
Short-term bridge; refi at stabilization.
Rent comps 32 comps
| Address | Beds | Baths | Sqft | Rent | $/sqft | DOM | Units | Dist |
|---|---|---|---|---|---|---|---|---|
| 950 S Kanner Hwy Stuart, FL | 1.0–2.0 | 1.0–2.5 | 1062 | $2,000 | $1.88 | 25d | 5 | 0.01mi |
| 950 S Kanner Hwy Stuart, FL | 1.0–2.0 | 1.0–2.0 | 850 | $2,000 | $2.35 | 15d | 4 | 0.01mi |
| 950 S Kanner Hwy Stuart, FL | 2.0 | 2.0 | 1019 | $1,888 | $1.85 | 23d | 3 | 0.01mi |
| 701 SW Bryant Ave Stuart, FL | 2.0 | 1.0 | 1295 | $3,300 | $2.55 | 15d | 1 | 0.33mi |
| 801 SE Central Ave Stuart, FL | 3.0 | 1.0 | 899 | $2,300 | $2.56 | 15d | 1 | 0.49mi |
| 1871 SW Palm City Rd Unit G401 Stuart, FL | 3.0 | 2.0 | 1289 | $2,200 | $1.71 | 25d | 1 | 0.53mi |
| 514 SW North Carolina Dr Stuart, FL | 3.0 | 2.0 | 1836 | $3,695 | $2.01 | 15d | 1 | 0.54mi |
| 85 SE Hancock St Stuart, FL | 1.0–2.0 | 1.0–2.0 | 1278 | $2,300 | $1.80 | 15d | 2 | 0.56mi |
| 310 SE Denver Ave Unit 2 Stuart, FL | 2.0 | 2.0 | 1300 | $2,900 | $2.23 | 15d | 1 | 0.58mi |
| 1900 S Kanner Hwy Unit 2-203 Stuart, FL | 2.0 | 2.0 | 1086 | $1,800 | $1.66 | 15d | 1 | 0.60mi |
| 201 SW Joan Jefferson Way Stuart, FL | 2.0–3.0 | 2.0 | 1400 | $2,545 | $1.82 | 15d | 10 | 0.65mi |
| 47 SW Osceola St #206 Stuart, FL | 2.0 | 2.0 | 1276 | $4,000 | $3.13 | 25d | 1 | 0.66mi |
| 47 SW Osceola St Unit UN206 Stuart, FL | 2.0 | 2.0 | 1276 | $3,900 | $3.06 | 25d | 1 | 0.66mi |
| 41 SW Seminole St Stuart, FL | 3.0 | 1.0–2.5 | 1353 | $13,167 | $9.73 | 25d | 3 | 0.69mi |
| 40 SE Sedona Cir #103 Stuart, FL | 3.0 | 2.5 | 1671 | $3,800 | $2.27 | 25d | 1 | 0.73mi |
| 400 SE Central Pkwy Stuart, FL | 1.0–2.0 | 1.0–2.0 | 918 | $2,640 | $2.87 | 15d | 16 | 0.74mi |
| 1868 SW Palm City Rd Apt 202 Stuart, FL | 2.0 | 2.0 | 1191 | $2,900 | $2.43 | 25d | 1 | 0.75mi |
| 345 SE Angler Dr Stuart, FL | 3.0 | 2.5 | 1475 | $2,650 | $1.80 | 23d | 1 | 0.79mi |
| 1950 SW Palm City Rd Unit 4-4205 Stuart, FL | 2.0 | 2.0 | 938 | $2,400 | $2.56 | 15d | 1 | 0.83mi |
| 1950 SW Palm City Rd Stuart, FL | 2.0 | 2.0 | 1031 | $3,150 | $3.05 | 25d | 3 | 0.84mi |
| 44 SE Sedona Cir #201 Stuart, FL | 3.0 | 2.0 | 1443 | $2,200 | $1.52 | 25d | 1 | 0.87mi |
| 47 SE Sedona Cir #203 Stuart, FL | 3.0 | 2.5 | 1450 | $2,200 | $1.52 | 25d | 1 | 0.87mi |
| 801 SE Central Pkwy #7 Stuart, FL | 2.0 | 2.0 | 1046 | $2,150 | $2.06 | 15d | 1 | 1.04mi |
| 2600 S Kanner Hwy Stuart, FL | 1.0–2.0 | 1.5–2.0 | 890 | $1,950 | $2.19 | 15d | 3 | 1.15mi |
| 1634 SW Crossing Cir Palm City, FL | 2.0 | 1.5 | 1258 | $2,200 | $1.75 | 25d | 1 | 1.28mi |
| 217 SE Coconut Ave Stuart, FL | 2.0 | 1.0 | 1197 | $5,000 | $4.18 | 25d | 1 | 1.29mi |
| 215 NW Flagler Ave #202 Stuart, FL | 2.0 | 2.0 | 1182 | $2,500 | $2.12 | 25d | 1 | 1.32mi |
| 275 NW Flagler Ave #204 Stuart, FL | 3.0 | 2.0 | 1391 | $6,500 | $4.67 | 25d | 1 | 1.35mi |
| 275 NW Flagler Ave #205 Stuart, FL | 2.0 | 2.0 | 1183 | $2,800 | $2.37 | 25d | 1 | 1.35mi |
| 415 NW Flagler Ave #403 Stuart, FL | 2.0 | 2.0 | 1082 | $3,000 | $2.77 | 25d | 1 | 1.44mi |
| 2819 SW Cornell Ave Palm City, FL | 2.0 | 1.5 | 1060 | $2,150 | $2.03 | 23d | 1 | 1.48mi |
| 2118 SE Edler Dr Unit B Stuart, FL | 2.0 | 2.0 | 876 | $1,995 | $2.28 | 25d | 1 | 1.50mi |
Listing history 12 events
-
2026-06-21days on market $212,995 Active 17 DOM
-
2026-06-18days on market $212,995 Active 14 DOM
-
2026-06-17days on market $212,995 Active 13 DOM
-
2026-06-16days on market $212,995 Active 12 DOM
-
2026-06-15days on market $212,995 Active 11 DOM
-
2026-06-14days on market $212,995 Active 9 DOM
-
2026-06-13days on market $212,995 Active 8 DOM
-
2026-06-10days on market $212,995 Active 6 DOM
-
2026-06-09days on market $212,995 Active 5 DOM
-
2026-06-08days on market $212,995 Active 4 DOM
-
2026-06-07remarks 416-char remark
-
2026-06-07$212,995 Active 3 DOM
ⓘ Source: listings_history table (triggers on properties + properties_extension) + one-shot
backfill from property_details.listing_events for pre-trigger history.
Climate risk First Street
- Flood 7/10 Severe FEMA zone X (shaded) · 91% chance over 30 yrs
- Wildfire 1/10 Low
- Heat 10/10 Extreme 7 d/yr ≥106°F today · 27 d/yr by 30 yrs out
- Wind 10/10 Extreme 99% chance of damaging wind over 30 yrs
- Air quality 2/10 Low 1 unhealthy d/yr today · 1 by 30 yrs out
Nearby sold comps map
Loading sold comps map…
Walkable amenities ~0.75 mi
Loading nearby amenities…
Taxation est. · year 1
- Rental income
- $28,943
- − Mortgage interest
- −$11,931
- − Property taxes
- −$3,195
- − Insurance
- −$1,862
- − Repairs & maintenance
- −$2,315
- − Management
- −$2,315
- − Depreciation
- −$6,196
- Taxable income
- $1,128
- Est. tax owed @ 24.0%
- −$271
- After-tax cash flow
- $4,134/yr
For passive investors: Depreciation is non-cash, so a rental often shows a tax loss while cash-flowing — sheltering income. Rental losses are passive: they offset passive income freely, and up to $25,000/yr can offset ordinary (W-2) income if you actively participate and your MAGI is under $100k (phasing out to $0 by $150k); unused losses carry forward. On sale, claimed depreciation is recaptured at up to 25%, and gains may owe capital-gains tax (a 1031 exchange can defer both). Figures are a year-1 estimate at your 24.0% rate — not tax advice; consult a CPA.
Condition & rehab AI · 10 photos
This well-maintained townhouse is move-in ready with a fresh paint job and modern updates, making it an attractive option for both resale and rental.
Value-add opportunities
- Both landscaping — enhances curb appeal and adds value
- Both paint exterior walls — improves curb appeal and adds value
- Both install new flooring — modernizes the space and adds value
Renovation cost estimate screening
Value-add ROI direction
- Both landscaping — enhances curb appeal and adds value ↑
- Both paint exterior walls — improves curb appeal and adds value ↑
- Both install new flooring — modernizes the space and adds value ↑
ⓘ Cost ranges are severity-bucket heuristics (US national rule-of-thumb). Get contractor quotes + a written scope before underwriting a rehab budget.
Schools (NCES district)
- District
- Martin
- NCES district ID
- 1201290
- Math proficiency
- 52% ▼ -14.00%
- Reading proficiency
- 53% ▼ -4.00%
- Median HH income
- $52,482
- Composite
- 45.1/100
- National rank
- #2690
- State rank
- #24 of 73 in FL
Livability — Stuart
- Score
- 84/100
- State rank
- #39
- US rank
- #790
Category grades
Schools grade is shown separately in the Schools card above.
Census & demographics
- Census place
- Stuart, FL
- County
- Martin County · 165,223 people
- City population
- 65,812
- Metro
- Port St. Lucie, FL
- Population (ZIP)
- 18,737
- Household income
- $62,533
- Rent vs Own
- Severe rent burden
- 1408.0
Population outlook (Martin County) Hauer SSP2
- Today (2025)
- 172,383 people
- By 2030
- 180,192 · +4.5%
- By 2040
- 194,114 · +12.6%
- By 2050
- 204,992 · +18.9%
- By 2075
- 229,641 · +33.2%
- By 2100
- 232,146 · +34.7%
Race, ethnicity, and origin ACS 2023
- Neighborhood character
- Majority White (65%)
- Race & ethnicity
- White 65% Hispanic / Latino 21% Two or more races 12% Black 11%
- Hispanic origin (detail)
- Mexican 6% Puerto Rican 5% Cuban 1%
- Common ancestry
- Romanian 5% Lithuanian 3% Slovak 2%
- Foreign-born
- 12% · Canada
- Languages at home
- 80% English-only · Spanish 16% Russian/Polish/Slavic 2% Other Indo-European 1%
Political lean MEDSL · Martin
- 2024 margin
- Solid R (+31.1) · D 34.1% · R 65.2%
- 2008→2024 swing
- -17.5pp toward R · 2008: -13.6pp · 2024: -31.1pp
- All cycles
- 2024: R+31.1 2020: R+24.6 2016: R+26.9 2012: R+22.9 2008: R+13.6
Not yet ingested
- Civics
- —
Market trends
- HPI YoY
- ▼ -130.08%
- Current HPI
- 349.7061
- Rent YoY
- ▼ -0.69%
- Metro
- Port St. Lucie, FL
- State GDP YoY
- ▲ 3.28%
- F500 in state
- 36
Industry mix (Fortune 500 HQ in FL)
| Industry | F500 HQs | Revenue |
|---|---|---|
| Industrial Technology | 2 | $29B |
|
||
| Insurance | 2 | $17B |
|
||
| Retail | 1 | $60B |
|
||
| Technology Distribution | 1 | $58B |
|
||
| Homebuilding | 1 | $35B |
|
||
| Technology Manufacturing | 1 | $35B |
|
||
Price history
+124.2% since first listed61 events — show timeline
- 2026-06-04 Listed $212,995 ForSaleByOwner.com
- 2026-06-03 Listed for Rent $1,800 APPFOLIO
- 2026-05-29 Rental Removed $1,800 SHOWMOJO
- 2026-05-23 Rental Removed $1,800 APPFOLIO
- 2026-05-20 Listed for Rent $1,800 SHOWMOJO
- 2026-03-05 Listed for Rent $1,800 APPFOLIO
- 2026-02-26 Rental Removed $1,800 APPFOLIO
- 2026-02-06 Listed for Rent $1,800 APPFOLIO
- 2025-07-25 Rental Removed $1,800 APPFOLIO
- 2025-05-25 Listed for Rent $1,800 APPFOLIO
- 2024-12-22 Rental Removed $1,700 APPFOLIO
- 2024-12-05 Rental Removed $1,700 SHOWMOJO
- 2024-11-07 Listed for Rent $1,700 APPFOLIO
- 2024-11-05 Listed for Rent $1,495 SHOWMOJO
- 2024-09-27 Listing Removed — Beaches MLS
- 2024-09-11 Rental Removed $1,700 APPFOLIO
- 2024-08-29 Listed for Rent $1,700 APPFOLIO
- 2024-07-26 Listed $300,000 Beaches MLS
- 2016-06-26 Listing Removed — MCRTC
- 2016-06-26 Listing Removed — MCRTC
- 2016-06-26 Listing Removed — MCRTC
- 2016-06-26 Listing Removed — MCRTC
- 2016-04-28 Price Changed $95,000 MCRTC
- 2016-01-11 Price Changed $92,000 MCRTC
- 2016-01-11 Price Changed $94,000 MCRTC
- 2014-12-19 Price Changed $96,000 MCRTC
- 2014-12-19 Sold (MLS) $92,000 MCRTC
- 2014-12-05 Price Changed $109,000 MCRTC
- 2014-12-05 Sold (MLS) $95,000 MCRTC
- 2014-11-13 Listed $109,000 MCRTC
- 2014-10-15 Listing Removed — Beaches MLS
- 2014-10-13 Listing Removed — Beaches MLS
- 2014-09-12 Sold (MLS) $67,500 Beaches MLS
- 2014-09-05 Sold (MLS) $94,000 MCRTC
- 2014-09-05 Price Changed $96,000 MCRTC
- 2014-08-26 Listed $96,000 MCRTC
- 2014-08-21 Listing Removed — Beaches MLS
- 2014-07-02 Listed $96,000 MCRTC
- 2014-05-27 Listing Removed — Beaches MLS
- 2014-05-19 Listed $72,000 Beaches MLS
- 2010-10-29 Sold (MLS) $53,000 Beaches MLS
- 2010-10-22 Listing Removed — Beaches MLS
- 2010-05-22 Listed $53,000 Beaches MLS
- 2008-12-16 Listed $71,900 Beaches MLS
- 2008-01-02 Listed $160,000 MCRTC
- 2007-08-15 Listed $139,000 MCRTC
- 2007-02-20 Listed $115,900 Beaches MLS
- 2007-01-10 Listed $269,000 MCRTC
- 2007-01-06 Listing Removed — MCRTC
- 2006-12-10 Listed $113,500 MCRTC
- 2006-10-06 Listed $170,000 MCRTC
- 2006-08-30 Listing Removed — MCRTC
- 2006-08-07 Listed $189,900 Beaches MLS
- 2006-02-20 Listed $186,900 MCRTC
- 2005-01-28 Price Changed $129,900 MCRTC
- 2005-01-28 Sold (MLS) $128,000 MCRTC
- 2004-12-28 Listed $128,000 MCRTC
- 2003-03-31 Sold (MLS) $92,000 MCRTC
- 2003-03-28 Sold (MLS) $92,000 MCRTC
- 2003-01-28 Listed $95,000 MCRTC
- 2003-01-28 Listed $95,000 MCRTC
Cash-flow waterfall
monthlySold comps — $/sqft
last 12 mo · ≤1 miLoading sold comps…