36122 Main St · New Baltimore, MI
Flood risk 1/10 · Minimal
- FEMA flood zone
- X (unshaded)
- Chance of flooding over 30 yrs
- 0.0%
- Est. flood insurance / yr
- $473 – $860
Fire risk 1/10 · Minimal
- Est. fire insurance / yr
- $784 – $1,456
Heat risk 3/10 · Minor
- Hot days now (above 96°F)
- 7 days/yr
- Hot days in 30 yrs
- 15 days/yr
Wind risk 1/10 · Minimal
- Chance of severe wind over 30 yrs
- —
Air-quality risk 4/10 · Minor
- Unhealthy air days now
- 4 days/yr
- Unhealthy air days in 30 yrs
- 6 days/yr
Risk factors via First Street. Map © Google.
Why this score? — see what drove the B grade
The composite is a weighted blend of 9 inputs, each scored 0–100. Each bar is that input's sub-score; the figure is the points it added to the 100-point composite (weight × sub-score).
- Cash flow +30.0/30.0
- 1% rule +10.0/10.0
- DSCR +10.0/10.0
- ARV discount +7.5/15.0
- Schools +4.4/10.0
- Livability +4.2/5.0
- Rent growth +2.5/5.0
- Condition / age +2.5/5.0
- Appreciation +0.0/10.0
$54,900
🖨 Deal sheet (PDF) 📄 Offer letter ✓ Due diligence
Listing remarks MLS
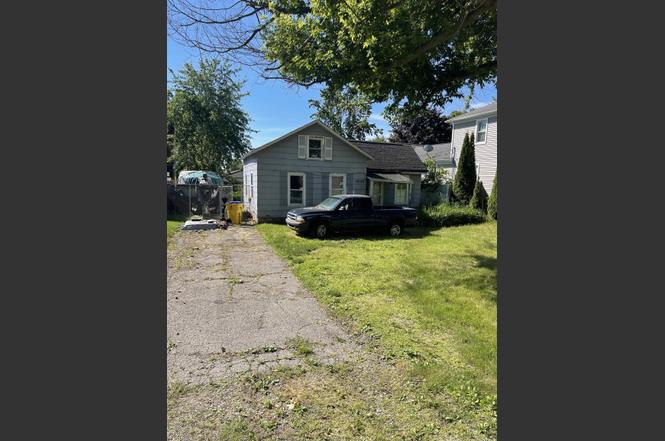
* * Estate Sale * * New Baltimore , Location , Location, Location ! Walk to lake or downtown ! Perfect Handyman special or Demo and build new ! Please use extreme CAUTION when entering the home , the front porch is soft ! Property is subject to probate court approval, all items in home will be left in property, therefore it is sold "AS-IS" (the boat & truck are NOT included ). Property MUST be listed for a min of 10 days before any offer can be accepted. Please allow 24-72 business hours for attorney review. CASH only sale . If writing an offer please read agent remarks .
Key facts
- Walk to downtown
- Walk to lake
- 6,098 sq ft lot
Tags
Property features AI
Finance
- Financial info: Annual tax amount listed
- HOA & community: Homeowners association present
Exterior
- Utilities: Public water; Public sewer
- Home design: Single-family residence; One story
- Construction: Metal siding; 657 above-grade finished square feet
- Exterior features: Lot approximately 50 x 120 (0.14 acre); No pool
Interior
- Bathrooms: 1 full bathroom
- Heating & cooling: No heating; No cooling
- Interior features: 3 total rooms
Neighborhood map
What this means for you Summary
Snapshot
- This is a 1-bed/1.0-bath single-family listed at $55k.
Deal economics
- At list price, monthly cash flow is $394 ($5k/yr) — positive.
- The deal already cash-flows at list — no discount required.
- Meets the 1% rule at list price ($1k rent vs $55k).
- Cap rate 14.9% vs local median 2.6% in New Baltimore — top-decile yield for the area; either an underpriced asset or a hidden risk that comps aren't pricing in. Stress-test before assuming the spread holds.
Location & tenants
- Location reads 85/100 on livability (#30 in MI, #597 nationally) — a professional / high-income tenant draw. Strengths: crime A+, employment A+, cost of living A+; Watch: health & safety D+, amenities F.
- Anchor Bay School District (suburban): math 44% / reading 54% proficiency, ranked #91 of 540 in MI (top 17%) — families likely to look elsewhere, expect single-tenant / working-renter base with shorter leases; only 20% free/reduced lunch — higher-income household profile.
- Market conditions: 238 active listings in the ZIP; 4 comparable units currently listed for rent nearby; rentals at typical pace (median 22d on market — plan ~3-4 weeks tenant-placement turnaround); solid renter incomes; 1,321 units permitted in Macomb County in 2024 (86 in 5+ unit buildings).
- This rent is only 13% of the median local income ($95k/yr) — well below the 30% rent-burden line; pricing power to push rent on renewal without tenant pushback.
Forward outlook
- Local home prices are declining (-3.0%/yr); year-one equity from $380 of loan paydown is wiped out by about $2k of value loss. Plan a longer hold.
- Macomb County population projected at +9% by 2050 — modest demand growth; plan on rents tracking national, not racing it.
- At projected returns (-3.0% appreciation + 3.0% rent growth), your $15k cash investment doubles in ~4 years — after that, you're playing with house money.
Negotiation context
- Only 4 days on market — expect competitive offers; lowballing is unlikely to land.
- 2 sale attempts with the ask held roughly flat each time — persistent listings suggest the price (not the market) is what's stuck; bring a comps-based counter.
- Current owner paid $24k; list at $55k implies a 129% gain — meaningful room to come down on a strong offer.
Risks & watch-outs
- Watch-outs: property tax is 2.8% of price; built in 1955 — expect roof / HVAC / electrical / plumbing capex.
Questions for the listing agent
- Built in 1955 — when were the roof, HVAC, electrical panel, plumbing, and water heater last replaced?
- Property tax is high relative to price — has the assessment been appealed recently, and will the sale trigger a re-assessment?
- Is there a deadline driving the sale (1031 exchange, divorce, estate, relocation)? That informs how much negotiation room exists.
- Schools are B-rated — typically a magnet for longer-tenancy family renters. What's the average tenant stay here, and is there a school-zone premium baked into asking?
- What's the average days-on-market for RENTAL listings here right now (not sales)? A rising rental-DOM trend means longer vacancies and softer asking-rent achievability than the comps imply.
- What's the recent tenant-quality profile in this submarket — average credit score on applications, eviction rate, late-payment / NSF rate, and stable-employment percentage? A property-management company in the area should have these aggregated.
- How much new for-sale + rental construction is in the pipeline within 1–3 miles? Heavy new supply typically softens prices + rents 12–24 months out; constrained supply supports both.
Investment metrics
- 1% rule
- 1.92% ✓
- Cap rate
- 14.91%
- Cash-on-cash
- 30.78%
- DSCR
- 2.37
- GRM
- 4.3
CMA / ARV
No comps found within radius.
Projected returns pro-forma
-3.0% appreciation · 3.0% rent growth · sell at horizon
- IRR
- 25.6%
- Equity multiple
- 2.06×
- Total profit
- $16,266
- Equity at exit
- $8,186
- IRR
- 33.3%
- Equity multiple
- 4.04×
- Total profit
- $46,711
- Equity at exit
- $4,747
Cash invested: $15,372 (down + closing). Projections, not guarantees.
Landlord ↔ Tenant lean methodology
- Overall (STATE)
- 62 Landlord-Friendly
- State Michigan
- 62 Landlord-Friendly · EVEN
- County
- — inherits STATE
- City
- — inherits STATE
ZIP-level market 48047
- Active inventory
- 238
- Price-to-rent
- 4.3×
Monthly cashflow live
- Estimated rent
- $1,055 medium interval (Pro) →
- Mortgage (P&I)
- −$288
- Tax from tax record
- −$128 /mo · $1,538/yr
- Insurance
- −$23
- HOA
- −$0
- Vacancy / Maint / Mgmt
- −$221
- Net cashflow
- $394
Break-even live
Sensitivity live
| Price | -10% $425 | -5% $410 | +0% $394 | +5% $379 | +10% $363 |
|---|---|---|---|---|---|
| Rent | -10% $311 | -5% $353 | +0% $394 | +5% $436 | +10% $478 |
| Rate | -1.0pp $422 | -0.5pp $408 | base $394 | +0.5pp $380 | +1.0pp $366 |
UW: 25.0% down · 7.5% · 30yr · 1.5% tax · 5.0% vac · 8.0% maint · 8.0% mgmt
Financing live
Cash to close
- Down payment
- $13,725
- Closing costs
- $1,647
- Reserves months
- —
- Total cash needed
- —
Loan-product check · same deal, 3 products live
Conventional
25% down · 7.5% · 30yr
- Down + closing
- —
- Monthly P&I
- —
- Monthly cashflow
- —
- DSCR
- —
- Eligible?
- —
Personal DTI + credit; lowest rate.
DSCR
20% down · 8.5% · 30yr
- Down + closing
- —
- Monthly P&I
- —
- Monthly cashflow
- —
- DSCR
- —
- Eligible?
- —
No personal income docs; deal must DSCR.
Hard money
10% down · 12.0% · 12mo
- Down + closing
- —
- Monthly P&I
- —
- Monthly cashflow
- —
- DSCR
- —
- Eligible?
- —
Short-term bridge; refi at stabilization.
Rent comps 4 comps
| Address | Beds | Baths | Sqft | Rent | $/sqft | DOM | Units | Dist |
|---|---|---|---|---|---|---|---|---|
| 36247 Hathaway St Unit 4 New Baltimore, MI | 1.0 | 1.0 | 550 | $950 | $1.73 | 22d | 1 | 0.24mi |
| 36241 Hathaway St Apt 5 New Baltimore, MI | 1.0 | 1.0 | 550 | $950 | $1.73 | 45d | 1 | 0.24mi |
| 36241 Hathaway St Apt 5 New Baltimore, MI | 1.0 | 1.0 | 550 | $950 | $1.73 | 3d | 1 | 0.24mi |
| 50980 Jefferson Ave New Baltimore, MI | 1.0 | 1.0 | 542 | $1,025 | $1.89 | 0d | 2 | 0.56mi |
Listing history 3 events
-
2026-06-21days on market $54,900 Active 4 DOM
-
2026-06-17remarks 590-char remark
Show marketing remark (604 chars)
* * Estate Sale * * New Baltimore , Location , Location, Location ! Walk to lake or downtown ! Perfect Handyman special or Demo and build new ! Please use extreme CAUTION when entering the home , the front porch is soft ! Property is subject to probate court approval, all items in home will be left in property, therefore it is sold "AS-IS" (the boat & truck are NOT included ). Property MUST be listed for a min of 10 days before any offer can be accepted. Please allow 24-72 business hours for attorney review. CASH only sale . If writing an offer please read agent remarks .
-
2026-06-17$54,900 Active 1 DOM
Show marketing remark (604 chars)
* * Estate Sale * * New Baltimore , Location , Location, Location ! Walk to lake or downtown ! Perfect Handyman special or Demo and build new ! Please use extreme CAUTION when entering the home , the front porch is soft ! Property is subject to probate court approval, all items in home will be left in property, therefore it is sold "AS-IS" (the boat & truck are NOT included ). Property MUST be listed for a min of 10 days before any offer can be accepted. Please allow 24-72 business hours for attorney review. CASH only sale . If writing an offer please read agent remarks .
ⓘ Source: listings_history table (triggers on properties + properties_extension) + one-shot
backfill from property_details.listing_events for pre-trigger history.
Tax reassessment forecast MI · Partial reset (capped growth)
- Current annual tax
- $1,538 · $128/mo
- Projected year-2 tax
- $1,538 · $128/mo
- Expected delta
- $0/yr ($0/mo · 0.0%)
ⓘ Screening estimate from a state-policy table — verify with the county assessor before closing.
Climate risk First Street
- Flood 1/10 Low FEMA zone X (unshaded) · 0% chance over 30 yrs
- Wildfire 1/10 Low
- Heat 3/10 Moderate 7 d/yr ≥96°F today · 15 d/yr by 30 yrs out
- Wind 1/10 Low
- Air quality 4/10 Moderate 4 unhealthy d/yr today · 6 by 30 yrs out
Nearby sold comps map
Loading sold comps map…
Walkable amenities ~0.75 mi
Loading nearby amenities…
Taxation est. · year 1
- Rental income
- $12,657
- − Mortgage interest
- −$3,075
- − Property taxes
- −$1,538
- − Insurance
- −$274
- − Repairs & maintenance
- −$1,013
- − Management
- −$1,013
- − Depreciation
- −$1,597
- Taxable income
- $4,146
- Est. tax owed @ 24.0%
- −$995
- After-tax cash flow
- $3,736/yr
For passive investors: Depreciation is non-cash, so a rental often shows a tax loss while cash-flowing — sheltering income. Rental losses are passive: they offset passive income freely, and up to $25,000/yr can offset ordinary (W-2) income if you actively participate and your MAGI is under $100k (phasing out to $0 by $150k); unused losses carry forward. On sale, claimed depreciation is recaptured at up to 25%, and gains may owe capital-gains tax (a 1031 exchange can defer both). Figures are a year-1 estimate at your 24.0% rate — not tax advice; consult a CPA.
Schools (NCES district)
- District
- Anchor Bay School District
- NCES district ID
- 2602790
- Math proficiency
- 44% ▼ -12.00%
- Reading proficiency
- 54% ▼ -7.00%
- Median HH income
- $70,173
- Composite
- 43.85/100
- National rank
- #2925
- State rank
- #91 of 540 in MI
Livability — New Baltimore
- Score
- 85/100
- State rank
- #30
- US rank
- #597
Category grades
Schools grade is shown separately in the Schools card above.
Census & demographics
- Census place
- New Baltimore, MI
- County
- Macomb County · 638,552 people
- Metro
- Detroit-Warren-Dearborn, MI
- Population (ZIP)
- 40,302
- Household income
- $94,890
- Rent vs Own
- Severe rent burden
- 529.0
Population outlook (Macomb County) Hauer SSP2
- Today (2025)
- 925,296 people
- By 2030
- 948,226 · +2.5%
- By 2040
- 983,961 · +6.3%
- By 2050
- 1,010,200 · +9.2%
- By 2075
- 1,076,222 · +16.3%
- By 2100
- 1,077,065 · +16.4%
Race, ethnicity, and origin ACS 2023
- Neighborhood character
- Predominantly White (85%)
- Race & ethnicity
- White 85% Two or more races 6% Black 5% Hispanic / Latino 4% Asian 2%
- Common ancestry
- Romanian 16% Lithuanian 6% Slovak 3%
- Foreign-born
- 3% · Canada
- Languages at home
- 96% English-only · Spanish 1% Other Indo-European 1% Russian/Polish/Slavic 1%
Political lean MEDSL · Macomb
- 2024 margin
- R (+13.7) · D 42.2% · R 55.9% · Other 1.9%
- 2008→2024 swing
- -22.3pp toward R · 2008: 8.6pp · 2024: -13.7pp
- All cycles
- 2024: R+13.7 2020: R+8.1 2016: R+11.6 2012: D+4.0 2008: D+8.6
Not yet ingested
- Civics
- —
Market trends
- HPI YoY
- ▼ -265.06%
- Current HPI
- 216.5914
- Rent YoY
- —
- Metro
- Detroit-Warren-Dearborn, MI
- State GDP YoY
- ▲ 1.37%
- F500 in state
- 28
Industry mix (Fortune 500 HQ in MI)
| Industry | F500 HQs | Revenue |
|---|---|---|
| Automotive Parts | 3 | $48B |
|
||
| Automotive | 2 | $372B |
|
||
| Chemicals | 1 | $45B |
|
||
| Automotive Retail | 1 | $29B |
|
||
| Healthcare / Medical Devices | 1 | $23B |
|
||
| Automotive Technology | 1 | $20B |
|
||
Price history
+128.8% since first listed4 events — show timeline
- 2026-06-17 Listed $54,900 REALCOMP
- 2026-06-17 Listed $54,900 MiRealSource-MiMLS
- 1989-10-06 Sold (Public Records) $14,500 Public Records
- 1989-10-06 Sold (Public Records) $24,000 Public Records
Property tax history
+2.1%/yrLatest (2025): $1,538 · +2.6% YoY. Source: county tax records.
Cash-flow waterfall
monthlySold comps — $/sqft
last 12 mo · ≤1 miLoading sold comps…