22359 S Cedar Dr #118 · Channahon, IL
Flood risk No data
- FEMA flood zone
- —
- Chance of flooding over 30 yrs
- —
- Est. flood insurance / yr
- —
Fire risk No data
- Est. fire insurance / yr
- —
Heat risk No data
- Hot days now (above threshold)
- —
- Hot days in 30 yrs
- —
Wind risk No data
- Chance of severe wind over 30 yrs
- —
Air-quality risk No data
- Unhealthy air days now
- —
- Unhealthy air days in 30 yrs
- —
Risk factors via First Street. Map © Google.
Why this score? — see what drove the C+ grade
The composite is a weighted blend of 9 inputs, each scored 0–100. Each bar is that input's sub-score; the figure is the points it added to the 100-point composite (weight × sub-score).
- Cash flow +26.8/30.0
- DSCR +9.2/10.0
- ARV discount +7.5/15.0
- 1% rule +7.2/10.0
- Livability +3.9/5.0
- Schools +3.1/10.0
- Rent growth +2.5/5.0
- Condition / age +2.5/5.0
- Appreciation +1.2/10.0
$179,999
🖨 Deal sheet 📄 Offer letter ✓ Due diligence
Listing remarks
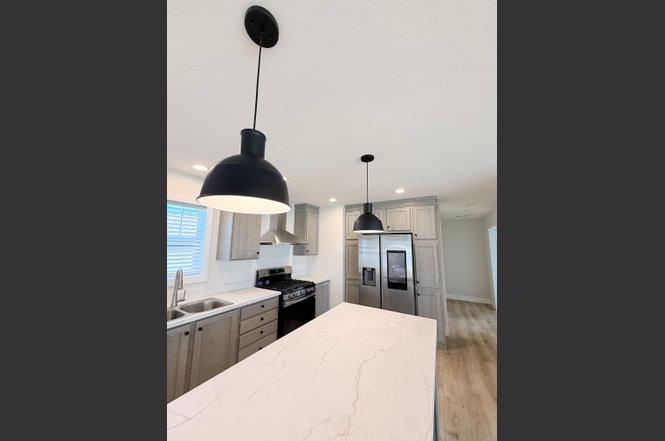
Largest Corner Lot | 55+ Community | Walk-In Pantry | Samsung Appliances Largest corner lot in Remington Woods. Brand-new 1,568 sq ft home with 3 beds, 2 baths, open living, oversized island, walk-in pantry, private primary suite, Samsung appliances, clubhouse, trails, and peaceful 55+ living. Inside, the expansive open floorplan creates effortless flow from the great room into the designer kitchen, showcasing a large island with seating for four, upgraded pendant lighting, and an attached dining area that accommodates six with ease. A walk-in pantry with two full walls of shelving ensures organized, abundant storage. Your private master suite is a true retreat with an oversized bedroom,
Key facts
- Designer kitchen
- Private master suite
- Open floorplan
Tags
Property features AI
Finance
- Other: Address: 22359 S Cedar Dr #118, Channahon, IL 60410; Listing status: Active
- Financial info: List price $179,999
Exterior
- Utilities: Electric service; Natural gas; Central air
- Home design: Spec home (Remington Woods plan)
- Construction: Living area approximately 1568
- Exterior features: Asphalt roof
Interior
- Kitchen: Dishwasher; Refrigerator
- Bedrooms: 3 bedrooms
- Bathrooms: 2 full bathrooms
- Heating & cooling: Forced air heating (electric and natural gas); Central air conditioning
- Interior features: Dishwasher; Dryer; Refrigerator; Washer
- Laundry & utility: Washer and dryer
Neighborhood map
What this means for you Summary
Snapshot
- This is a 3-bed/2.0-bath manufactured listed at $180k.
Deal economics
- At list price, monthly cash flow is $494 ($6k/yr) — positive.
- The deal already cash-flows at list — no discount required.
- Meets the 1% rule at list price ($2k rent vs $180k).
- Recommended offer: $158k (12.0% below list) — sets the bar for market timing.
- Cap rate 9.6% vs local median 2.4% in Channahon — top-decile yield for the area; either an underpriced asset or a hidden risk that comps aren't pricing in. Stress-test before assuming the spread holds.
Location & tenants
- Location reads 78/100 on livability (#143 in IL, #2,614 nationally) — a middle-class / working-renter tenant base. Strengths: crime A+, employment A+, housing A+; Watch: amenities F, commute F.
- Minooka Chsd 111 (suburban): math 28% / reading 36% proficiency, ranked #187 of 620 in IL (top 30%) — families likely to look elsewhere, expect single-tenant / working-renter base with shorter leases.
- Market conditions: 103 active listings in the ZIP; 1 comparable units currently listed for rent nearby; 2,028 units permitted in Will County in 2024 (530 in 5+ unit buildings).
Forward outlook
- Local home prices are declining (-3.0%/yr); year-one equity from $1k of loan paydown is wiped out by about $5k of value loss. Plan a longer hold.
- Will County population projected to shrink 4% by 2050 — rents likely to lag national; underwrite the cash flow, not the appreciation.
- At projected returns (-3.0% appreciation + 3.0% rent growth), your $50k cash investment doubles in ~10 years — after that, you're playing with house money.
Negotiation context
- It's been on market 177 days — a 12% lower offer ($158k) is reasonable based on typical stale-listing flexibility.
Questions for the listing agent
- It's been on market 177 days. Have you received any prior offers? Is the seller open to a 12% concession, seller financing, or rate buy-down credit?
- Why hasn't it sold? Are there any deal-killer items the seller is aware of (foundation, flood, title, zoning, code violations)?
- Is there a deadline driving the sale (1031 exchange, divorce, estate, relocation)? That informs how much negotiation room exists.
- What's the average days-on-market for RENTAL listings here right now (not sales)? A rising rental-DOM trend means longer vacancies and softer asking-rent achievability than the comps imply.
- What's the recent tenant-quality profile in this submarket — average credit score on applications, eviction rate, late-payment / NSF rate, and stable-employment percentage? A property-management company in the area should have these aggregated.
- How much new for-sale + rental construction is in the pipeline within 1–3 miles? Heavy new supply typically softens prices + rents 12–24 months out; constrained supply supports both.
Investment metrics
- 1% rule
- 1.22% ✓
- Cap rate
- 9.59%
- Cash-on-cash
- 11.76%
- DSCR
- 1.52
- GRM
- 6.8
CMA / ARV
No comps found within radius.
Projected returns pro-forma
-3.0% appreciation · 3.0% rent growth · sell at horizon
- IRR
- 1.2%
- Equity multiple
- 1.05×
- Total profit
- $2,333
- Equity at exit
- $26,838
- IRR
- 10.8%
- Equity multiple
- 1.85×
- Total profit
- $42,686
- Equity at exit
- $15,563
Cash invested: $50,400 (down + closing). Projections, not guarantees.
Landlord ↔ Tenant lean methodology
- Overall (STATE)
- 43 Moderately Tenant-Leaning
- State Illinois
- 43 Moderately Tenant-Leaning · D+7
- County
- — inherits STATE
- City
- — inherits STATE
ZIP-level market 60410
- Home prices YoY
- -3.2%
- Active inventory
- 103
- Price-to-rent
- 6.8×
Monthly cashflow live
- Estimated rent
- $2,200 medium interval (Pro) →
- Mortgage (P&I)
- −$944
- Tax est. 1.5%
- −$225 /mo · $2,700/yr
- Insurance
- −$75
- HOA
- −$0
- Vacancy / Maint / Mgmt
- −$462
- Net cashflow
- $494
Break-even live
UW: 25.0% down · 7.5% · 30yr · 1.5% tax · 5.0% vac · 8.0% maint · 8.0% mgmt
Financing live
Cash to close
- Down payment
- $45,000
- Closing costs
- $5,400
- Reserves months
- —
- Total cash needed
- —
Loan-product check · same deal, 3 products live
Conventional
25% down · 7.5% · 30yr
- Down + closing
- —
- Monthly P&I
- —
- Monthly cashflow
- —
- DSCR
- —
- Eligible?
- —
Personal DTI + credit; lowest rate.
DSCR
20% down · 8.5% · 30yr
- Down + closing
- —
- Monthly P&I
- —
- Monthly cashflow
- —
- DSCR
- —
- Eligible?
- —
No personal income docs; deal must DSCR.
Hard money
10% down · 12.0% · 12mo
- Down + closing
- —
- Monthly P&I
- —
- Monthly cashflow
- —
- DSCR
- —
- Eligible?
- —
Short-term bridge; refi at stabilization.
Rent comps 1 comps
| Address | Beds | Baths | Sqft | Rent | $/sqft | DOM | Units | Dist |
|---|---|---|---|---|---|---|---|---|
| 22451 S Carrie Ave Channahon, IL | 3.0 | 1.0 | 1176 | $2,200 | $1.87 | 7d | 1 | 0.83mi |
Listing history 13 events
-
2026-06-18days on market $179,999 Active 177 DOM
-
2026-06-17days on market $179,999 Active 176 DOM
-
2026-06-16days on market $179,999 Active 175 DOM
-
2026-06-15days on market $179,999 Active 174 DOM
-
2026-06-13days on market $179,999 Active 172 DOM
-
2026-06-09days on market $179,999 Active 168 DOM
-
2026-06-08days on market $179,999 Active 167 DOM
-
2026-06-07days on market $179,999 Active 166 DOM
-
2026-06-04days on market $179,999 Active 163 DOM
-
2026-06-03days on market $179,999 Active 162 DOM
-
2026-06-02days on market $179,999 Active 161 DOM
-
2026-06-01days on market $179,999 Active 160 DOM
-
2026-05-31days on market $179,999 Active 159 DOM
ⓘ Source: listings_history table (triggers on properties + properties_extension) + one-shot
backfill from property_details.listing_events for pre-trigger history.
Nearby sold comps map
Loading sold comps map…
Walkable amenities ~0.75 mi
Loading nearby amenities…
Taxation est. · year 1
- Rental income
- $26,400
- − Mortgage interest
- −$10,083
- − Property taxes
- −$2,700
- − Insurance
- −$900
- − Repairs & maintenance
- −$2,112
- − Management
- −$2,112
- − Depreciation
- −$5,236
- Taxable income
- $3,257
- Est. tax owed @ 24.0%
- −$782
- After-tax cash flow
- $5,147/yr
For passive investors: Depreciation is non-cash, so a rental often shows a tax loss while cash-flowing — sheltering income. Rental losses are passive: they offset passive income freely, and up to $25,000/yr can offset ordinary (W-2) income if you actively participate and your MAGI is under $100k (phasing out to $0 by $150k); unused losses carry forward. On sale, claimed depreciation is recaptured at up to 25%, and gains may owe capital-gains tax (a 1031 exchange can defer both). Figures are a year-1 estimate at your 24.0% rate — not tax advice; consult a CPA.
Schools (NCES district)
- District
- Minooka Chsd 111
- NCES district ID
- 1726340
- Math proficiency
- 28% ▼ -8.00%
- Reading proficiency
- 36% ▼ -7.00%
- Median HH income
- $81,260
- Composite
- 30.82/100
- National rank
- #6138
- State rank
- #187 of 620 in IL
Livability — Channahon
- Score
- 78/100
- State rank
- #143
- US rank
- #2614
Category grades
Schools grade is shown separately in the Schools card above.
Census & demographics
- Census place
- Channahon, IL
- City population
- 14,027
- Population (ZIP)
- 14,027
Population outlook (Will County) Hauer SSP2
- Today (2025)
- 705,368 people
- By 2030
- 708,154 · +0.4%
- By 2040
- 702,692 · -0.4%
- By 2050
- 680,249 · -3.6%
- By 2075
- 611,990 · -13.2%
- By 2100
- 516,215 · -26.8%
Race, ethnicity, and origin ACS 2023
- Neighborhood character
- Predominantly White (82%)
- Race & ethnicity
- White 82% Hispanic / Latino 14% Two or more races 5%
- Hispanic origin (detail)
- Mexican 7% Puerto Rican 4% Cuban 2%
- Common ancestry
- Romanian 10% Lithuanian 2% Iranian 2%
- Foreign-born
- 3% · Canada
- Languages at home
- 94% English-only · Spanish 5% Other Indo-European 1%
Political lean MEDSL · Will
- 2024 margin
- Toss-up / Even · D 50.1% · R 48.5% · Other 1.4%
- 2008→2024 swing
- -11.6pp toward R · 2008: 13.2pp · 2024: 1.6pp
- All cycles
- 2024: D+1.6 2020: D+8.3 2016: D+5.7 2012: D+3.7 2008: D+13.2
Not yet ingested
- Civics
- —
Market trends
- HPI YoY
- ▼ -7.58%
- Current HPI
- 227.2488
- Rent YoY
- —
- Metro
- —
- State GDP YoY
- ▲ 1.59%
- F500 in state
- 60
Industry mix (Fortune 500 HQ in IL)
| Industry | F500 HQs | Revenue |
|---|---|---|
| Insurance | 4 | $201B |
|
||
| Consumer Goods | 4 | $87B |
|
||
| Industrial Machinery | 3 | $64B |
|
||
| Healthcare | 2 | $55B |
|
||
| Retail / Pharmacy | 1 | $148B |
|
||
| Agriculture / Food | 1 | $86B |
|
||
Cash-flow waterfall
monthlySold comps — $/sqft
last 12 mo · ≤1 miLoading sold comps…