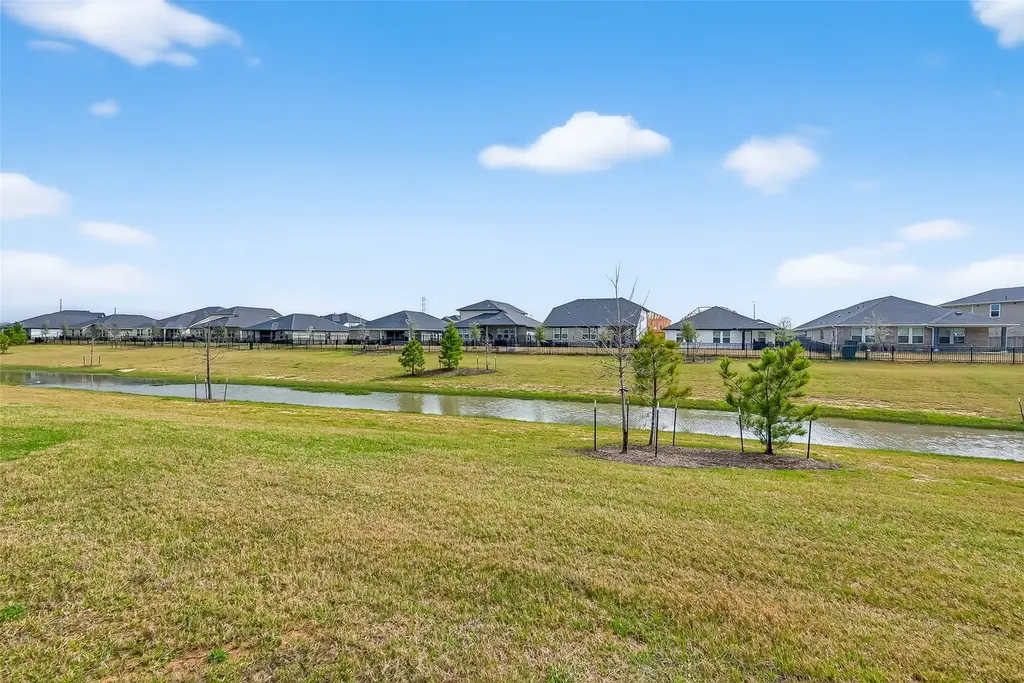
 🌊 Lakefront
27103 Blue Pool Dr · Katy, TX
Flood risk 5/10 · Moderate
- FEMA flood zone
- X (unshaded)
- Chance of flooding over 30 yrs
- 0.65%
- Est. flood insurance / yr
- $507 – $1,088
Fire risk 4/10 · Minor
- Est. fire insurance / yr
- $1,222 – $2,270
Heat risk 9/10 · Severe
- Hot days now (above 111°F)
- 7 days/yr
- Hot days in 30 yrs
- 22 days/yr
Wind risk 9/10 · Severe
- Chance of severe wind over 30 yrs
- 99.0%
Air-quality risk 2/10 · Minimal
- Unhealthy air days now
- 1 days/yr
- Unhealthy air days in 30 yrs
- 1 days/yr
Risk factors via First Street. Map © Google.
Why this score? — see what drove the D grade
The composite is a weighted blend of 9 inputs, each scored 0–100. Each bar is that input's sub-score; the figure is the points it added to the 100-point composite (weight × sub-score).
- ARV discount +15.0/15.0
- Cash flow +6.8/30.0
- Schools +5.7/10.0
- 1% rule +4.5/10.0
- Condition / age +4.0/5.0
- Livability +3.8/5.0
- Rent growth +2.3/5.0
- DSCR +1.1/10.0
- Appreciation +0.0/10.0
$299,888
🖨 Deal sheet (PDF) 📄 Offer letter ✓ Due diligence
Listing remarks
Beautiful lake front home, better than new with owner upgrades!. .. …. . 4-Bedroom home in the sought-after Sunterra Subdivision in Katy! This modern 2-story home sits on a 5,080 sq. ft. lot that overlooks the lake; a beautiful and peaceful view! Home offers beautiful Quartz countertops, upgraded lighting & floors, and a full water filtration system throughout the entire home. The kitchen is fully equipped with Stainless Steel appliances including a refrigerator and that also includes a washer & dryer! All residents of Sunterra can enjoy access to different choices of community amenities, including a Lazy River, a 24-Hour Fitness and resort-style pool located at The Retr
Key facts
- Owner upgrades
- Quartz countertops
- Community amenities
Tags
Property features AI
Finance
- Other: Association-managed pool and community amenities
- HOA & community: Member of Sunterra Property Owners Association; Annual HOA fee of $1,200; HOA maintains clubhouse, common areas and recreation facilities; Community clubhouse and pool
Exterior
- Parking: Attached garage with 2 parking spaces
- Security: Gated/guarded community
- Utilities: Public water; Public sewer
- Home design: Residential property; Has a view
- Construction: Built in 2023; Brick and wood siding exterior; Composition roof; Slab foundation
- Exterior features: Subdivision lot; Waterfront lot with lakefront access; Association pool
Interior
- Kitchen: Dishwasher; Disposal; Gas oven; Gas range; Microwave
- Flooring: Carpet; Tile
- Bathrooms: 2 full bathrooms; 1 half bathroom
- Heating & cooling: Central heating (gas); Central electric air conditioning
- Interior features: Quartz counters; 4 total rooms
- Laundry & utility: Washer hookup; Electric dryer hookup
Neighborhood map
What this means for you Summary
Snapshot
- This is a 4-bed/2.5-bath single-family listed at $300k. Condition is rated good.
Deal economics
- At list price, monthly cash flow is $-461 ($-6k/yr) — negative.
- To cash-flow at today's rent, offer at most $219k (27.1% below list).
- To meet the 1% rule (rent ≥ 1% of price), the offer needs to be $284k (5.3% below list).
- Recommended offer: $219k (27.1% below list) — sets the bar for cash-flow.
- Cap rate 4.5% vs local median 3.0% in Katy — top-decile yield for the area; either an underpriced asset or a hidden risk that comps aren't pricing in. Stress-test before assuming the spread holds.
Location & tenants
- Location reads 76/100 on livability (#111 in TX, #3,613 nationally) — a middle-class / working-renter tenant base. Strengths: employment A+, cost of living A+, housing A+; Watch: crime C-, amenities D, commute F.
- Katy ISD (suburban): math 61% / reading 63% proficiency, ranked #29 of 826 in TX (top 4%) — acceptable for families but not a draw, mixed tenant base, ~2y average lease.
- Zoned schools: Robert King El (math 41% / reading 44%, grade F, #1,313 of 4,322 statewide, top 31%, 981 students, 68% FRL); Katy J H (math 52% / reading 51%, grade C, #318 of 1,662 statewide, top 20%, 1,094 students, 53% FRL); Katy H S (math 62% / reading 74%, grade B, #150 of 1,632 statewide, top 10%, 3,330 students, 38% FRL) — zoned schools average 53% FRL vs 27% district-wide (25 pts higher); higher-poverty schools than district average — tighter screening recommended.
- Market conditions: Rents soft (-0.8%/yr); 2729 active listings in the ZIP; 37 comparable units currently listed for rent nearby; rentals at typical pace (median 26d on market — plan ~3-4 weeks tenant-placement turnaround); high-income renter base; 29,883 units permitted in Harris County in 2024 (8,621 in 5+ unit buildings).
Forward outlook
- Local home prices are declining (-3.0%/yr); year-one equity from $2k of loan paydown is wiped out by about $9k of value loss. Plan a longer hold.
- Harris County population projected at +47% by 2050 — long-run rental-demand tailwind backs the buy-and-hold thesis.
Negotiation context
- It's been on market 52 days — a 3% lower offer ($291k) is reasonable based on typical stale-listing flexibility.
- 3 sale attempts since 2y ago with the ask held roughly flat each time — persistent listings suggest the price (not the market) is what's stuck; bring a comps-based counter.
Risks & watch-outs
- Watch-outs: property tax is 3.6% of price.
- Climate carrying-cost: moderate flood risk; severe wind risk, 99% chance of damaging wind over 30y; extreme-heat days projected 7→22/yr by 2055 (HVAC capex compounding) — expect insurance premiums to compound above CPI over the hold.
Questions for the listing agent
- What do current leases actually rent for vs. the listed asking? Can we see a recent rent roll and the last 12 months of T-12 income?
- It's been on market 52 days. Have you received any prior offers? Is the seller open to a 27% concession, seller financing, or rate buy-down credit?
- Property tax is high relative to price — has the assessment been appealed recently, and will the sale trigger a re-assessment?
- What does the HOA fee cover, when was the last increase, and are there any pending special assessments or reserve-fund shortfalls?
- Is there a deadline driving the sale (1031 exchange, divorce, estate, relocation)? That informs how much negotiation room exists.
- Schools are B-rated — typically a magnet for longer-tenancy family renters. What's the average tenant stay here, and is there a school-zone premium baked into asking?
- The area grade is low — what's the realistic commute time and amenity access for the typical tenant pool here? Any planned neighborhood developments (good or bad) we should know about?
- This sits on a lake — are riparian / water-frontage rights deeded with the parcel? Any dock permits, shoreline easements, or HOA water-use restrictions?
- What's the documented flood / surge / shoreline-erosion history here (FEMA AND non-FEMA — e.g., storm surge, creek backup, septic-field saturation)?
- Any water-quality or seasonal algae-bloom issues that affect tenant satisfaction or short-term-rental demand?
- What's the average days-on-market for RENTAL listings here right now (not sales)? A rising rental-DOM trend means longer vacancies and softer asking-rent achievability than the comps imply.
- What's the recent tenant-quality profile in this submarket — average credit score on applications, eviction rate, late-payment / NSF rate, and stable-employment percentage? A property-management company in the area should have these aggregated.
- How much new for-sale + rental construction is in the pipeline within 1–3 miles? Heavy new supply typically softens prices + rents 12–24 months out; constrained supply supports both.
Investment metrics
- 1% rule
- 0.95% ✗
- Cap rate
- 4.45%
- Cash-on-cash
- -6.58%
- DSCR
- 0.71
- GRM
- 8.8
CMA / ARV
- ARV (median comp)
- $486,454
- List price
- $299,888
- Delta
- -38.35%
- Verdict
- UNDERPRICED
- Comps
- 20 within 1.0 mi
Show comp detail 12 sales within ~0.75 mi
| Address | Dist | Beds/Ba | Sqft | Sold | Price | $/sf | Match |
|---|---|---|---|---|---|---|---|
| 5806 Havana Mist Dr | 0.10mi | 4/2.5 | 2,134 (0%) | 0mo | $305,000 | $143 | 95 |
| 27334 Leeward Jetty Dr | 0.29mi | 4/3.0 | 2,201 (+3%) | 0mo | $357,990 | $163 | 79 |
| 27507 Crystalline Sage Ln | 0.43mi | 4/3.0 | 2,170 (+2%) | 0mo | $364,990 | $168 | 75 |
| 27303 Leeward Jetty Dr | 0.25mi | 4/3.0 | 2,340 (+10%) | 0mo | $357,330 | $153 | 70 |
| 27519 Crystalline Sage Ln | 0.45mi | 4/2.0 | 2,035 (-5%) | 0mo | $371,990 | $183 | 69 |
| 27018 Turtle Vista Dr | 0.14mi | 4/3.5 | 2,400 (+12%) | 0mo | $411,990 | $172 | 68 |
| 4784 Luna Landing Dr | 0.59mi | 4/3.0 | 2,168 (+2%) | 0mo | $335,990 | $155 | 68 |
| 4680 Peony Green Dr | 0.64mi | 4/2.0 | 2,056 (-4%) | 0mo | $343,990 | $167 | 62 |
| 26803 Scarlet Willow Dr | 0.59mi | 4/2.5 | 1,968 (-8%) | 0mo | $275,240 | $140 | 59 |
| 6018 Bella Breeze Dr | 0.60mi | 4/3.0 | 2,294 (+8%) | 0mo | $349,990 | $153 | 57 |
| 27723 Oasis Ridge Dr | 0.67mi | 4/3.0 | 2,294 (+8%) | 1mo | $375,990 | $164 | 54 |
| 4632 Cleo Day Dr | 0.71mi | 3/2.0 (-1) | 1,859 (-13%) | 0mo | $299,990 | $161 | 38 |
Match score weights: distance 35% · size 25% · config 20% · recency 20%. Top-matched comps best support the ARV.
Projected returns pro-forma
-3.0% appreciation · 0.0% rent growth · sell at horizon
- IRR
- -32.2%
- Equity multiple
- -0.02×
- Total profit
- $-85,817
- Equity at exit
- $44,714
- IRR
- -68.9%
- Equity multiple
- -0.70×
- Total profit
- $-142,905
- Equity at exit
- $25,929
Cash invested: $83,969 (down + closing). Projections, not guarantees.
Landlord ↔ Tenant lean methodology
- Overall (STATE)
- 87 Strongly Landlord-Friendly
- State Texas
- 87 Strongly Landlord-Friendly · R+5
- County
- — inherits STATE
- City
- — inherits STATE
ZIP-level market 77493
- Rents YoY
- -0.8%
- Active inventory
- 2729
- Price-to-rent
- 8.8×
Monthly cashflow live
- Estimated rent
- $2,839 high interval (Pro) →
- Mortgage (P&I)
- −$1,573
- Tax from tax record
- −$906 /mo · $10,872/yr
- Insurance
- −$125
- HOA
- −$100
- Vacancy / Maint / Mgmt
- −$596
- Net cashflow
- $-461
Break-even live
Sensitivity live
| Price | -10% $-291 | -5% $-376 | +0% $-461 | +5% $-545 | +10% $-630 |
|---|---|---|---|---|---|
| Rent | -10% $-685 | -5% $-573 | +0% $-461 | +5% $-348 | +10% $-236 |
| Rate | -1.0pp $-310 | -0.5pp $-384 | base $-461 | +0.5pp $-538 | +1.0pp $-617 |
UW: 25.0% down · 7.5% · 30yr · 1.5% tax · 5.0% vac · 8.0% maint · 8.0% mgmt
Financing live
Cash to close
- Down payment
- $74,972
- Closing costs
- $8,997
- Reserves months
- —
- Total cash needed
- —
Loan-product check · same deal, 3 products live
Conventional
25% down · 7.5% · 30yr
- Down + closing
- —
- Monthly P&I
- —
- Monthly cashflow
- —
- DSCR
- —
- Eligible?
- —
Personal DTI + credit; lowest rate.
DSCR
20% down · 8.5% · 30yr
- Down + closing
- —
- Monthly P&I
- —
- Monthly cashflow
- —
- DSCR
- —
- Eligible?
- —
No personal income docs; deal must DSCR.
Hard money
10% down · 12.0% · 12mo
- Down + closing
- —
- Monthly P&I
- —
- Monthly cashflow
- —
- DSCR
- —
- Eligible?
- —
Short-term bridge; refi at stabilization.
Rent comps 37 comps
| Address | Beds | Baths | Sqft | Rent | $/sqft | DOM | Units | Dist |
|---|---|---|---|---|---|---|---|---|
| 27327 Blue Pool Dr Katy, TX | 4.0 | 3.0 | 2100 | $2,600 | $1.24 | 45d | 1 | 0.24mi |
| 5631 Pearl Vista Dr Katy, TX | 4.0 | 3.0 | 2039 | $3,000 | $1.47 | 22d | 1 | 0.25mi |
| 5819 Bright Keel Dr Katy, TX | 4.0 | 3.0 | 2598 | $2,400 | $0.92 | 45d | 1 | 0.28mi |
| 27064 Beach Ball Dr Katy, TX | 3.0–4.0 | 2.5–3.5 | 1705 | $2,957 | $1.73 | 0d | 25 | 0.38mi |
| 27507 Hudson Sands Ln Katy, TX | 4.0 | 3.0 | 2294 | $3,000 | $1.31 | 18d | 1 | 0.43mi |
| 6303 Marigold Blaze Dr Katy, TX | 3.0 | 2.0 | 1474 | $2,250 | $1.53 | 45d | 1 | 0.61mi |
| 6414 Orchid Beach Dr Katy, TX | 5.0 | 4.0 | 2490 | $3,000 | $1.20 | 14d | 1 | 0.65mi |
| 4633 Peony Green Dr Katy, TX | 5.0 | 3.0 | 2680 | $3,995 | $1.49 | 26d | 1 | 0.69mi |
| 3020 Nori Shores Dr Katy, TX | 5.0 | 2.5 | 2408 | $3,995 | $1.66 | 26d | 1 | 0.73mi |
| 6427 Seafoam Lake Dr Katy, TX | 4.0 | 4.0 | 2479 | $3,000 | $1.21 | 0d | 1 | 0.75mi |
| 3076 Dylan Skyland Dr Katy, TX | 4.0 | 2.5 | 2240 | $3,395 | $1.52 | 26d | 1 | 0.76mi |
| 3056 Sea Turtle Dr Katy, TX | 4.0 | 2.0 | 1500 | $2,200 | $1.47 | 45d | 1 | 0.79mi |
| 3104 Nori Shores Dr Katy, TX | 5.0 | 2.5 | 1947 | $3,695 | $1.90 | 5d | 1 | 0.92mi |
| 3084 Fantasy Terrace Dr Katy, TX | 4.0 | 2.0 | 2085 | $2,325 | $1.12 | 14d | 1 | 0.92mi |
| 3072 Fantasy Terrace Dr Katy, TX | 4.0 | 2.0 | 2279 | $2,550 | $1.12 | 23d | 1 | 0.94mi |
| 3081 Fantasy Terrace Dr Katy, TX | 4.0 | 2.0 | 1670 | $2,275 | $1.36 | 26d | 1 | 0.95mi |
| 1495 Twilight Green Dr Katy, TX | 3.0 | 2.5 | 2000 | $2,400 | $1.20 | 45d | 1 | 0.98mi |
| 3053 Fantasy Terrace Dr Katy, TX | 4.0 | 2.0 | 2085 | $2,440 | $1.17 | 17d | 1 | 0.98mi |
| 3064 Dawn Sound Dr Katy, TX | 3.0 | 2.0 | 1464 | $1,950 | $1.33 | 45d | 1 | 0.99mi |
| 3041 Colusa Ridge Dr Katy, TX | 4.0 | 2.5 | 2263 | $2,500 | $1.10 | 14d | 1 | 1.03mi |
| 3057 Majestic Sunrise Dr Katy, TX | 4.0 | 2.0 | 1644 | $2,252 | $1.37 | 26d | 1 | 1.04mi |
| 3083 Wild Dunes Dr Katy, TX | 3.0 | 2.0 | 1538 | $2,185 | $1.42 | 14d | 1 | 1.05mi |
| 3071 Wild Dunes Dr Katy, TX | 3.0 | 2.0 | 1538 | $2,164 | $1.41 | 26d | 1 | 1.05mi |
| 3048 Majestic Sunrise Dr Katy, TX | 4.0 | 2.0 | 1670 | $2,275 | $1.36 | 26d | 1 | 1.07mi |
| 3020 Wild Dunes Dr Katy, TX | 4.0 | 2.0 | 1776 | $2,355 | $1.33 | 14d | 1 | 1.07mi |
| 3124 Wild Dunes Dr Katy, TX | 4.0 | 2.0 | 1776 | $2,330 | $1.31 | 26d | 1 | 1.09mi |
| 3112 Wild Dunes Dr Katy, TX | 4.0 | 2.0 | 1776 | $2,330 | $1.31 | 26d | 1 | 1.09mi |
| 3136 Wild Dunes Dr Katy, TX | 4.0 | 2.0 | 1776 | $2,355 | $1.33 | 14d | 1 | 1.09mi |
| 3037 Wild Dunes Dr Katy, TX | 3.0 | 2.0 | 1538 | $2,164 | $1.41 | 26d | 1 | 1.10mi |
| 3004 Majestic Sunrise Dr Katy, TX | 3.0 | 2.0 | 1474 | $1,942 | $1.32 | 45d | 1 | 1.12mi |
| 26811 Prairie Smoke Ln Katy, TX | 4.0 | 2.0 | 1656 | $2,250 | $1.36 | 45d | 1 | 1.16mi |
| 27035 Beacon Glen Dr Katy, TX | 2.0–4.0 | 2.0–3.0 | 1890 | $3,949 | $2.09 | 0d | 17 | 1.20mi |
| 26642 Prairie Smoke Ln Katy, TX | 3.0 | 2.0 | 1949 | $2,300 | $1.18 | 45d | 1 | 1.27mi |
| 3004 Fall Gold Ln Katy, TX | 5.0 | 3.0 | 2156 | $3,850 | $1.79 | 45d | 1 | 1.28mi |
| 3004 Fall Gold Ln Katy, TX | 5.0 | 3.0 | 2156 | $2,599 | $1.21 | 0d | 1 | 1.28mi |
| 5835 Big Bluestem Ln Katy, TX | 5.0 | 3.0 | 2890 | $2,406 | $0.83 | 45d | 1 | 1.30mi |
| 6758 Sunset Velvet Dr Katy, TX | 3.0 | 2.0 | 1580 | $2,350 | $1.49 | 45d | 1 | 1.43mi |
HOA detail
- Monthly dues
- $100 · $1,200/yr
- Likely covers
- waterpool
Listing history 22 events
-
2026-06-21days on market $299,888 Active 52 DOM
-
2026-06-18days on market $299,888 Active 49 DOM
-
2026-06-17days on market $299,888 Active 48 DOM
-
2026-06-16days on market $299,888 Active 47 DOM
-
2026-06-15days on market $299,888 Active 46 DOM
-
2026-06-13days on market $299,888 Active 44 DOM
-
2026-06-09days on market $299,888 Active 40 DOM
-
2026-06-08days on market $299,888 Active 39 DOM
-
2026-06-07pricedays on market $299,888 Active 38 DOM
-
2026-06-04days on market $309,900 Active 35 DOM
-
2026-06-03days on market $309,900 Active 34 DOM
-
2026-06-02days on market $309,900 Active 33 DOM
-
2026-06-01days on market $309,900 Active 32 DOM
-
2026-05-31days on market $309,900 Active 31 DOM
-
2026-04-30$309,900 Active 890-char remark
-
2026-04-30historical
-
2026-03-10price $309,900
-
2026-02-19$319,888 Active
-
2025-01-18historical
-
2024-09-05price $403,000
-
2024-07-19$415,000 Active
-
2023-03-17soldstatus
ⓘ Source: listings_history table (triggers on properties + properties_extension) + one-shot
backfill from property_details.listing_events for pre-trigger history.
Tax reassessment forecast TX · Resets to sale price
- Current annual tax
- $10,872 · $906/mo
- Projected year-2 tax
- $10,872 · $906/mo
- Expected delta
- $0/yr ($0/mo · 0.0%)
ⓘ Screening estimate from a state-policy table — verify with the county assessor before closing.
Climate risk First Street
- Flood 5/10 Major FEMA zone X (unshaded) · 65% chance over 30 yrs
- Wildfire 4/10 Moderate
- Heat 9/10 Extreme 7 d/yr ≥111°F today · 22 d/yr by 30 yrs out
- Wind 9/10 Extreme 99% chance of damaging wind over 30 yrs
- Air quality 2/10 Low 1 unhealthy d/yr today · 1 by 30 yrs out
Nearby sold comps map
Loading sold comps map…
Walkable amenities ~0.75 mi
Loading nearby amenities…
Taxation est. · year 1
- Rental income
- $34,072
- − Mortgage interest
- −$16,798
- − Property taxes
- −$10,872
- − Insurance
- −$1,499
- − Repairs & maintenance
- −$2,726
- − Management
- −$2,726
- − HOA
- −$1,200
- − Depreciation
- −$8,724
- Taxable loss
- −$10,474
- Est. tax savings @ 24.0%
- +$2,514
- After-tax cash flow
- $-3,013/yr
For passive investors: Depreciation is non-cash, so a rental often shows a tax loss while cash-flowing — sheltering income. Rental losses are passive: they offset passive income freely, and up to $25,000/yr can offset ordinary (W-2) income if you actively participate and your MAGI is under $100k (phasing out to $0 by $150k); unused losses carry forward. On sale, claimed depreciation is recaptured at up to 25%, and gains may owe capital-gains tax (a 1031 exchange can defer both). Figures are a year-1 estimate at your 24.0% rate — not tax advice; consult a CPA.
Condition & rehab AI · 12 photos
This modern 2-story home in Sunterra Subdivision is in excellent condition with recent upgrades and a beautiful lake view. It's move-in ready with a good ROI potential.
Value-add opportunities
- Both landscaping — enhances curb appeal and adds value
- Both paint — refreshes interior and exterior spaces
Renovation cost estimate screening
Value-add ROI direction
- Both landscaping — enhances curb appeal and adds value ↑
- Both paint — refreshes interior and exterior spaces ↑
ⓘ Cost ranges are severity-bucket heuristics (US national rule-of-thumb). Get contractor quotes + a written scope before underwriting a rehab budget.
Schools (NCES district)
- District
- Katy ISD
- NCES district ID
- 4825170
- Math proficiency
- 61% ▼ -7.00%
- Reading proficiency
- 63% ▼ -3.00%
- Median HH income
- $90,312
- Composite
- 56.59/100
- National rank
- #1146
- State rank
- #29 of 826 in TX
Livability — Katy
- Score
- 76/100
- State rank
- #111
- US rank
- #3613
Category grades
Schools grade is shown separately in the Schools card above.
Census & demographics
- County
- Harris County · 4,702,590 people
- City population
- 413,575
- Metro
- Houston-The Woodlands-Sugar Land, TX
- Population (ZIP)
- 71,484
- Household income
- $118,464
- Rent vs Own
- Severe rent burden
- 913.0
Population outlook (Harris County) Hauer SSP2
- Today (2025)
- 5,571,493 people
- By 2030
- 6,089,821 · +9.3%
- By 2040
- 7,142,806 · +28.2%
- By 2050
- 8,185,864 · +46.9%
- By 2075
- 10,574,329 · +89.8%
- By 2100
- 12,109,958 · +117.4%
Race, ethnicity, and origin ACS 2023
- Neighborhood character
- Highly diverse neighborhood (Simpson 0.73)
- Race & ethnicity
- White 36% Hispanic / Latino 33% Two or more races 16% Black 15% Asian 12%
- Hispanic origin (detail)
- Mexican 20%
- Common ancestry
- Lithuanian 2% Slovak 1% Italian 1%
- Foreign-born
- 21% · Canada, Vietnam, Jamaica
- Languages at home
- 64% English-only · Spanish 22% Vietnamese 5% French/Haitian/Cajun 4%
Political lean MEDSL · Harris
- 2024 margin
- Lean D (+5.5) · D 52.0% · R 46.4% · Other 1.6%
- 2008→2024 swing
- +3.9pp toward D · 2008: 1.6pp · 2024: 5.5pp
- All cycles
- 2024: D+5.5 2020: D+13.3 2016: D+12.4 2012: D+0.1 2008: D+1.6
Not yet ingested
- Civics
- —
Market trends
- HPI YoY
- ▼ -140.65%
- Current HPI
- 233.1683
- Rent YoY
- ▼ -0.80%
- Metro
- Houston-The Woodlands-Sugar Land, TX
- State GDP YoY
- ▲ 3.95%
- F500 in state
- 110
Industry mix (Fortune 500 HQ in TX)
| Industry | F500 HQs | Revenue |
|---|---|---|
| Energy | 16 | $1,198B |
|
||
| Technology | 5 | $198B |
|
||
| Engineering / Construction | 4 | $72B |
|
||
| Energy Services | 3 | $60B |
|
||
| Utilities | 3 | $41B |
|
||
| Healthcare | 2 | $330B |
|
||
Price history
-27.7% since first listed9 events — show timeline
- 2026-06-04 Price Changed $299,888 HARMLS
- 2026-04-30 Listing Removed — HARMLS
- 2026-04-30 Listed $309,900 HARMLS
- 2026-03-10 Price Changed $309,900 HARMLS
- 2026-02-19 Listed $319,888 HARMLS
- 2025-01-18 Listing Removed — HARMLS
- 2024-09-05 Price Changed $403,000 HARMLS
- 2024-07-19 Listed $415,000 HARMLS
- 2023-03-17 Sold (Public Records) — Public Records
Property tax history
+177.7%/yrLatest (2025): $10,872 · +3.9% YoY. Source: county tax records.
Cash-flow waterfall
monthlySold comps — $/sqft
last 12 mo · ≤1 miLoading sold comps…