6046 National Blvd #446 · Ave Maria, FL
Flood risk 3/10 · Minor
- FEMA flood zone
- AH
- Chance of flooding over 30 yrs
- 0.2%
- Est. flood insurance / yr
- $1,142 – $2,507
Fire risk 5/10 · Moderate
- Est. fire insurance / yr
- $947 – $1,759
Heat risk 9/10 · Severe
- Hot days now (above 112°F)
- 6 days/yr
- Hot days in 30 yrs
- 23 days/yr
Wind risk 10/10 · Severe
- Chance of severe wind over 30 yrs
- 99.0%
Air-quality risk 2/10 · Minimal
- Unhealthy air days now
- 0 days/yr
- Unhealthy air days in 30 yrs
- 1 days/yr
Risk factors via First Street. Map © Google.
Why this score? — see what drove the B- grade
The composite is a weighted blend of 9 inputs, each scored 0–100. Each bar is that input's sub-score; the figure is the points it added to the 100-point composite (weight × sub-score).
- Cash flow +22.7/30.0
- 1% rule +10.0/10.0
- ARV discount +7.5/15.0
- DSCR +7.3/10.0
- Schools +5.0/10.0
- Appreciation +4.5/10.0
- Rent growth +3.2/5.0
- Livability +2.5/5.0
- Condition / age +2.5/5.0
$249,900
🖨 Deal sheet 📄 Offer letter ✓ Due diligence
Listing remarks
Golf Membership Included | Upgraded 4th floor Birkdale Plan 6046 National Blvd. Unit 446 Welcome to this beautifully finished 4th-floor end-unit Birkdale condo located in the sought-after National Golf & Country Club at Ave Maria. Offering 2 bedrooms, 2 bathrooms, and 1,154 sq. ft. of thoughtfully designed living space, this home combines comfort, elegance, and a premier golf lifestyle. Inside, an open and airy layout is enhanced by stylish tile flooring, recessed lighting, and tasteful fixtures throughout. The gourmet kitchen features stainless steel appliances, an electric cooktop, wall oven, center island, breakfast nook, designer lighting, tiled lanai flooring, and a custom ba
Key facts
- Gourmet kitchen
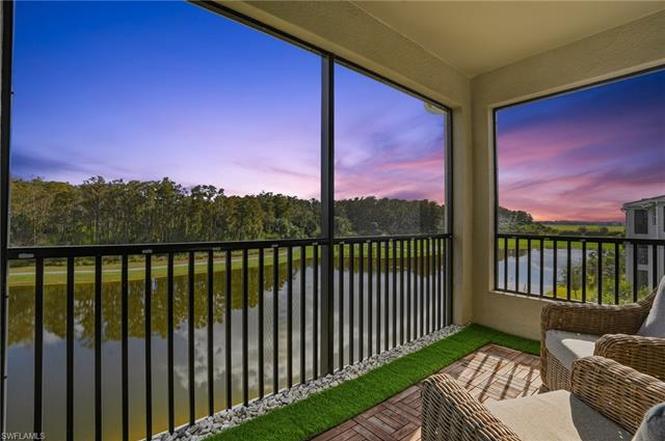
- Sweeping lake views
- Private lanai
Tags
Property features AI
Finance
- Other: Property is in a multi-unit building (4 units per floor; 30 units in the building; single-floor unit)
- Financial info: Total annual recurring community fees noted; One-time fees for club membership and other community requirements
- HOA & community: Mandatory HOA with professional management; Quarterly HOA and master HOA fees (separate fees apply); Quarterly mandatory club fee; one-time club and other fees apply; Condo fee billed quarterly; Maintenance covers cable, golf course, internet/Wi‑Fi, irrigation water, lawn/land maintenance, legal/accounting, management, exterior pest control, recreation facilities, repairs, reserves, street lights and street maintenance; Community is gated and golf-bundled with tennis facilities; Amenities include clubhouse, community pool and spa, fitness center, full-service spa, restaurant, golf course, pickleball, tennis, bocce, putting green, picnic/BBQ areas, business center, community park, sidewalks and underground utilities
Exterior
- Parking: 1 assigned parking space; Detached garage (1 car); Detached carport (1 space)
- Security: Impact-resistant storm protection
- Utilities: Central water; Central sewer; Cable available; Reclaimed irrigation / lake/canal irrigation
- Home design: Residential property; Mid-rise building (4–7 stories); Traditional styling; Rear exposure faces south; Built in 2022; Concrete block construction
- Construction: Concrete block construction; Tile roof; Built in 2022
- Exterior features: Tile roof; Impact-resistant windows and doors; Stone exterior finish; Lake frontage / lake view; Golf course view; Zero lot line
Interior
- Kitchen: Kitchen island; Pantry; Electric cooktop; Range; Self-cleaning oven; Microwave; Dishwasher; Disposal; Refrigerator/ice maker; Freezer
- Bedrooms: 2 bedrooms (split bedroom floor plan)
- Flooring: Carpet; Tile
- Bathrooms: 2 full bathrooms; Primary bath with shower (no tub)
- Heating & cooling: Central electric heat; Central electric air conditioning
- Interior features: Built-in cabinets; Cable prewire; Fire sprinkler system; Foyer; High-speed internet available; Pantry; Smoke detectors; Walk-in closet; Guest bath; Guest room; Home office; Screened lanai/porch; Common elevator
- Laundry & utility: Washer and dryer in residence
Neighborhood map
What this means for you Summary
Snapshot
- This is a 2-bed/2.0-bath condo listed at $250k.
Deal economics
- At list price, monthly cash flow is $276 ($3k/yr) — positive.
- The deal already cash-flows at list — no discount required.
- Meets the 1% rule at list price ($4k rent vs $250k).
- Recommended offer: $220k (12.0% below list) — sets the bar for market timing.
Location & tenants
- Location reads: area grade B — affects rentability + tenant quality, not the cash-flow math above.
- Collier (suburban): math 60% / reading 56% proficiency, ranked #16 of 73 in FL (top 22%) — acceptable for families but not a draw, mixed tenant base, ~2y average lease.
- Market conditions: Rents rising (+3.0%/yr); 449 active listings in the ZIP; 40 comparable units currently listed for rent nearby; rentals at typical pace (median 24d on market — plan ~3-4 weeks tenant-placement turnaround); 3,520 units permitted in Collier County in 2024 (959 in 5+ unit buildings).
- At $3,791/mo this rent would consume 73% of the median local household income ($62k/yr) (locally 1093% of renters already pay >50% of income on rent) — very limited rent-growth headroom before tenants either downsize or default.
Forward outlook
- Local home prices are declining (-1.1%/yr); year-one equity from $2k of loan paydown is wiped out by about $3k of value loss. Plan a longer hold.
- Collier County population projected at +30% by 2050 — long-run rental-demand tailwind backs the buy-and-hold thesis.
Negotiation context
- It's been on market 206 days — a 12% lower offer ($220k) is reasonable based on typical stale-listing flexibility.
- 4 sale attempts; this cycle's ask has dropped $30k (11%) from the opening price — seller is motivated, your offer sets the floor, not the list.
Risks & watch-outs
- Watch-outs: flood insurance adds $152/mo; HOA is 20% of rent.
- Climate carrying-cost: in FEMA flood zone AH (mandatory federal flood insurance); severe wind risk, 99% chance of damaging wind over 30y; moderate wildfire risk; extreme-heat days projected 6→23/yr by 2055 (HVAC capex compounding) — expect insurance premiums to compound above CPI over the hold.
Questions for the listing agent
- It's been on market 206 days. Have you received any prior offers? Is the seller open to a 12% concession, seller financing, or rate buy-down credit?
- What's the actual annual flood-insurance premium (NFIP or private), and is the property in a SFHA with mandatory coverage?
- What does the HOA fee cover, when was the last increase, and are there any pending special assessments or reserve-fund shortfalls?
- Any open or pending special assessments — roof, HVAC, plumbing, elevator, façade? What's the per-unit balance and payoff schedule, and is the seller paying it off at close or rolling it to the buyer?
- Why hasn't it sold? Are there any deal-killer items the seller is aware of (foundation, flood, title, zoning, code violations)?
- Is there a deadline driving the sale (1031 exchange, divorce, estate, relocation)? That informs how much negotiation room exists.
- What's the average days-on-market for RENTAL listings here right now (not sales)? A rising rental-DOM trend means longer vacancies and softer asking-rent achievability than the comps imply.
- What's the recent tenant-quality profile in this submarket — average credit score on applications, eviction rate, late-payment / NSF rate, and stable-employment percentage? A property-management company in the area should have these aggregated.
- How much new apartment / multifamily construction is in the pipeline within 1–3 miles? Heavy new supply (>2% of stock underway) typically softens rents 12–24 months out; light construction supports rent growth.
Investment metrics
- 1% rule
- 1.52% ✓
- Cap rate
- 8.35%
- Cash-on-cash
- 7.34%
- DSCR
- 1.33
- GRM
- 5.5
CMA / ARV
No comps found within radius.
Projected returns pro-forma
-1.05% appreciation · 2.95% rent growth · sell at horizon
- IRR
- -0.4%
- Equity multiple
- 0.98×
- Total profit
- $-1,316
- Equity at exit
- $59,745
- IRR
- 6.4%
- Equity multiple
- 1.62×
- Total profit
- $43,200
- Equity at exit
- $62,245
Cash invested: $69,972 (down + closing). Projections, not guarantees.
Landlord ↔ Tenant lean methodology
- Overall (STATE)
- 87 Strongly Landlord-Friendly
- State Florida
- 87 Strongly Landlord-Friendly · R+3
- County
- — inherits STATE
- City
- — inherits STATE
ZIP-level market 34142
- Home prices YoY
- -0.5%
- Rents YoY
- 3.0%
- Active inventory
- 449
- Price-to-rent
- 5.5×
Monthly cashflow live
- Estimated rent
- $3,791 high interval (Pro) →
- Mortgage (P&I)
- −$1,311
- Tax from tax record
- −$379 /mo · $4,545/yr
- Insurance
- −$104
- Flood insurance flood zone
- −$152 /mo · $1,824/yr
- HOA
- −$774
- Vacancy / Maint / Mgmt
- −$796
- Net cashflow
- $276
Break-even live
UW: 25.0% down · 7.5% · 30yr · 1.5% tax · 5.0% vac · 8.0% maint · 8.0% mgmt
Financing live
Cash to close
- Down payment
- $62,475
- Closing costs
- $7,497
- Reserves months
- —
- Total cash needed
- —
Loan-product check · same deal, 3 products live
Conventional
25% down · 7.5% · 30yr
- Down + closing
- —
- Monthly P&I
- —
- Monthly cashflow
- —
- DSCR
- —
- Eligible?
- —
Personal DTI + credit; lowest rate.
DSCR
20% down · 8.5% · 30yr
- Down + closing
- —
- Monthly P&I
- —
- Monthly cashflow
- —
- DSCR
- —
- Eligible?
- —
No personal income docs; deal must DSCR.
Hard money
10% down · 12.0% · 12mo
- Down + closing
- —
- Monthly P&I
- —
- Monthly cashflow
- —
- DSCR
- —
- Eligible?
- —
Short-term bridge; refi at stabilization.
Rent comps 40 comps
| Address | Beds | Baths | Sqft | Rent | $/sqft | DOM | Units | Dist |
|---|---|---|---|---|---|---|---|---|
| 6034 National Blvd Ave Maria, FL | 2.0 | 2.0 | 1137 | $4,046 | $3.56 | 13d | 3 | 0.03mi |
| 6046 National Blvd Ave Maria, FL | 2.0 | 2.0 | 1154 | $4,395 | $3.81 | 23d | 2 | 0.03mi |
| 6058 National Blvd #343 Ave Maria, FL | 2.0 | 2.0 | 1194 | $4,000 | $3.35 | 23d | 1 | 0.07mi |
| 6058 National Blvd #335 Ave Maria, FL | 2.0 | 2.0 | 1120 | $5,795 | $5.17 | 13d | 1 | 0.08mi |
| 6058 National Blvd Ave Maria, FL | 2.0–3.0 | 2.0 | 1210 | $2,995 | $2.47 | 23d | 2 | 0.08mi |
| 6082 National Blvd Ave Maria, FL | 2.0 | 2.0 | 1366 | $4,145 | $3.03 | 23d | 2 | 0.18mi |
| 5410 Double Eagle Cir #2222 Ave Maria, FL | 2.0 | 2.0 | 1355 | $2,395 | $1.77 | 23d | 1 | 0.25mi |
| 5807 Double Eagle Cir #4631 Ave Maria, FL | 3.0 | 2.0 | 1301 | $5,695 | $4.38 | 23d | 1 | 0.26mi |
| 5835 Double Eagle Cir Unit 4742 Ave Maria, FL | 2.0 | 2.0 | 1154 | $5,795 | $5.02 | 23d | 1 | 0.26mi |
| 5428 Double Eagle Cir #2517 Ave Maria, FL | 2.0 | 2.0 | 1355 | $2,695 | $1.99 | 23d | 1 | 0.27mi |
| 6047 Ellerston Way Unit 1 Ave Maria, FL | 2.0 | 2.0 | 1366 | $2,500 | $1.83 | 23d | 1 | 0.29mi |
| 5835 Double Eagle CIR #4714 Ave Maria, FL | 2.0 | 2.0 | 1120 | $1,895 | $1.69 | 23d | 1 | 0.31mi |
| 5629 Double Eagle Cir #4217 Ave Maria, FL | 2.0 | 2.0 | 1154 | $5,795 | $5.02 | 23d | 1 | 0.31mi |
| 6039 Ellerston WAY #2017 Ave Maria, FL | 2.0 | 2.0 | 1355 | $6,295 | $4.65 | 23d | 1 | 0.31mi |
| 5651 Double Eagle Cir #4316 Ave Maria, FL | 2.0 | 2.0 | 1154 | $5,495 | $4.76 | 23d | 1 | 0.31mi |
| 5629 Double Eagle Cir #4218 Ave Maria, FL | 3.0 | 2.0 | 1301 | $6,295 | $4.84 | 23d | 1 | 0.31mi |
| 5651 Double Eagle Cir #4338 Ave Maria, FL | 2.0 | 2.0 | 1301 | $6,295 | $4.84 | 23d | 1 | 0.31mi |
| 5835 Double Eagle Cir #4726 Ave Maria, FL | 2.0 | 2.0 | 1154 | $2,095 | $1.82 | 13d | 1 | 0.31mi |
| 5629 Double Eagle Cir #4223 Ave Maria, FL | 2.0 | 2.0 | 1154 | $2,395 | $2.08 | 23d | 1 | 0.31mi |
| 5715 Double Eagle Cir #4416 Ave Maria, FL | 2.0 | 2.0 | 1154 | $2,100 | $1.82 | 23d | 1 | 0.31mi |
| 5427 Double Eagle Cir Ave Maria, FL | 2.0 | 2.0 | 1355 | $2,995 | $2.21 | 23d | 1 | 0.32mi |
| 5427 Double Eagle Cir #2812 Ave Maria, FL | 2.0 | 2.0 | 1355 | $2,395 | $1.77 | 13d | 1 | 0.32mi |
| 5433 Double Eagle Cir #2915 Ave Maria, FL | 2.0 | 2.0 | 1366 | $6,295 | $4.61 | 21d | 1 | 0.35mi |
| 5433 Double Eagle Cir Ave Maria, FL | 2.0 | 2.0 | 1366 | $3,295 | $2.41 | 23d | 1 | 0.36mi |
| 5835 Double Eagle Cir Ave Maria, FL | 2.0 | 2.0 | 1154 | $5,495 | $4.76 | 23d | 1 | 0.38mi |
| 5478 Double Eagle Cir #3515 Ave Maria, FL | 2.0 | 2.0 | 1355 | $2,395 | $1.77 | 23d | 1 | 0.39mi |
| 5807 Double Eagle Cir #4635 Ave Maria, FL | 2.0 | 2.0 | 1120 | $5,195 | $4.64 | 23d | 1 | 0.42mi |
| 5807 Double Eagle Cir Ave Maria, FL | 3.0 | 2.0 | 1301 | $2,995 | $2.30 | 23d | 1 | 0.43mi |
| 5807 Double Eagle Cir #4621 Ave Maria, FL | 3.0 | 2.0 | 1301 | $6,295 | $4.84 | 23d | 1 | 0.43mi |
| 5466 Double Eagle Cir #3425 Ave Maria, FL | 2.0 | 2.0 | 1355 | $5,995 | $4.42 | 23d | 1 | 0.44mi |
| 5749 Double Eagle Cir #4528 Ave Maria, FL | 3.0 | 2.0 | 1301 | $6,295 | $4.84 | 21d | 1 | 0.47mi |
| 5749 Double Eagle Cir #4515 Ave Maria, FL | 2.0 | 2.0 | 1120 | $1,995 | $1.78 | 21d | 1 | 0.47mi |
| 5749 Double Eagle Cir #4537 Ave Maria, FL | 2.0 | 2.0 | 1154 | $2,100 | $1.82 | 21d | 1 | 0.47mi |
| 5749 Double Eagle Cir Ave Maria, FL | 3.0 | 2.0 | 1301 | $2,995 | $2.30 | 23d | 1 | 0.47mi |
| 5715 Double Eagle Cir #4432 Ave Maria, FL | 2.0 | 2.0 | 1154 | $5,795 | $5.02 | 21d | 1 | 0.48mi |
| 5715 Double Eagle Cir #4413 Ave Maria, FL | 2.0 | 2.0 | 1154 | $5,495 | $4.76 | 21d | 1 | 0.48mi |
| 5715 Double Eagle Cir Ave Maria, FL | 2.0 | 2.0 | 1120 | $3,295 | $2.94 | 23d | 1 | 0.50mi |
| 5454 Double Eagle Cir #3325 Ave Maria, FL | 2.0 | 2.0 | 1355 | $2,495 | $1.84 | 23d | 1 | 0.50mi |
| 5479 Double Eagle Cir #3626 Ave Maria, FL | 2.0 | 2.0 | 1154 | $2,200 | $1.91 | 13d | 1 | 0.51mi |
| 5491 Double Eagle Cir #3728 Ave Maria, FL | 3.0 | 2.0 | 1301 | $2,195 | $1.69 | 13d | 1 | 0.53mi |
HOA detail condo
- Monthly dues
- $774 · $9,288/yr
- Likely covers
- electric
- Assessments
- None detected in remarks — confirm with the listing agent.
Listing history 23 events
-
2026-06-18days on market $249,900 Active 206 DOM
-
2026-06-17days on market $249,900 Active 205 DOM
-
2026-06-16days on market $249,900 Active 204 DOM
-
2026-06-15days on market $249,900 Active 203 DOM
-
2026-06-10days on market $249,900 Active 198 DOM
-
2026-06-09days on market $249,900 Active 197 DOM
-
2026-06-08days on market $249,900 Active 196 DOM
-
2026-06-07days on market $249,900 Active 195 DOM
-
2026-06-03days on market $249,900 Active 191 DOM
-
2026-06-02days on market $249,900 Active 190 DOM
-
2026-06-01days on market $249,900 Active 189 DOM
-
2026-05-31days on market $249,900 Active 188 DOM
-
2026-05-30days on market $249,900 Active 187 DOM
-
2026-05-09status Active
-
2026-05-06historical
-
2026-03-13price $249,900
-
2026-03-05price $259,000
-
2025-11-21$279,999 Active
-
2025-08-16historical $2,400
-
2025-07-09$2,400
-
2025-07-04historical
-
2025-04-29price $259,000
-
2025-01-12$273,900 Active
ⓘ Source: listings_history table (triggers on properties + properties_extension) + one-shot
backfill from property_details.listing_events for pre-trigger history.
Tax reassessment forecast FL · Resets to sale price
- Current annual tax
- $4,545 · $379/mo
- Projected year-2 tax
- $4,545 · $379/mo
- Expected delta
- $0/yr ($0/mo · 0.0%)
ⓘ Screening estimate from a state-policy table — verify with the county assessor before closing.
Climate risk First Street
- Flood 3/10 Moderate FEMA zone AH · 20% chance over 30 yrs
- Wildfire 5/10 Major
- Heat 9/10 Extreme 6 d/yr ≥112°F today · 23 d/yr by 30 yrs out
- Wind 10/10 Extreme 99% chance of damaging wind over 30 yrs
- Air quality 2/10 Low 0 unhealthy d/yr today · 1 by 30 yrs out
Nearby sold comps map
Loading sold comps map…
Walkable amenities ~0.75 mi
Loading nearby amenities…
Taxation est. · year 1
- Rental income
- $45,497
- − Mortgage interest
- −$13,998
- − Property taxes
- −$4,545
- − Insurance
- −$3,074
- − Repairs & maintenance
- −$3,640
- − Management
- −$3,640
- − HOA
- −$9,288
- − Depreciation
- −$7,270
- Taxable income
- $43
- Est. tax owed @ 24.0%
- −$10
- After-tax cash flow
- $3,300/yr
For passive investors: Depreciation is non-cash, so a rental often shows a tax loss while cash-flowing — sheltering income. Rental losses are passive: they offset passive income freely, and up to $25,000/yr can offset ordinary (W-2) income if you actively participate and your MAGI is under $100k (phasing out to $0 by $150k); unused losses carry forward. On sale, claimed depreciation is recaptured at up to 25%, and gains may owe capital-gains tax (a 1031 exchange can defer both). Figures are a year-1 estimate at your 24.0% rate — not tax advice; consult a CPA.
Schools (NCES district)
- District
- Collier
- NCES district ID
- 1200330
- Math proficiency
- 60% ▼ -4.00%
- Reading proficiency
- 56% ▼ -2.00%
- Median HH income
- $58,275
- Composite
- 50.23/100
- National rank
- #1892
- State rank
- #16 of 73 in FL
Livability — Ave Maria
No livability data for this city. (Only ~50 U.S. cities are tracked.)
Census & demographics
- Census place
- Ave Maria, FL
- County
- Collier County · 396,295 people
- Metro
- Naples-Marco Island, FL
- Population (ZIP)
- 35,149
- Household income
- $62,333
- Rent vs Own
- Severe rent burden
- 1093.0
Population outlook (Collier County) Hauer SSP2
- Today (2025)
- 420,858 people
- By 2030
- 450,054 · +6.9%
- By 2040
- 502,232 · +19.3%
- By 2050
- 544,932 · +29.5%
- By 2075
- 627,203 · +49.0%
- By 2100
- 659,015 · +56.6%
Race, ethnicity, and origin ACS 2023
- Neighborhood character
- Majority Hispanic (63%)
- Race & ethnicity
- Hispanic / Latino 63% Two or more races 39% Black 19% White 16% Native American 7%
- Hispanic origin (detail)
- Mexican 43% Puerto Rican 3% Cuban 2% Dominican 1%
- Common ancestry
- Hispanic 8% Slovak 1% Serbian 1%
- Foreign-born
- 32% · Canada, Jamaica
- Languages at home
- 34% English-only · Spanish 53% French/Haitian/Cajun 12%
Political lean MEDSL · Collier
- 2024 margin
- Solid R (+33.1) · D 33.1% · R 66.2%
- 2008→2024 swing
- -10.6pp toward R · 2008: -22.5pp · 2024: -33.1pp
- All cycles
- 2024: R+33.1 2020: R+24.7 2016: R+26.0 2012: R+30.1 2008: R+22.5
Not yet ingested
- Civics
- —
Market trends
- HPI YoY
- ▼ -1.05%
- Current HPI
- 226.9105
- Rent YoY
- ▲ 2.95%
- Metro
- Naples-Marco Island, FL
- State GDP YoY
- ▲ 3.28%
- F500 in state
- 36
Industry mix (Fortune 500 HQ in FL)
| Industry | F500 HQs | Revenue |
|---|---|---|
| Industrial Technology | 2 | $29B |
|
||
| Insurance | 2 | $17B |
|
||
| Retail | 1 | $60B |
|
||
| Technology Distribution | 1 | $58B |
|
||
| Homebuilding | 1 | $35B |
|
||
| Technology Manufacturing | 1 | $35B |
|
||
Price history
-8.8% since first listed10 events — show timeline
- 2026-05-09 Relisted — NAPLESMLS
- 2026-05-06 Listing Removed — NAPLESMLS
- 2026-03-13 Price Changed $249,900 NAPLESMLS
- 2026-03-05 Price Changed $259,000 NAPLESMLS
- 2025-11-21 Listed $279,999 NAPLESMLS
- 2025-08-16 Rental Removed $2,400 Avail
- 2025-07-09 Listed for Rent $2,400 Avail
- 2025-07-04 Listing Removed — NAPLESMLS
- 2025-04-29 Price Changed $259,000 NAPLESMLS
- 2025-01-12 Listed $273,900 NAPLESMLS
Property tax history
+39.2%/yrLatest (2025): $4,545 · +6.4% YoY. Source: county tax records.
Cash-flow waterfall
monthlySold comps — $/sqft
last 12 mo · ≤1 miLoading sold comps…