3850 Atlantic Ave #203 · San Bernardino, CA
Flood risk 1/10 · Minimal
- FEMA flood zone
- X (unshaded)
- Chance of flooding over 30 yrs
- 0.0%
- Est. flood insurance / yr
- $507 – $1,088
Fire risk 8/10 · Major
- Est. fire insurance / yr
- $659 – $1,223
Heat risk 8/10 · Major
- Hot days now (above 101°F)
- 4 days/yr
- Hot days in 30 yrs
- 13 days/yr
Wind risk 1/10 · Minimal
- Chance of severe wind over 30 yrs
- —
Air-quality risk 10/10 · Severe
- Unhealthy air days now
- 29 days/yr
- Unhealthy air days in 30 yrs
- 35 days/yr
Risk factors via First Street. Map © Google.
Why this score? — see what drove the B grade
The composite is a weighted blend of 9 inputs, each scored 0–100. Each bar is that input's sub-score; the figure is the points it added to the 100-point composite (weight × sub-score).
- Cash flow +30.0/30.0
- ARV discount +12.9/15.0
- 1% rule +10.0/10.0
- DSCR +10.0/10.0
- Rent growth +3.2/5.0
- Schools +3.1/10.0
- Livability +3.0/5.0
- Condition / age +2.5/5.0
- Appreciation +0.0/10.0
$135,000
🖨 Deal sheet 📄 Offer letter ✓ Due diligence
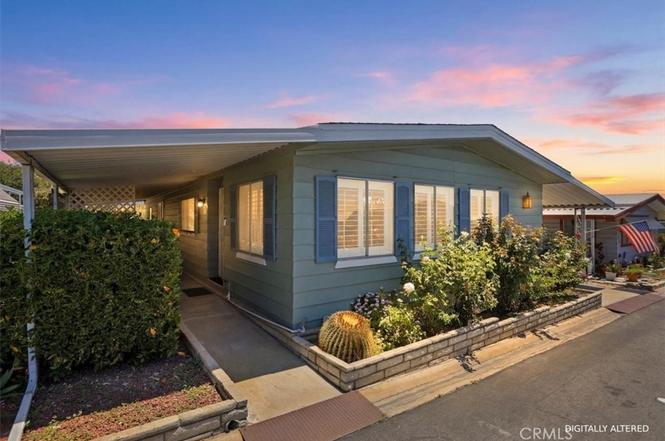
Listing remarks MLS
#203 Updated & Move in Ready home in a premier senior 55 or better community! 1977 Sunny Home, Approx. 1248 sqft 2-bedroom, 2-bathroom home. This Cozy home features a spacious living room & dining area, a bright kitchen with updated white cabinets & newer vinyl, includes an electric cook top stove, separate oven, dishwasher, fridge, and a breakfast bar. Laundry area includes both washer & dryer, with plenty storage shelves for storage. Guest bedroom features a spacious closets & adjoins to the Jack & Jill guest bathroom with enclosed tub. The master suite features a spacious closet, with a sliding glass door that exits to your covered patio, perfect to enjoy your morning paper. You will love the large in suite master bath, featuring a linen closet, & vanity area, with tub/ shower combo. The side yard is maintenance free & can be gated for your furry friends, Full length carport, security doors, & shed. Schedule your tour today!
Key facts
- Water filtration
- Plantation shutters
- Move in ready
Tags
Property features AI
Finance
- Other: Park name: Valencia Lea; Manager approval required
- Financial info: Land lease (monthly) — seller provided amount; Rent includes pool
- HOA & community: Senior community; Association amenities include pool, spa, club house, card room, banquet facilities, onsite property management, pet rules (pets permitted with size/number limits)
Exterior
- Parking: Tandem covered carport (attached); Driveway parking; 2 total parking spaces (2 carport spaces)
- Security: Security system; Gated community
- Utilities: District/public water; Public sewer; Natural gas connected; Electricity connected; Water connected
- Home design: Mobile home remains (24 x 52); Double body type; One story; Facing/entry on left side
- Construction: Aluminum construction materials; Shingle/asphalt roof; Concrete block foundation with pier jacks and seismic tie downs; Aluminum skirt
- Exterior features: Covered concrete slab patio; In-ground association spa (community); Association in-ground heated community pool (fenced); Shed (1); Level with street lot; Close to clubhouse; Has view; Paved road
Interior
- Kitchen: Kitchen island; Garbage disposal; Refrigerator; Vented exhaust fan; Water purifier; Double oven; Dishwasher; Electric stove
- Bedrooms: Primary bedroom on main floor; All bedrooms on main floor; Guest/maid's quarters
- Flooring: Vinyl
- Bathrooms: 2 full bathrooms; Main floor full bath; Shower in tub; Grab bars in bathroom(s)
- Heating & cooling: Central air conditioning (electric); Natural gas heating; Forced air / central furnace
- Interior features: Open floor plan; Sliding glass door(s); Plantation shutters; No interior steps; Linen closet/storage; Turnkey condition; One story (entry level 1, entry on left side)
- Laundry & utility: Dedicated laundry room; Washer hookup; Gas and electric dryer hookup; 220V in laundry
Neighborhood map
What this means for you Summary
Snapshot
- This is a 2-bed/2.0-bath manufactured listed at $135k.
Deal economics
- At list price, monthly cash flow is $709 ($9k/yr) — positive.
- The deal already cash-flows at list — no discount required.
- Meets the 1% rule at list price ($2k rent vs $135k).
- Cap rate 12.6% vs local median 3.5% in San Bernardino — top-decile yield for the area; either an underpriced asset or a hidden risk that comps aren't pricing in. Stress-test before assuming the spread holds.
Location & tenants
- Location reads 59/100 on livability (#661 in CA) — a working-class tenant base; expect higher turnover. Strengths: commute A+, housing A; Watch: schools D, employment D, crime F.
- San Bernardino City Unified (urban): math 27% / reading 40% proficiency, ranked #959 of 1,400 in CA (top 68%) — families likely to look elsewhere, expect single-tenant / working-renter base with shorter leases; 81% free/reduced lunch — lower-income household profile, screen leases tightly.
- Market conditions: Rents rising (+2.9%/yr); 147 active listings in the ZIP; 20 comparable units currently listed for rent nearby; rentals at typical pace (median 24d on market — plan ~3-4 weeks tenant-placement turnaround); 45% of comp listings sitting > 30 days — soft ceiling on asking rent; solid renter incomes; 5,458 units permitted in San Bernardino County in 2024 (1,500 in 5+ unit buildings).
Forward outlook
- Local home prices are declining (-3.0%/yr); year-one equity from $933 of loan paydown is wiped out by about $4k of value loss. Plan a longer hold.
- San Bernardino County population projected at +15% by 2050 — modest demand growth; plan on rents tracking national, not racing it.
- At projected returns (-3.0% appreciation + 2.9% rent growth), your $38k cash investment doubles in ~6 years — after that, you're playing with house money.
Negotiation context
- Only 7 days on market — expect competitive offers; lowballing is unlikely to land.
- 3 sale attempts since 3y ago with the ask held roughly flat each time — persistent listings suggest the price (not the market) is what's stuck; bring a comps-based counter.
Risks & watch-outs
- Climate carrying-cost: severe wildfire risk; extreme-heat days projected 4→13/yr by 2055 (HVAC capex compounding) — expect insurance premiums to compound above CPI over the hold.
Questions for the listing agent
- Built in 1977 — when were the roof, HVAC, electrical panel, plumbing, and water heater last replaced?
- Is there a deadline driving the sale (1031 exchange, divorce, estate, relocation)? That informs how much negotiation room exists.
- Schools are D-rated, which usually means shorter tenancies and higher turnover. Who's the typical renter profile here, and what's been the actual vacancy rate?
- Crime grade is F in this area — have there been break-ins, vandalism, or insurance claims at this property in the last 3 years? What carrier currently insures it and at what premium?
- What's the average days-on-market for RENTAL listings here right now (not sales)? A rising rental-DOM trend means longer vacancies and softer asking-rent achievability than the comps imply.
- What's the recent tenant-quality profile in this submarket — average credit score on applications, eviction rate, late-payment / NSF rate, and stable-employment percentage? A property-management company in the area should have these aggregated.
- How much new for-sale + rental construction is in the pipeline within 1–3 miles? Heavy new supply typically softens prices + rents 12–24 months out; constrained supply supports both.
Investment metrics
- 1% rule
- 1.54% ✓
- Cap rate
- 12.59%
- Cash-on-cash
- 22.49%
- DSCR
- 2.00
- GRM
- 5.4
CMA / ARV
- ARV (on-the-fly)
- $153,504
- Comps found
- 12
Show comp detail 12 sales within ~0.75 mi
| Address | Dist | Beds/Ba | Sqft | Sold | Price | $/sf | Match |
|---|---|---|---|---|---|---|---|
| 3850 Atlantic Ave #199 | 0.00mi | 2/2.0 | 1,248 (0%) | 5mo | $75,000 | $60 | 96 |
| 3850 Atlantic Ave #144 | 0.00mi | 2/2.0 | 1,248 (0%) | 8mo | $137,000 | $110 | 93 |
| 3850 Atlantic Ave #81 | 0.09mi | 2/2.0 | 1,224 (-2%) | 10mo | $150,000 | $123 | 84 |
| 3850 Atlantic Ave #274 | 0.00mi | 2/2.0 | 1,344 (+8%) | 5mo | $133,000 | $99 | 83 |
| 3850 Atlantic Ave #189 | 0.09mi | 2/2.0 | 1,344 (+8%) | 2mo | $90,000 | $67 | 82 |
| 3850 Atlantic Ave #201 | 0.09mi | 2/2.0 | 1,344 (+8%) | 8mo | $93,000 | $69 | 77 |
| 3850 Atlantic Ave #207 | 0.09mi | 2/2.0 | 1,428 (+14%) | 1mo | $208,000 | $146 | 71 |
| 27600 Atlantic Ave #431 | 0.19mi | 2/2.0 | 1,392 (+12%) | 5mo | $220,000 | $158 | 68 |
| 27600 Atlantic Ave #427 | 0.19mi | 2/2.0 | 1,392 (+12%) | 6mo | $200,000 | $144 | 67 |
| 3850 Atlantic Ave #86 | 0.09mi | 2/2.0 | 1,416 (+14%) | 10mo | $170,900 | $121 | 65 |
| 3850 Atlantic Ave #25 | 0.09mi | 2/2.0 | 1,428 (+14%) | 8mo | $197,500 | $138 | 65 |
| 4040 E Piedmont #55 | 0.39mi | 2/2.0 | 1,392 (+12%) | 10mo | $205,500 | $148 | 55 |
Match score weights: distance 35% · size 25% · config 20% · recency 20%. Top-matched comps best support the ARV.
Projected returns pro-forma
-3.0% appreciation · 2.91% rent growth · sell at horizon
- IRR
- 15.2%
- Equity multiple
- 1.61×
- Total profit
- $23,096
- Equity at exit
- $20,129
- IRR
- 23.9%
- Equity multiple
- 3.05×
- Total profit
- $77,580
- Equity at exit
- $11,672
Cash invested: $37,800 (down + closing). Projections, not guarantees.
Landlord ↔ Tenant lean methodology
- Overall (STATE)
- 18 Strongly Tenant-Friendly
- State California
- 18 Strongly Tenant-Friendly · D+13
- County
- — inherits STATE
- City
- — inherits STATE
ZIP-level market 92346
- Rents YoY
- 2.9%
- Active inventory
- 147
- Price-to-rent
- 5.4×
Monthly cashflow live
- Estimated rent
- $2,078 high interval (Pro) →
- Mortgage (P&I)
- −$708
- Tax est. 1.5%
- −$169 /mo · $2,025/yr
- Insurance
- −$56
- HOA
- −$0
- Vacancy / Maint / Mgmt
- −$436
- Net cashflow
- $709
Break-even live
UW: 25.0% down · 7.5% · 30yr · 1.5% tax · 5.0% vac · 8.0% maint · 8.0% mgmt
Financing live
Cash to close
- Down payment
- $33,750
- Closing costs
- $4,050
- Reserves months
- —
- Total cash needed
- —
Loan-product check · same deal, 3 products live
Conventional
25% down · 7.5% · 30yr
- Down + closing
- —
- Monthly P&I
- —
- Monthly cashflow
- —
- DSCR
- —
- Eligible?
- —
Personal DTI + credit; lowest rate.
DSCR
20% down · 8.5% · 30yr
- Down + closing
- —
- Monthly P&I
- —
- Monthly cashflow
- —
- DSCR
- —
- Eligible?
- —
No personal income docs; deal must DSCR.
Hard money
10% down · 12.0% · 12mo
- Down + closing
- —
- Monthly P&I
- —
- Monthly cashflow
- —
- DSCR
- —
- Eligible?
- —
Short-term bridge; refi at stabilization.
Rent comps 20 comps
| Address | Beds | Baths | Sqft | Rent | $/sqft | DOM | Units | Dist |
|---|---|---|---|---|---|---|---|---|
| 2265 Bradford Ave Apt 524 Highland, CA | 2.0 | 2.0 | 810 | $1,800 | $2.22 | 24d | 1 | 0.13mi |
| 3532 Rainbow Ln Highland, CA | 2.0 | 1.0 | 882 | $2,100 | $2.38 | 1d | 1 | 0.39mi |
| 3495 21st St Unit B Highland, CA | 2.0 | 2.0 | 1000 | $2,000 | $2.00 | 43d | 1 | 0.41mi |
| 3511 Rainbow Ln Highland, CA | 2.0 | 1.0 | 780 | $2,050 | $2.63 | 3d | 1 | 0.42mi |
| 6787 Cole Ave Highland, CA | 2.0–3.0 | 2.0 | 1005 | $2,125 | $2.11 | 1d | 1 | 0.44mi |
| 3479 20th St Highland, CA | 2.0 | 1.0 | 882 | $1,995 | $2.26 | 43d | 1 | 0.44mi |
| 3404 20th St #1 Highland, CA | 2.0 | 1.0 | 780 | $2,195 | $2.81 | 2d | 1 | 0.52mi |
| 7000 La Praix St Highland, CA | 2.0 | 1.0 | 865 | $2,200 | $2.54 | 1d | 1 | 0.58mi |
| 3317 Highland Ave Highland, CA | 3.0 | 2.0 | 1250 | $2,000 | $1.60 | 24d | 1 | 0.62mi |
| 27205 Main St Highland, CA | 1.0 | 1.0 | 700 | $1,575 | $2.25 | 43d | 1 | 0.66mi |
| 1991 Central Ave Highland, CA | 2.0 | 3.0 | 1312 | $2,500 | $1.91 | 43d | 1 | 0.78mi |
| 26814 Mansfield St Highland, CA | 3.0 | 1.0 | 1275 | $2,850 | $2.24 | 43d | 1 | 1.01mi |
| 6601 Victoria Ave Highland, CA | 2.0 | 2.0 | 775 | $1,827 | $2.36 | 43d | 1 | 1.06mi |
| 6601 Victoria Ave Highland, CA | 2.0 | 2.0 | 775 | $1,677 | $2.16 | 24d | 1 | 1.06mi |
| 6601 Victoria Ave Highland, CA | 2.0 | 2.0 | 775 | $1,677 | $2.16 | 20d | 1 | 1.06mi |
| 28349 Saffron Ave Highland, CA | 2.0 | 1.0 | 800 | $2,500 | $3.12 | 43d | 1 | 1.18mi |
| 7257 Wakefield Ct Highland, CA | 3.0 | 2.0 | 1183 | $2,395 | $2.02 | 24d | 1 | 1.22mi |
| 28490 Highland Ave Highland, CA | 1.0 | 1.0 | 792 | $2,200 | $2.78 | 43d | 1 | 1.26mi |
| 7221 Olive St Highland, CA | 2.0 | 1.0 | 866 | $2,150 | $2.48 | 43d | 1 | 1.31mi |
| 27531 Temple St Highland, CA | 3.0 | 2.0 | 1144 | $2,650 | $2.32 | 10d | 1 | 1.31mi |
Listing history 6 events
-
2026-06-18days on market $135,000 Active 7 DOM
-
2026-06-17days on market $135,000 Active 6 DOM
-
2026-06-16days on market $135,000 Active 5 DOM
-
2026-06-15days on market $135,000 Active 4 DOM
-
2026-06-13remarks 687-char remark
-
2026-06-13$135,000 Active 2 DOM
ⓘ Source: listings_history table (triggers on properties + properties_extension) + one-shot
backfill from property_details.listing_events for pre-trigger history.
Climate risk First Street
- Flood 1/10 Low FEMA zone X (unshaded) · 0% chance over 30 yrs
- Wildfire 8/10 Severe
- Heat 8/10 Severe 4 d/yr ≥101°F today · 13 d/yr by 30 yrs out
- Wind 1/10 Low
- Air quality 10/10 Extreme 29 unhealthy d/yr today · 35 by 30 yrs out
Nearby sold comps map
Loading sold comps map…
Walkable amenities ~0.75 mi
Loading nearby amenities…
Taxation est. · year 1
- Rental income
- $24,934
- − Mortgage interest
- −$7,562
- − Property taxes
- −$2,025
- − Insurance
- −$675
- − Repairs & maintenance
- −$1,995
- − Management
- −$1,995
- − Depreciation
- −$3,927
- Taxable income
- $6,756
- Est. tax owed @ 24.0%
- −$1,621
- After-tax cash flow
- $6,881/yr
For passive investors: Depreciation is non-cash, so a rental often shows a tax loss while cash-flowing — sheltering income. Rental losses are passive: they offset passive income freely, and up to $25,000/yr can offset ordinary (W-2) income if you actively participate and your MAGI is under $100k (phasing out to $0 by $150k); unused losses carry forward. On sale, claimed depreciation is recaptured at up to 25%, and gains may owe capital-gains tax (a 1031 exchange can defer both). Figures are a year-1 estimate at your 24.0% rate — not tax advice; consult a CPA.
Schools (NCES district)
- District
- San Bernardino City Unified
- NCES district ID
- 0634170
- Math proficiency
- 27% ▲ 1.00%
- Reading proficiency
- 40% ▬ 0.00%
- Median HH income
- $39,758
- Composite
- 30.8/100
- National rank
- #11385
- State rank
- #959 of 1400 in CA
Livability — San Bernardino
- Score
- 59/100
- State rank
- #661
- US rank
- #20479
Category grades
Schools grade is shown separately in the Schools card above.
Census & demographics
- Census place
- San Bernardino, CA
- County
- San Bernardino County · 2,030,291 people
- City population
- 255,614
- Metro
- Riverside-San Bernardino-Ontario, CA
- Population (ZIP)
- 56,179
- Household income
- $85,163
- Rent vs Own
- Severe rent burden
- 1816.0
Population outlook (San Bernardino County) Hauer SSP2
- Today (2025)
- 2,300,329 people
- By 2030
- 2,378,907 · +3.4%
- By 2040
- 2,523,137 · +9.7%
- By 2050
- 2,642,388 · +14.9%
- By 2075
- 2,880,769 · +25.2%
- By 2100
- 2,909,436 · +26.5%
Race, ethnicity, and origin ACS 2023
- Neighborhood character
- Diverse neighborhood (Simpson 0.63)
- Race & ethnicity
- Hispanic / Latino 53% White 26% Two or more races 14% Black 8% Asian 8% Native American 1%
- Hispanic origin (detail)
- Mexican 46%
- Common ancestry
- Italian 1% Iranian 1% Lithuanian 1%
- Foreign-born
- 19% · Canada, Vietnam, South Korea
- Languages at home
- 60% English-only · Spanish 32% Vietnamese 2% Tagalog/Filipino 2%
Political lean MEDSL · San Bernardino
- 2024 margin
- Toss-up / Even · D 47.5% · R 49.7% · Other 2.8%
- 2008→2024 swing
- -8.5pp toward R · 2008: 6.3pp · 2024: -2.1pp
- All cycles
- 2024: R+2.1 2020: D+10.7 2016: D+9.8 2012: D+5.4 2008: D+6.3
Not yet ingested
- Civics
- —
Market trends
- HPI YoY
- ▼ -328.00%
- Current HPI
- 367.2829
- Rent YoY
- ▲ 2.91%
- Metro
- Riverside-San Bernardino-Ontario, CA
- State GDP YoY
- ▲ 3.21%
- F500 in state
- 116
Industry mix (Fortune 500 HQ in CA)
| Industry | F500 HQs | Revenue |
|---|---|---|
| Technology | 27 | $1,492B |
|
||
| Financial Services | 3 | $174B |
|
||
| Retail | 3 | $44B |
|
||
| Insurance | 3 | $26B |
|
||
| Media / Entertainment | 2 | $115B |
|
||
| Pharmaceuticals / Biotech | 2 | $62B |
|
||
Price history
+0.0% since first listed10 events — show timeline
- 2026-06-11 Listed $135,000 CRMLS
- 2024-06-06 Sold (MLS) $120,000 CRMLS
- 2024-05-28 Pending — CRMLS
- 2024-05-17 Listed $115,000 CRMLS
- 2023-05-24 Sold (MLS) $115,000 CRMLS
- 2023-05-10 Pending — CRMLS
- 2023-05-08 Price Changed $115,000 CRMLS
- 2023-04-10 Price Changed $120,000 CRMLS
- 2023-04-10 Price Changed $125,000 CRMLS
- 2023-02-24 Listed $135,000 CRMLS
Cash-flow waterfall
monthlySold comps — $/sqft
last 12 mo · ≤1 miLoading sold comps…