 Multi-family
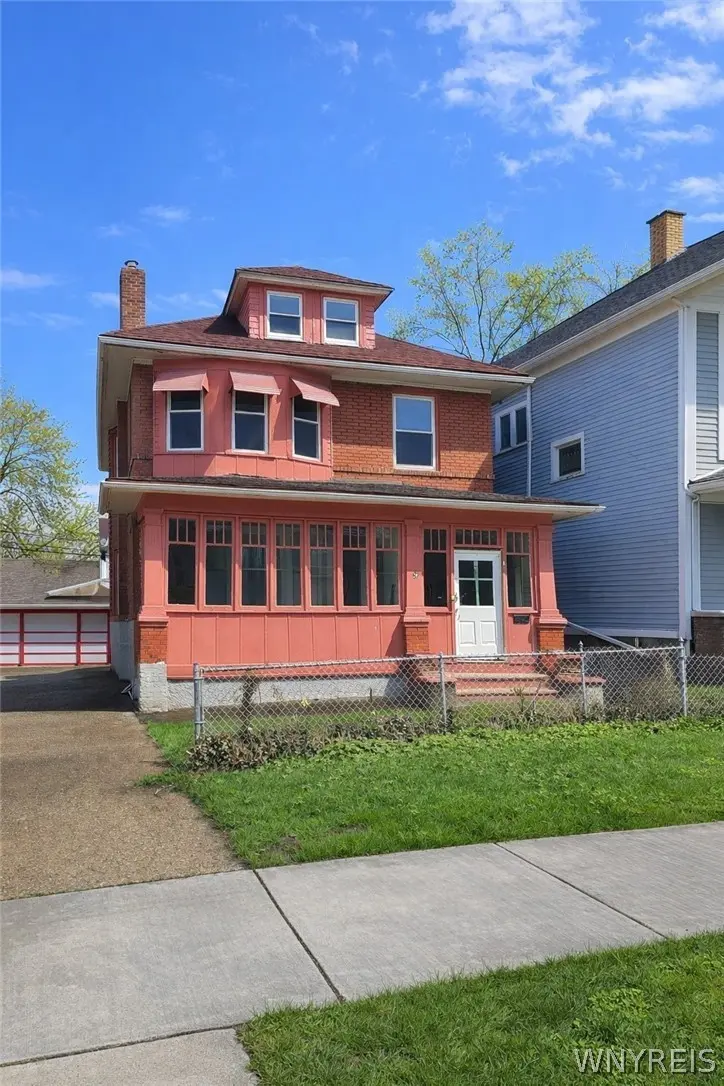
87 Merrimac St · Buffalo, NY
Flood risk 1/10 · Minimal
- FEMA flood zone
- X (unshaded)
- Chance of flooding over 30 yrs
- 0.0%
- Est. flood insurance / yr
- $473 – $860
Fire risk 1/10 · Minimal
- Est. fire insurance / yr
- $691 – $1,283
Heat risk 3/10 · Minor
- Hot days now (above 92°F)
- 7 days/yr
- Hot days in 30 yrs
- 15 days/yr
Wind risk 1/10 · Minimal
- Chance of severe wind over 30 yrs
- —
Air-quality risk 3/10 · Minor
- Unhealthy air days now
- 2 days/yr
- Unhealthy air days in 30 yrs
- 3 days/yr
Risk factors via First Street. Map © Google.
Why this score? — see what drove the B+ grade
The composite is a weighted blend of 9 inputs, each scored 0–100. Each bar is that input's sub-score; the figure is the points it added to the 100-point composite (weight × sub-score).
- Cash flow +30.0/30.0
- ARV discount +15.0/15.0
- 1% rule +10.0/10.0
- DSCR +10.0/10.0
- Rent growth +4.0/5.0
- Livability +3.9/5.0
- Schools +3.3/10.0
- Condition / age +2.5/5.0
- Appreciation +0.0/10.0
$254,900
🖨 Deal sheet 📄 Offer letter ✓ Due diligence
Multi-family units
County records classify this as Multi-Family (2-4 Unit). Listing-text estimate: 1 unit. estimate disagrees with records
Listing remarks MLS
Spacious 5 bedroom 2 bathroom brick multi-family property located in the heart of Buffalo near University Heights. This solid brick home offers generous living space in each unit, making it a great opportunity for owner occupants and investors. Property features separate living areas, large bedrooms, and strong rental potential. Conveniently located near schools, public transportation, shopping, and major roadways. A great addition to any portfolio or a perfect chance to live in one unit while generating income from the other.
Key facts
- 6,900 sq ft lot
- Garage
- Built 1920
Neighborhood map
What this means for you Summary
Snapshot
- This is a 4-bed/2.0-bath multifamily listed at $255k.
Deal economics
- At list price, monthly cash flow is $3k ($33k/yr) — positive.
- The deal already cash-flows at list — no discount required.
- Meets the 1% rule at list price ($5k rent vs $255k).
- Recommended offer: $247k (3.0% below list) — sets the bar for market timing.
- Cap rate 19.1% vs local median 8.0% in Buffalo — top-decile yield for the area; either an underpriced asset or a hidden risk that comps aren't pricing in. Stress-test before assuming the spread holds.
Location & tenants
- Location reads 77/100 on livability (#195 in NY, #3,011 nationally) — a middle-class / working-renter tenant base. Strengths: commute A+, housing A+, health & safety A+; Watch: crime F, employment D-.
- Buffalo City School District (urban): math 41% / reading 40% proficiency, ranked #535 of 590 in NY (top 91%) — families likely to look elsewhere, expect single-tenant / working-renter base with shorter leases; 75% free/reduced lunch — lower-income household profile, screen leases tightly.
- Market conditions: Rents rising fast (+5.8%/yr); 90 active listings in the ZIP; 26 comparable units currently listed for rent nearby; rentals at typical pace (median 15d on market — plan ~3-4 weeks tenant-placement turnaround); 1,244 units permitted in Erie County in 2024 (563 in 5+ unit buildings).
- At $5,337/mo this rent would consume 110% of the median local household income ($58k/yr) (locally 1820% of renters already pay >50% of income on rent) — very limited rent-growth headroom before tenants either downsize or default.
Forward outlook
- Local home prices are declining (-3.0%/yr); year-one equity from $2k of loan paydown is wiped out by about $8k of value loss. Plan a longer hold.
- At projected returns (-3.0% appreciation + 5.8% rent growth), your $71k cash investment doubles in ~3 years — after that, you're playing with house money.
Negotiation context
- It's been on market 41 days — a 3% lower offer ($247k) is reasonable based on typical stale-listing flexibility.
- Current owner paid $73k; list at $255k implies a 249% gain — meaningful room to come down on a strong offer.
Risks & watch-outs
- Watch-outs: built in 1920 — expect roof / HVAC / electrical / plumbing capex.
Questions for the listing agent
- It's been on market 41 days. Have you received any prior offers? Is the seller open to a 3% concession, seller financing, or rate buy-down credit?
- Built in 1920 — when were the roof, HVAC, electrical panel, plumbing, and water heater last replaced?
- Is there a deadline driving the sale (1031 exchange, divorce, estate, relocation)? That informs how much negotiation room exists.
- Crime grade is F in this area — have there been break-ins, vandalism, or insurance claims at this property in the last 3 years? What carrier currently insures it and at what premium?
- What's the average days-on-market for RENTAL listings here right now (not sales)? A rising rental-DOM trend means longer vacancies and softer asking-rent achievability than the comps imply.
- What's the recent tenant-quality profile in this submarket — average credit score on applications, eviction rate, late-payment / NSF rate, and stable-employment percentage? A property-management company in the area should have these aggregated.
- How much new apartment / multifamily construction is in the pipeline within 1–3 miles? Heavy new supply (>2% of stock underway) typically softens rents 12–24 months out; light construction supports rent growth.
Investment metrics
- 1% rule
- 2.09% ✓
- Cap rate
- 19.08%
- Cash-on-cash
- 45.65%
- DSCR
- 3.03
- GRM
- 4.0
CMA / ARV
- ARV (median comp)
- $392,799
- List price
- $254,900
- Delta
- -35.11%
- Verdict
- UNDERPRICED
- Comps
- 20 within 1.0 mi
Show comp detail 12 sales within ~0.75 mi
| Address | Dist | Beds/Ba | Sqft | Sold | Price | $/sf | Match |
|---|---|---|---|---|---|---|---|
| 80 Lasalle Ave | 0.46mi | 4/2.0 | 1,778 (-5%) | 9mo | $170,000 | $96 | 63 |
| 60 Hawthorne Ave | 0.47mi | 3/2.0 (-1) | 1,928 (+3%) | 7mo | $230,000 | $119 | 62 |
| 41 Wendel Ave | 0.44mi | 4/2.0 | 1,760 (-6%) | 15mo | $265,000 | $151 | 57 |
| 726 Taunton Pl | 0.48mi | 4/2.0 | 1,632 (-13%) | 6mo | $199,000 | $122 | 51 |
| 712-714 Taunton Pl | 0.43mi | 4/2.0 | 1,612 (-14%) | 7mo | $206,000 | $128 | 51 |
| 716 Taunton Pl | 0.49mi | 4/2.0 | 1,612 (-14%) | 4mo | $215,600 | $134 | 50 |
| 40 Dartmouth Ave | 0.68mi | 3/2.0 (-1) | 1,884 (+1%) | 16mo | $186,500 | $99 | 49 |
| 141 Hawthorne Ave | 0.63mi | 4/2.0 | 1,760 (-6%) | 18mo | $220,000 | $125 | 46 |
| 722 Taunton Pl | 0.49mi | 4/2.0 | 1,633 (-13%) | 13mo | $230,000 | $141 | 45 |
| 314 Lasalle Ave | 0.71mi | 4/2.0 | 1,675 (-10%) | 8mo | $170,000 | $101 | 43 |
| 190 Lyndale Ave | 0.71mi | 4/2.0 | 2,016 (+8%) | 18mo | $263,000 | $130 | 39 |
| 108 Fairfield Ave | 0.70mi | 4/2.0 | 2,136 (+14%) | 10mo | $250,000 | $117 | 36 |
Match score weights: distance 35% · size 25% · config 20% · recency 20%. Top-matched comps best support the ARV.
Projected returns pro-forma
-3.0% appreciation · 5.81% rent growth · sell at horizon
- IRR
- 45.8%
- Equity multiple
- 3.06×
- Total profit
- $147,073
- Equity at exit
- $38,006
- IRR
- 52.8%
- Equity multiple
- 6.85×
- Total profit
- $417,876
- Equity at exit
- $22,039
Cash invested: $71,372 (down + closing). Projections, not guarantees.
Landlord ↔ Tenant lean methodology
- Overall (STATE)
- 15 Strongly Tenant-Friendly
- State New York
- 15 Strongly Tenant-Friendly · D+10
- County
- — inherits STATE
- City
- — inherits STATE
ZIP-level market 14214
- Rents YoY
- 5.8%
- Active inventory
- 90
- Price-to-rent
- 8.0×
Monthly cashflow live
- Estimated rent
- $5,337 medium interval (Pro) →
- Mortgage (P&I)
- −$1,337
- Tax from tax record
- −$58 /mo · $695/yr
- Insurance
- −$106
- HOA
- −$0
- Vacancy / Maint / Mgmt
- −$1,121
- Net cashflow
- $2,715
Break-even live
2-unit breakdown (identical units grouped — click to expand)
| Units | Beds | Baths | Est. rent |
|---|---|---|---|
| 2× units | 5 | 2 | $5,338 |
| #1 | 5 | 2 | $2,669 |
| #2 | 5 | 2 | $2,669 |
| Total (2 units) | $5,337 | ||
UW: 25.0% down · 7.5% · 30yr · 1.5% tax · 5.0% vac · 8.0% maint · 8.0% mgmt
Financing live
Cash to close
- Down payment
- $63,725
- Closing costs
- $7,647
- Reserves months
- —
- Total cash needed
- —
Loan-product check · same deal, 3 products live
Conventional
25% down · 7.5% · 30yr
- Down + closing
- —
- Monthly P&I
- —
- Monthly cashflow
- —
- DSCR
- —
- Eligible?
- —
Personal DTI + credit; lowest rate.
DSCR
20% down · 8.5% · 30yr
- Down + closing
- —
- Monthly P&I
- —
- Monthly cashflow
- —
- DSCR
- —
- Eligible?
- —
No personal income docs; deal must DSCR.
Hard money
10% down · 12.0% · 12mo
- Down + closing
- —
- Monthly P&I
- —
- Monthly cashflow
- —
- DSCR
- —
- Eligible?
- —
Short-term bridge; refi at stabilization.
Rent comps 26 comps
| Address | Beds | Baths | Sqft | Rent | $/sqft | DOM | Units | Dist |
|---|---|---|---|---|---|---|---|---|
| 102 Englewood Ave Buffalo, NY | 4.0 | 1.0 | 2426 | $2,750 | $1.13 | 1d | 1 | 0.10mi |
| 60 Englewood Ave Buffalo, NY | 4.0 | 1.0 | 1400 | $1,650 | $1.18 | 1d | 1 | 0.12mi |
| 91 Englewood Ave Buffalo, NY | 4.0 | 1.0 | 2500 | $2,000 | $0.80 | 1d | 1 | 0.13mi |
| 24 Custer St Buffalo, NY | 5.0 | 2.0 | 2500 | $3,000 | $1.20 | 14d | 1 | 0.21mi |
| 63 Montrose Ave Buffalo, NY | 4.0 | 1.0 | 2240 | $2,000 | $0.89 | 1d | 1 | 0.21mi |
| 196 Englewood Ave Buffalo, NY | 5.0 | 1.5 | 2560 | $2,000 | $0.78 | 1d | 1 | 0.22mi |
| 65 Northrup Pl Buffalo, NY | 5.0 | 2.0 | 1467 | $2,500 | $1.70 | 14d | 1 | 0.30mi |
| 85 Highgate Ave Buffalo, NY | 5.0 | 2.0 | 2193 | $3,750 | $1.71 | 14d | 1 | 0.34mi |
| 59 Lisbon Ave Buffalo, NY | 3.0 | 1.0 | 2521 | $1,250 | $0.50 | 23d | 1 | 0.35mi |
| 163 Carmel Rd Buffalo, NY | 3.0 | 1.0 | 1400 | $1,800 | $1.29 | 3d | 1 | 0.48mi |
| 175 Lisbon Ave Buffalo, NY | 5.0 | 2.0 | 2000 | $2,500 | $1.25 | 14d | 1 | 0.48mi |
| 80 Capen Blvd Buffalo, NY | 5.0 | 2.5 | 2591 | $2,800 | $1.08 | 1d | 1 | 0.51mi |
| 89 Lasalle Ave Buffalo, NY | 1.0–4.0 | 1.0–4.0 | 1024 | $2,997 | $2.93 | 1d | 10 | 0.52mi |
| 222 Lisbon Ave Buffalo, NY | 4.0 | 1.0 | 1300 | $1,400 | $1.08 | 23d | 1 | 0.53mi |
| 222 Lisbon Ave Unit Upper Buffalo, NY | 3.0 | 1.0 | 1400 | $1,400 | $1.00 | 43d | 1 | 0.53mi |
| 263 Minnesota Ave Unit Upper Buffalo, NY | 3.0 | 1.0 | 1242 | $1,500 | $1.21 | 14d | 1 | 0.63mi |
| 91 Springville Ave Buffalo, NY | 4.0 | 2.0 | 1660 | $2,350 | $1.42 | 23d | 1 | 0.85mi |
| 524 University Ave Buffalo, NY | 3.0 | 1.0 | 1840 | $1,600 | $0.87 | 1d | 1 | 0.93mi |
| 348 Capen Blvd Buffalo, NY | 3.0 | 1.5 | 1424 | $2,200 | $1.54 | 1d | 1 | 0.95mi |
| 414 Taunton Pl Unit Lowet Buffalo, NY | 3.0 | 1.0 | 1232 | $1,700 | $1.38 | 14d | 1 | 1.07mi |
| 4098 Bailey Ave Buffalo, NY | 5.0 | 2.5 | 2108 | $2,200 | $1.04 | 43d | 1 | 1.18mi |
| 151 Lamson Rd Buffalo, NY | 4.0 | 2.0 | 1382 | $2,350 | $1.70 | 17d | 1 | 1.25mi |
| 25 Parkridge Ave Buffalo, NY | 3.0 | 1.0 | 1914 | $1,350 | $0.71 | 14d | 1 | 1.25mi |
| 307 Sterling Ave Buffalo, NY | 3.0 | 1.0 | 1632 | $1,800 | $1.10 | 3d | 1 | 1.26mi |
| 309 N Park Ave Buffalo, NY | 3.0 | 1.0 | 2560 | $1,750 | $0.68 | 14d | 1 | 1.39mi |
| 202 Summit Ave Unit 1 Buffalo, NY | 3.0 | 1.0 | 2000 | $2,400 | $1.20 | 23d | 1 | 1.39mi |
Listing history 7 events
-
2026-06-02statusdays on market $254,900 Pending 41 DOM
-
2026-06-01days on market $254,900 Active 40 DOM
-
2026-05-31days on market $254,900 Active 39 DOM
-
2026-04-29price $254,900 532-char remark
Show marketing remark (532 chars)
Spacious 5 bedroom 2 bathroom brick multi-family property located in the heart of Buffalo near University Heights. This solid brick home offers generous living space in each unit, making it a great opportunity for owner occupants and investors. Property features separate living areas, large bedrooms, and strong rental potential. Conveniently located near schools, public transportation, shopping, and major roadways. A great addition to any portfolio or a perfect chance to live in one unit while generating income from the other.
-
2026-04-22$264,900 Active 532-char remark
Show marketing remark (532 chars)
Spacious 5 bedroom 2 bathroom brick multi-family property located in the heart of Buffalo near University Heights. This solid brick home offers generous living space in each unit, making it a great opportunity for owner occupants and investors. Property features separate living areas, large bedrooms, and strong rental potential. Conveniently located near schools, public transportation, shopping, and major roadways. A great addition to any portfolio or a perfect chance to live in one unit while generating income from the other.
-
2012-03-23soldstatus $73,000
-
2005-01-25soldstatus $70,000
ⓘ Source: listings_history table (triggers on properties + properties_extension) + one-shot
backfill from property_details.listing_events for pre-trigger history.
Tax reassessment forecast NY · Partial reset (capped growth)
- Current annual tax
- $695 · $58/mo
- Projected year-2 tax
- $2,501 · $208/mo
- Expected delta
- +$1,806/yr (+$151/mo · 259.9%)
ⓘ Screening estimate from a state-policy table — verify with the county assessor before closing.
Climate risk First Street
- Flood 1/10 Low FEMA zone X (unshaded) · 0% chance over 30 yrs
- Wildfire 1/10 Low
- Heat 3/10 Moderate 7 d/yr ≥92°F today · 15 d/yr by 30 yrs out
- Wind 1/10 Low
- Air quality 3/10 Moderate 2 unhealthy d/yr today · 3 by 30 yrs out
Nearby sold comps map
Loading sold comps map…
Walkable amenities ~0.75 mi
Loading nearby amenities…
Taxation est. · year 1
- Rental income
- $64,044
- − Mortgage interest
- −$14,278
- − Property taxes
- −$695
- − Insurance
- −$1,274
- − Repairs & maintenance
- −$5,124
- − Management
- −$5,124
- − Depreciation
- −$7,415
- Taxable income
- $30,134
- Est. tax owed @ 24.0%
- −$7,232
- After-tax cash flow
- $25,352/yr
For passive investors: Depreciation is non-cash, so a rental often shows a tax loss while cash-flowing — sheltering income. Rental losses are passive: they offset passive income freely, and up to $25,000/yr can offset ordinary (W-2) income if you actively participate and your MAGI is under $100k (phasing out to $0 by $150k); unused losses carry forward. On sale, claimed depreciation is recaptured at up to 25%, and gains may owe capital-gains tax (a 1031 exchange can defer both). Figures are a year-1 estimate at your 24.0% rate — not tax advice; consult a CPA.
Schools (NCES district)
- District
- Buffalo City School District
- NCES district ID
- 3605850
- Math proficiency
- 41% ▲ 11.00%
- Reading proficiency
- 40% ▲ 7.00%
- Median HH income
- $31,665
- Composite
- 33.17/100
- National rank
- #5544
- State rank
- #535 of 590 in NY
Livability — Buffalo
- Score
- 77/100
- State rank
- #195
- US rank
- #3011
Category grades
Schools grade is shown separately in the Schools card above.
Census & demographics
- Census place
- Buffalo, NY
- County
- Erie County · 714,559 people
- City population
- 440,021
- Metro
- Buffalo-Cheektowaga, NY
- Population (ZIP)
- 21,314
- Household income
- $58,228
- Rent vs Own
- Severe rent burden
- 1820.0
Population outlook (Erie County) Hauer SSP2
- Today (2025)
- 933,037 people
- By 2030
- 935,181 · +0.2%
- By 2040
- 928,531 · -0.5%
- By 2050
- 905,725 · -2.9%
- By 2075
- 834,037 · -10.6%
- By 2100
- 708,033 · -24.1%
Race, ethnicity, and origin ACS 2023
- Neighborhood character
- Diverse neighborhood (Simpson 0.67)
- Race & ethnicity
- White 47% Black 31% Asian 11% Hispanic / Latino 7% Two or more races 6%
- Hispanic origin (detail)
- Puerto Rican 3%
- Common ancestry
- Romanian 5% Lithuanian 2% Scotch-Irish 1%
- Foreign-born
- 14% · Canada, China
- Languages at home
- 81% English-only · Other Indo-European 7% Spanish 4% Other Asian/Pacific 1%
Political lean MEDSL · Erie
- 2024 margin
- Lean D (+9.7) · D 54.8% · R 45.2%
- 2008→2024 swing
- -7.9pp toward R · 2008: 17.5pp · 2024: 9.7pp
- All cycles
- 2024: D+9.7 2020: D+14.7 2016: D+4.8 2012: D+15.6 2008: D+17.5
Not yet ingested
- Civics
- —
Market trends
- HPI YoY
- ▼ -282.52%
- Current HPI
- 373.377
- Rent YoY
- ▲ 5.81%
- Metro
- Buffalo-Cheektowaga, NY
- State GDP YoY
- ▲ 2.60%
- F500 in state
- 92
Industry mix (Fortune 500 HQ in NY)
| Industry | F500 HQs | Revenue |
|---|---|---|
| Financial Services | 10 | $950B |
|
||
| Consumer Goods | 9 | $162B |
|
||
| Insurance | 4 | $225B |
|
||
| Telecommunications | 2 | $144B |
|
||
| Pharmaceuticals | 2 | $112B |
|
||
| Media / Entertainment | 2 | $69B |
|
||
Price history
+264.1% since first listed4 events — show timeline
- 2026-04-29 Price Changed $254,900 WNYREIS
- 2026-04-22 Listed $264,900 WNYREIS
- 2012-03-23 Sold (Public Records) $73,000 Public Records
- 2005-01-25 Sold (Public Records) $70,000 Public Records
Property tax history
+5.6%/yrLatest (2025): $695 · +0.0% YoY. Source: county tax records.
Cash-flow waterfall
monthlySold comps — $/sqft
last 12 mo · ≤1 miLoading sold comps…