 7-Plex
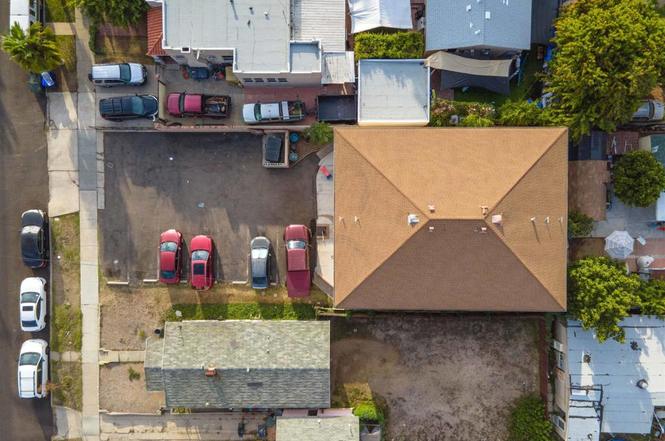
1121 E 6TH · National City, CA
Flood risk 1/10 · Minimal
- FEMA flood zone
- X (unshaded)
- Chance of flooding over 30 yrs
- 0.0%
- Est. flood insurance / yr
- $507 – $1,088
Fire risk 1/10 · Minimal
- Est. fire insurance / yr
- $659 – $1,223
Heat risk 4/10 · Minor
- Hot days now (above 88°F)
- 7 days/yr
- Hot days in 30 yrs
- 20 days/yr
Wind risk 1/10 · Minimal
- Chance of severe wind over 30 yrs
- —
Air-quality risk 3/10 · Minor
- Unhealthy air days now
- 2 days/yr
- Unhealthy air days in 30 yrs
- 2 days/yr
Risk factors via First Street. Map © Google.
Why this score? — see what drove the C- grade
The composite is a weighted blend of 9 inputs, each scored 0–100. Each bar is that input's sub-score; the figure is the points it added to the 100-point composite (weight × sub-score).
- Cash flow +19.6/30.0
- ARV discount +7.5/15.0
- DSCR +6.2/10.0
- 1% rule +4.6/10.0
- Schools +3.9/10.0
- Rent growth +3.2/5.0
- Livability +3.2/5.0
- Condition / age +2.5/5.0
- Appreciation +0.0/10.0
$2,300,000
🖨 Deal sheet (PDF) 📄 Offer letter ✓ Due diligence
Multi-family units
County records classify this as Multi-Family (5+ Unit). Listing-text estimate: 7 units. confirmed
5+ unit building — per-unit beds/baths from public records are typically unavailable; the breakdown below (if shown) is an estimate from the listing text.
Listing remarks
We are pleased to present 1121 E 6TH STREET, NATIONAL CITY, CA 91950, a 7-unit apartment building investment consisting of one building of approximately 4,536 square feet constructed in 1973 on a 6,555 square foot lot. The unit mix consists of (1) 3+2, (6) 1+1 and eight parking spaces. The building is located a short walk to Plaza Blvd, offering access to restaurants, shops, Walmart, banks, and coffee options. 1121 E 6TH STREET, NATIONAL CITY, CA 91950 is included in a portfolio of seven, multifamily real estate investments totaling 39 units, located in South and Central San Diego County: Spring Valley, San Diego, Chula Vista and National City. Visit the following address for more informati
Key facts
- Access to banks
- Access to walmart
- Access to shops
Tags
Property features AI
Finance
- Other: Number of buildings: 1; Common walls: 2+ common walls; Lot size source: Assessor's Data; Zoning: Buyer to verify
- Financial info: Total of 7 units in the property; Building area reported as 4,536; Gross scheduled income reported as $136,028; Gross income reported as $136,028; Net operating income reported as $80,008; Operating expenses reported as $51,939 (includes insurance $8,400; water/sewer $1,400; trash $2,500; new taxes $23,000); At least one unit shows actual rent of $1,560 and a total rent figure of $9,359 for the unit group shown; Property is subject to rent control
- HOA & community: No HOA information provided
Exterior
- Parking: No parking details provided
- Security: No security features provided
- Utilities: Public sewer; One separate water meter; Seven separate gas meters; Seven separate electric meters
- Home design: Attached property; Two-story building; Year built source: Assessor
- Construction: Year built reported by assessor
- Exterior features: No pool; Curbs in the neighborhood; Rectangular lot shape
Interior
- Kitchen: No kitchen appliance details provided
- Bedrooms: One-bedroom units (unit-level info shows one 1-bed unit and property totals indicate multiple 1-bed units)
- Flooring: No flooring information provided
- Bathrooms: One-bath units (unit-level info shows one 1-bath unit and property totals indicate multiple 1-bath units)
- Heating & cooling: No heating or cooling information provided
- Interior features: Side entry; Entry level is 1
- Laundry & utility: No laundry features listed
Neighborhood map
What this means for you Summary
Snapshot
- This is a 6×6bd/6.0ba + 1×3bd/2.0ba units multifamily listed at $2.30M.
Deal economics
- At list price, monthly cash flow is $3k ($32k/yr) — positive. Per door: $377/mo.
- The deal already cash-flows at list — no discount required.
- To meet the 1% rule (rent ≥ 1% of price), the offer needs to be $2.21M (4.1% below list).
- Recommended offer: $2.21M (4.1% below list) — sets the bar for 1% rule.
- Cap rate 7.7% vs local median 3.2% in National City — top-decile yield for the area; either an underpriced asset or a hidden risk that comps aren't pricing in. Stress-test before assuming the spread holds.
Location & tenants
- Location reads 64/100 on livability (#430 in CA) — a middle-class / working-renter tenant base. Strengths: commute A+; Watch: schools D, crime F, cost of living F.
- Sweetwater Union High (suburban): math 36% / reading 52% proficiency, ranked #187 of 517 in CA (top 36%) — families likely to look elsewhere, expect single-tenant / working-renter base with shorter leases.
- Market conditions: Rents rising (+2.8%/yr); 55 active listings in the ZIP; 11,759 units permitted in San Diego County in 2024 (7,244 in 5+ unit buildings).
- At $22,065/mo this rent would consume 399% of the median local household income ($66k/yr) (locally 3672% of renters already pay >50% of income on rent) — very limited rent-growth headroom before tenants either downsize or default.
Forward outlook
- Local home prices are declining (-3.0%/yr); year-one equity from $16k of loan paydown is wiped out by about $69k of value loss. Plan a longer hold.
- San Diego County population projected at +20% by 2050 — long-run rental-demand tailwind backs the buy-and-hold thesis.
Negotiation context
- Only 5 days on market — expect competitive offers; lowballing is unlikely to land.
- 5 sale attempts since 6y ago with the ask held roughly flat each time — persistent listings suggest the price (not the market) is what's stuck; bring a comps-based counter.
- Current owner paid $1.40M; list at $2.30M implies a 64% gain — meaningful room to come down on a strong offer.
Questions for the listing agent
- Can we see the unit-by-unit rent roll, current vacancy, and any below-market leases? What's the average tenancy length?
- What capital expenditures (roof, boiler, parking lot, exteriors) have been made in the last 5 years, and what's planned in the next 2?
- Built in 1973 — when were the roof, HVAC, electrical panel, plumbing, and water heater last replaced?
- Is there a deadline driving the sale (1031 exchange, divorce, estate, relocation)? That informs how much negotiation room exists.
- Schools are D-rated, which usually means shorter tenancies and higher turnover. Who's the typical renter profile here, and what's been the actual vacancy rate?
- Crime grade is F in this area — have there been break-ins, vandalism, or insurance claims at this property in the last 3 years? What carrier currently insures it and at what premium?
- What's the average days-on-market for RENTAL listings here right now (not sales)? A rising rental-DOM trend means longer vacancies and softer asking-rent achievability than the comps imply.
- What's the recent tenant-quality profile in this submarket — average credit score on applications, eviction rate, late-payment / NSF rate, and stable-employment percentage? A property-management company in the area should have these aggregated.
- How much new apartment / multifamily construction is in the pipeline within 1–3 miles? Heavy new supply (>2% of stock underway) typically softens rents 12–24 months out; light construction supports rent growth.
Investment metrics
- 1% rule
- 0.96% ✗
- Cap rate
- 7.67%
- Cash-on-cash
- 4.91%
- DSCR
- 1.22
- GRM
- 8.7
CMA / ARV
No comps found within radius.
Projected returns pro-forma
-3.0% appreciation · 2.76% rent growth · sell at horizon
- IRR
- -8.9%
- Equity multiple
- 0.67×
- Total profit
- $-210,452
- Equity at exit
- $342,937
- IRR
- 0.2%
- Equity multiple
- 1.02×
- Total profit
- $9,847
- Equity at exit
- $198,862
Cash invested: $644,000 (down + closing). Projections, not guarantees.
Landlord ↔ Tenant lean methodology
- Overall (STATE)
- 18 Strongly Tenant-Friendly
- State California
- 18 Strongly Tenant-Friendly · D+13
- County
- — inherits STATE
- City
- — inherits STATE
ZIP-level market 91950
- Rents YoY
- 2.8%
- Active inventory
- 55
- Price-to-rent
- 59.2×
Monthly cashflow live
- Estimated rent
- $22,065 medium interval (Pro) →
- Mortgage (P&I)
- −$12,061
- Tax from tax record
- −$1,775 /mo · $21,304/yr
- Insurance
- −$958
- HOA
- −$0
- Vacancy / Maint / Mgmt
- −$4,634
- Net cashflow
- $2,636
Break-even live
Sensitivity live
| Price | -10% $3,938 | -5% $3,287 | +0% $2,636 | +5% $1,985 | +10% $1,334 |
|---|---|---|---|---|---|
| Rent | -10% $893 | -5% $1,765 | +0% $2,636 | +5% $3,508 | +10% $4,379 |
| Rate | -1.0pp $3,795 | -0.5pp $3,221 | base $2,636 | +0.5pp $2,040 | +1.0pp $1,434 |
7-unit breakdown (identical units grouped — click to expand)
| Units | Beds | Baths | Est. rent |
|---|---|---|---|
| 6× units | 6 | 6 | $19,410 |
| #1 | 6 | 6 | $3,235 |
| #2 | 6 | 6 | $3,235 |
| #3 | 6 | 6 | $3,235 |
| #4 | 6 | 6 | $3,235 |
| #5 | 6 | 6 | $3,235 |
| #6 | 6 | 6 | $3,235 |
| 1× unit | 3 | 2 | $2,654 |
| Total (7 units) | $22,065 | ||
UW: 25.0% down · 7.5% · 30yr · 1.5% tax · 5.0% vac · 8.0% maint · 8.0% mgmt
Financing live
Cash to close
- Down payment
- $575,000
- Closing costs
- $69,000
- Reserves months
- —
- Total cash needed
- —
Loan-product check · same deal, 3 products live
Conventional
25% down · 7.5% · 30yr
- Down + closing
- —
- Monthly P&I
- —
- Monthly cashflow
- —
- DSCR
- —
- Eligible?
- —
Personal DTI + credit; lowest rate.
DSCR
20% down · 8.5% · 30yr
- Down + closing
- —
- Monthly P&I
- —
- Monthly cashflow
- —
- DSCR
- —
- Eligible?
- —
No personal income docs; deal must DSCR.
Hard money
10% down · 12.0% · 12mo
- Down + closing
- —
- Monthly P&I
- —
- Monthly cashflow
- —
- DSCR
- —
- Eligible?
- —
Short-term bridge; refi at stabilization.
Listing history 4 events
-
2026-06-21days on market $2,300,000 Active 5 DOM
-
2026-06-18days on market $2,300,000 Active 2 DOM
-
2026-06-17remarks 699-char remark
-
2026-06-17$2,300,000 Active 1 DOM
ⓘ Source: listings_history table (triggers on properties + properties_extension) + one-shot
backfill from property_details.listing_events for pre-trigger history.
Tax reassessment forecast CA · Resets to sale price
- Current annual tax
- $21,304 · $1,775/mo
- Projected year-2 tax
- $21,304 · $1,775/mo
- Expected delta
- $0/yr ($0/mo · 0.0%)
ⓘ Screening estimate from a state-policy table — verify with the county assessor before closing.
Climate risk First Street
- Flood 1/10 Low FEMA zone X (unshaded) · 0% chance over 30 yrs
- Wildfire 1/10 Low
- Heat 4/10 Moderate 7 d/yr ≥88°F today · 20 d/yr by 30 yrs out
- Wind 1/10 Low
- Air quality 3/10 Moderate 2 unhealthy d/yr today · 2 by 30 yrs out
Nearby sold comps map
Loading sold comps map…
Walkable amenities ~0.75 mi
Loading nearby amenities…
Taxation est. · year 1
- Rental income
- $264,780
- − Mortgage interest
- −$128,836
- − Property taxes
- −$21,304
- − Insurance
- −$11,500
- − Repairs & maintenance
- −$21,182
- − Management
- −$21,182
- − Depreciation
- −$66,909
- Taxable loss
- −$6,133
- Est. tax savings @ 24.0%
- +$1,472
- After-tax cash flow
- $33,107/yr
For passive investors: Depreciation is non-cash, so a rental often shows a tax loss while cash-flowing — sheltering income. Rental losses are passive: they offset passive income freely, and up to $25,000/yr can offset ordinary (W-2) income if you actively participate and your MAGI is under $100k (phasing out to $0 by $150k); unused losses carry forward. On sale, claimed depreciation is recaptured at up to 25%, and gains may owe capital-gains tax (a 1031 exchange can defer both). Figures are a year-1 estimate at your 24.0% rate — not tax advice; consult a CPA.
Schools (NCES district)
- District
- Sweetwater Union High
- NCES district ID
- 0638640
- Math proficiency
- 36% ▲ 3.00%
- Reading proficiency
- 52% ▼ -2.00%
- Median HH income
- $59,051
- Composite
- 38.61/100
- National rank
- #4158
- State rank
- #187 of 517 in CA
Livability — National City
- Score
- 64/100
- State rank
- #430
- US rank
- #14530
Category grades
Schools grade is shown separately in the Schools card above.
Census & demographics
- Census place
- National City, CA
- County
- San Diego County · 3,178,799 people
- City population
- 59,891
- Metro
- San Diego-Chula Vista-Carlsbad, CA
- Population (ZIP)
- 59,891
- Household income
- $66,426
- Rent vs Own
- Severe rent burden
- 3672.0
Population outlook (San Diego County) Hauer SSP2
- Today (2025)
- 3,678,185 people
- By 2030
- 3,856,546 · +4.8%
- By 2040
- 4,171,407 · +13.4%
- By 2050
- 4,421,607 · +20.2%
- By 2075
- 4,831,599 · +31.4%
- By 2100
- 4,832,502 · +31.4%
Race, ethnicity, and origin ACS 2023
- Neighborhood character
- Predominantly Hispanic (67%)
- Race & ethnicity
- Hispanic / Latino 67% Two or more races 22% Asian 16% White 9% Black 4% Native American 1%
- Hispanic origin (detail)
- Mexican 63% Puerto Rican 1%
- Common ancestry
- Italian 1%
- Foreign-born
- 37% · Canada
- Languages at home
- 30% English-only · Spanish 55% Tagalog/Filipino 12% Other Asian/Pacific 1%
Political lean MEDSL · San Diego
- 2024 margin
- D (+16.8) · D 56.9% · R 40.1% · Other 2.9%
- 2008→2024 swing
- +6.6pp toward D · 2008: 10.2pp · 2024: 16.8pp
- All cycles
- 2024: D+16.8 2020: D+22.8 2016: D+17.8 2012: D+5.1 2008: D+10.2
Not yet ingested
- Civics
- —
Market trends
- HPI YoY
- ▼ -495.29%
- Current HPI
- 451.3388
- Rent YoY
- ▲ 2.76%
- Metro
- San Diego-Chula Vista-Carlsbad, CA
- State GDP YoY
- ▲ 3.21%
- F500 in state
- 116
Industry mix (Fortune 500 HQ in CA)
| Industry | F500 HQs | Revenue |
|---|---|---|
| Technology | 27 | $1,492B |
|
||
| Financial Services | 3 | $174B |
|
||
| Retail | 3 | $44B |
|
||
| Insurance | 3 | $26B |
|
||
| Media / Entertainment | 2 | $115B |
|
||
| Pharmaceuticals / Biotech | 2 | $62B |
|
||
Price history
+598.0% since first listed14 events — show timeline
- 2026-06-16 Listed $2,300,000 CRMLS
- 2026-02-10 Listing Removed — CRMLS
- 2025-12-10 Price Changed $2,000,000 CRMLS
- 2025-12-09 Price Changed $2,350,000 CRMLS
- 2025-12-05 Listed $2,450,000 CRMLS
- 2024-02-05 Rental Removed $1,550 APPFOLIO
- 2024-01-24 Listed for Rent $1,550 APPFOLIO
- 2021-07-01 Listing Removed — SDMLS
- 2021-06-15 Sold (Public Records) $1,400,000 Public Records
- 2021-01-20 Listed $1,449,000 SDMLS
- 2020-12-22 Listing Removed — SDMLS
- 2020-10-08 Listed $1,510,000 SDMLS
- 2019-01-31 Sold (Public Records) $1,227,000 Public Records
- 2001-03-15 Sold (Public Records) $329,500 Public Records
Property tax history
+5.0%/yrLatest (2025): $21,304 · +4.0% YoY. Source: county tax records.
Cash-flow waterfall
monthlySold comps — $/sqft
last 12 mo · ≤1 miLoading sold comps…