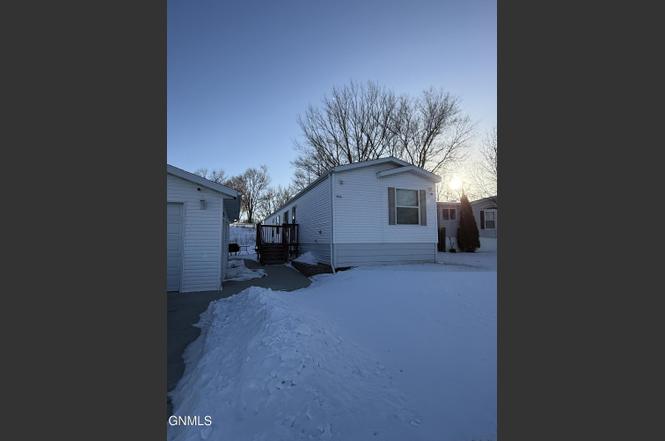
4005 North 19th St #506 · Bismarck, ND
Flood risk No data
- FEMA flood zone
- —
- Chance of flooding over 30 yrs
- —
- Est. flood insurance / yr
- —
Fire risk No data
- Est. fire insurance / yr
- —
Heat risk No data
- Hot days now (above threshold)
- —
- Hot days in 30 yrs
- —
Wind risk No data
- Chance of severe wind over 30 yrs
- —
Air-quality risk No data
- Unhealthy air days now
- —
- Unhealthy air days in 30 yrs
- —
Risk factors via First Street. Map © Google.
Why this score? — see what drove the B- grade
The composite is a weighted blend of 9 inputs, each scored 0–100. Each bar is that input's sub-score; the figure is the points it added to the 100-point composite (weight × sub-score).
- Cash flow +30.0/30.0
- 1% rule +10.0/10.0
- DSCR +10.0/10.0
- Rent growth +5.0/5.0
- Livability +4.0/5.0
- Schools +3.7/10.0
- Condition / age +2.5/5.0
- ARV discount +2.3/15.0
- Appreciation +0.0/10.0
$99,900
🖨 Deal sheet 📄 Offer letter ✓ Due diligence
Key facts
- 2 garage spots
- Built 2016
- Listed 139 days
Property features AI
Exterior
- Parking: Detached garage; 2 garage spaces; On-site and off-street parking
- Security: Security system
- Utilities: Public water; Public sewer; Natural gas available and connected; Electricity connected; Water connected; Sewer connected
- Home design: Manufactured home (single wide); One level; Residential property
- Construction: Vinyl siding; Shingle (asphalt) roof; Pillar/post/pier foundation; Built as a manufactured home
- Exterior features: Garden; Shed(s)
Interior
- Kitchen: Dishwasher; Gas range; Oven; Microwave
- Flooring: Vinyl flooring; Carpet
- Bathrooms: One full bathroom; One three-quarter bathroom
- Heating & cooling: Forced air heating (natural gas); Central air conditioning
- Interior features: Security system; Garden
- Laundry & utility: Washer; Dryer
Neighborhood map
What this means for you Summary
Snapshot
- This is a 3-bed/2.0-bath manufactured listed at $100k.
Deal economics
- At list price, monthly cash flow is $799 ($10k/yr) — positive.
- The deal already cash-flows at list — no discount required.
- Meets the 1% rule at list price ($2k rent vs $100k).
- Recommended offer: $88k (12.0% below list) — sets the bar for market timing.
- Cap rate 15.9% vs local median 3.1% in Bismarck — top-decile yield for the area; either an underpriced asset or a hidden risk that comps aren't pricing in. Stress-test before assuming the spread holds.
Location & tenants
- Location reads 79/100 on livability (#5 in ND, #2,213 nationally) — a middle-class / working-renter tenant base. Strengths: housing A+, health & safety A+, cost of living A; Watch: crime C-, amenities D+, commute F.
- Bismarck 1 (urban): math 41% / reading 42% proficiency, ranked #25 of 53 in ND (top 47%) — families likely to look elsewhere, expect single-tenant / working-renter base with shorter leases; only 19% free/reduced lunch — higher-income household profile.
- Market conditions: Rents rising fast (+11.8%/yr); 481 active listings in the ZIP; 8 comparable units currently listed for rent nearby; rentals at typical pace (median 21d on market — plan ~3-4 weeks tenant-placement turnaround); solid renter incomes; 259 units permitted in Burleigh County in 2024 (0 in 5+ unit buildings).
Forward outlook
- Local home prices are declining (-3.0%/yr); year-one equity from $691 of loan paydown is wiped out by about $3k of value loss. Plan a longer hold.
- Burleigh County population projected at +61% by 2050 — long-run rental-demand tailwind backs the buy-and-hold thesis.
- At projected returns (-3.0% appreciation + 8.0% rent growth), your $28k cash investment doubles in ~4 years — after that, you're playing with house money.
Negotiation context
- It's been on market 140 days — a 12% lower offer ($88k) is reasonable based on typical stale-listing flexibility.
Questions for the listing agent
- It's been on market 140 days. Have you received any prior offers? Is the seller open to a 12% concession, seller financing, or rate buy-down credit?
- Why hasn't it sold? Are there any deal-killer items the seller is aware of (foundation, flood, title, zoning, code violations)?
- Is there a deadline driving the sale (1031 exchange, divorce, estate, relocation)? That informs how much negotiation room exists.
- Schools are B-rated — typically a magnet for longer-tenancy family renters. What's the average tenant stay here, and is there a school-zone premium baked into asking?
- What's the average days-on-market for RENTAL listings here right now (not sales)? A rising rental-DOM trend means longer vacancies and softer asking-rent achievability than the comps imply.
- What's the recent tenant-quality profile in this submarket — average credit score on applications, eviction rate, late-payment / NSF rate, and stable-employment percentage? A property-management company in the area should have these aggregated.
- How much new for-sale + rental construction is in the pipeline within 1–3 miles? Heavy new supply typically softens prices + rents 12–24 months out; constrained supply supports both.
Investment metrics
- 1% rule
- 1.89% ✓
- Cap rate
- 15.88%
- Cash-on-cash
- 34.26%
- DSCR
- 2.52
- GRM
- 4.4
CMA / ARV
- ARV (on-the-fly)
- $89,600
- Comps found
- 3
Show comp detail 3 sales within ~0.75 mi
| Address | Dist | Beds/Ba | Sqft | Sold | Price | $/sf | Match |
|---|---|---|---|---|---|---|---|
| 4005 19th St N #514 | 0.00mi | 3/2.0 | 1,216 (-5%) | 18mo | $85,000 | $70 | 77 |
| 1718 Chandler Ln | 0.44mi | 3/2.0 | 1,232 (-4%) | 2mo | $84,900 | $69 | 71 |
| 4012 North Valley Loop | 0.50mi | 3/2.0 | 1,232 (-4%) | 13mo | $99,900 | $81 | 60 |
Match score weights: distance 35% · size 25% · config 20% · recency 20%. Top-matched comps best support the ARV.
Projected returns pro-forma
-3.0% appreciation · 8.0% rent growth · sell at horizon
- IRR
- 35.2%
- Equity multiple
- 2.60×
- Total profit
- $44,660
- Equity at exit
- $14,895
- IRR
- 44.6%
- Equity multiple
- 6.36×
- Total profit
- $149,827
- Equity at exit
- $8,638
Cash invested: $27,972 (down + closing). Projections, not guarantees.
Landlord ↔ Tenant lean methodology
- Overall (STATE)
- 82 Strongly Landlord-Friendly
- State North Dakota
- 82 Strongly Landlord-Friendly · R+20
- County
- — inherits STATE
- City
- — inherits STATE
ZIP-level market 58503
- Home prices YoY
- -25.6%
- Rents YoY
- 11.8%
- Active inventory
- 481
- Price-to-rent
- 4.4×
Monthly cashflow live
- Estimated rent
- $1,885 high interval (Pro) →
- Mortgage (P&I)
- −$524
- Tax est. 1.5%
- −$125 /mo · $1,498/yr
- Insurance
- −$42
- HOA
- −$0
- Vacancy / Maint / Mgmt
- −$396
- Net cashflow
- $799
Break-even live
UW: 25.0% down · 7.5% · 30yr · 1.5% tax · 5.0% vac · 8.0% maint · 8.0% mgmt
Financing live
Cash to close
- Down payment
- $24,975
- Closing costs
- $2,997
- Reserves months
- —
- Total cash needed
- —
Loan-product check · same deal, 3 products live
Conventional
25% down · 7.5% · 30yr
- Down + closing
- —
- Monthly P&I
- —
- Monthly cashflow
- —
- DSCR
- —
- Eligible?
- —
Personal DTI + credit; lowest rate.
DSCR
20% down · 8.5% · 30yr
- Down + closing
- —
- Monthly P&I
- —
- Monthly cashflow
- —
- DSCR
- —
- Eligible?
- —
No personal income docs; deal must DSCR.
Hard money
10% down · 12.0% · 12mo
- Down + closing
- —
- Monthly P&I
- —
- Monthly cashflow
- —
- DSCR
- —
- Eligible?
- —
Short-term bridge; refi at stabilization.
Rent comps 8 comps
| Address | Beds | Baths | Sqft | Rent | $/sqft | DOM | Units | Dist |
|---|---|---|---|---|---|---|---|---|
| 4309 N 19th St Bismarck, ND | 2.0 | 2.0 | 1100 | $1,955 | $1.78 | 21d | 1 | 0.35mi |
| 3009 43rd Ave NE Bismarck, ND | 3.0 | 1.0–2.0 | 1051 | $2,024 | $1.93 | 21d | 22 | 0.56mi |
| 3103 E Calgary Ave Bismarck, ND | 1.0–3.0 | 1.0–2.0 | 1079 | $1,860 | $1.72 | 21d | 6 | 0.66mi |
| 1600 Mapleton Ave Unit 104 Bismarck, ND | 3.0 | 2.0 | 1456 | $1,600 | $1.10 | 21d | 1 | 0.86mi |
| 3504 French St Bismarck, ND | 2.0 | 1.5 | 966 | $1,795 | $1.86 | 21d | 1 | 1.20mi |
| 1834 E Capitol Ave Bismarck, ND | 1.0–3.0 | 1.0–2.0 | 1116 | $1,770 | $1.59 | 21d | 13 | 1.39mi |
| 4126A Normandy St Bismarck, ND | 2.0 | 1.5 | 1468 | $1,750 | $1.19 | 21d | 1 | 1.41mi |
| 1820 E Capitol Ave Bismarck, ND | 1.0–2.0 | 1.0–2.0 | 1048 | $1,545 | $1.47 | 21d | 12 | 1.42mi |
Listing history 21 events
-
2026-06-19days on market $99,900 Active 140 DOM
-
2026-06-18days on market $99,900 Active 139 DOM
-
2026-06-17days on market $99,900 Active 138 DOM
-
2026-06-16days on market $99,900 Active 137 DOM
-
2026-06-15days on market $99,900 Active 136 DOM
-
2026-06-14days on market $99,900 Active 134 DOM
-
2026-06-13days on market $99,900 Active 133 DOM
-
2026-06-10days on market $99,900 Active 131 DOM
-
2026-06-09days on market $99,900 Active 130 DOM
-
2026-06-08days on market $99,900 Active 129 DOM
-
2026-06-07days on market $99,900 Active 128 DOM
-
2026-06-05days on market $99,900 Active 125 DOM
-
2026-06-03days on market $99,900 Active 124 DOM
-
2026-06-02days on market $99,900 Active 123 DOM
-
2026-06-01days on market $99,900 Active 122 DOM
-
2026-05-31days on market $99,900 Active 121 DOM
-
2026-05-30days on market $99,900 Active 120 DOM
-
2026-04-23price $99,900
-
2026-03-11price $114,900
-
2026-01-30price $119,900
-
2026-01-29$115,500 Active
ⓘ Source: listings_history table (triggers on properties + properties_extension) + one-shot
backfill from property_details.listing_events for pre-trigger history.
Nearby sold comps map
Loading sold comps map…
Walkable amenities ~0.75 mi
Loading nearby amenities…
Taxation est. · year 1
- Rental income
- $22,617
- − Mortgage interest
- −$5,596
- − Property taxes
- −$1,498
- − Insurance
- −$500
- − Repairs & maintenance
- −$1,809
- − Management
- −$1,809
- − Depreciation
- −$2,906
- Taxable income
- $8,498
- Est. tax owed @ 24.0%
- −$2,039
- After-tax cash flow
- $7,543/yr
For passive investors: Depreciation is non-cash, so a rental often shows a tax loss while cash-flowing — sheltering income. Rental losses are passive: they offset passive income freely, and up to $25,000/yr can offset ordinary (W-2) income if you actively participate and your MAGI is under $100k (phasing out to $0 by $150k); unused losses carry forward. On sale, claimed depreciation is recaptured at up to 25%, and gains may owe capital-gains tax (a 1031 exchange can defer both). Figures are a year-1 estimate at your 24.0% rate — not tax advice; consult a CPA.
Schools (NCES district)
- District
- Bismarck 1
- NCES district ID
- 3800014
- Math proficiency
- 41% ▼ -5.00%
- Reading proficiency
- 42% ▼ -6.00%
- Median HH income
- $60,649
- Composite
- 36.76/100
- National rank
- #4577
- State rank
- #25 of 53 in ND
Livability — Bismarck
- Score
- 79/100
- State rank
- #5
- US rank
- #2213
Category grades
Schools grade is shown separately in the Schools card above.
Census & demographics
- Census place
- Bismarck, ND
- County
- Burleigh County · 97,300 people
- City population
- 97,300
- Metro
- Bismarck, ND
- Population (ZIP)
- 37,683
- Household income
- $102,333
- Rent vs Own
- Severe rent burden
- 814.0
Population outlook (Burleigh County) Hauer SSP2
- Today (2025)
- 119,359 people
- By 2030
- 133,047 · +11.5%
- By 2040
- 161,545 · +35.3%
- By 2050
- 191,960 · +60.8%
- By 2075
- 274,569 · +130.0%
- By 2100
- 350,910 · +194.0%
Race, ethnicity, and origin ACS 2023
- Neighborhood character
- Predominantly White (89%)
- Race & ethnicity
- White 89% Two or more races 6% Hispanic / Latino 2% Asian 2% Black 1%
- Common ancestry
- Portuguese 17% Scotch-Irish 4% Scottish 2%
- Foreign-born
- 3% · Canada
- Languages at home
- 95% English-only · German/W. Germanic 2% Spanish 1% Tagalog/Filipino 1%
Political lean MEDSL · Burleigh
- 2024 margin
- Solid R (+43.2) · D 27.5% · R 70.7% · Other 1.8%
- 2008→2024 swing
- -19.7pp toward R · 2008: -23.6pp · 2024: -43.2pp
- All cycles
- 2024: R+43.2 2020: R+40.2 2016: R+46.1 2012: R+32.1 2008: R+23.6
Not yet ingested
- Civics
- —
Market trends
- HPI YoY
- ▼ -76.96%
- Current HPI
- 223.9683
- Rent YoY
- ▲ 11.79%
- Metro
- Bismarck, ND
- State GDP YoY
- ▲ 2.09%
- F500 in state
- 2
Industry mix (Fortune 500 HQ in ND)
| Industry | F500 HQs | Revenue |
|---|---|---|
| Utilities / Construction | 1 | $6B |
|
||
Price history
-13.5% since first listed4 events — show timeline
- 2026-04-23 Price Changed $99,900 GNMLS
- 2026-03-11 Price Changed $114,900 GNMLS
- 2026-01-30 Price Changed $119,900 GNMLS
- 2026-01-29 Listed $115,500 GNMLS
Cash-flow waterfall
monthlySold comps — $/sqft
last 12 mo · ≤1 miLoading sold comps…