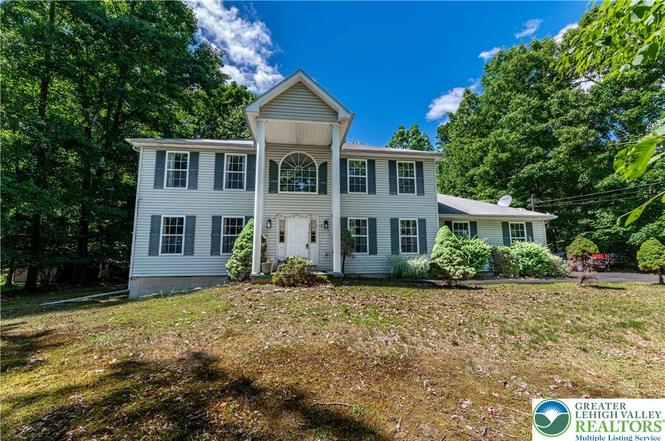
2014 Gorden Ridge Dr · Arlington Heights, PA
Flood risk 1/10 · Minimal
- FEMA flood zone
- X (unshaded)
- Chance of flooding over 30 yrs
- 0.0%
- Est. flood insurance / yr
- $473 – $860
Fire risk 4/10 · Minor
- Est. fire insurance / yr
- $511 – $949
Heat risk 3/10 · Minor
- Hot days now (above 94°F)
- 7 days/yr
- Hot days in 30 yrs
- 15 days/yr
Wind risk 4/10 · Minor
- Chance of severe wind over 30 yrs
- 9.0%
Air-quality risk 2/10 · Minimal
- Unhealthy air days now
- 1 days/yr
- Unhealthy air days in 30 yrs
- 2 days/yr
Risk factors via First Street. Map © Google.
Why this score? — see what drove the D+ grade
The composite is a weighted blend of 9 inputs, each scored 0–100. Each bar is that input's sub-score; the figure is the points it added to the 100-point composite (weight × sub-score).
- ARV discount +13.7/15.0
- Cash flow +13.5/30.0
- 1% rule +4.7/10.0
- DSCR +4.1/10.0
- Livability +3.9/5.0
- Schools +3.0/10.0
- Rent growth +2.5/5.0
- Condition / age +2.5/5.0
- Appreciation +0.0/10.0
$359,900
🖨 Deal sheet (PDF) 📄 Offer letter ✓ Due diligence
Listing remarks
Welcome to 4-bedroom, 2.5-bath Colonial located in the desirable South Ridge neighborhood. Two-story central hall foyer welcomes you with a Palladian window that fills the space with natural light and a modern light fixture that sets the tone for the home's inviting interior. The formal living room offers wall-to-wall carpeting, while the spacious family room features durable vinyl plank flooring. The formal dining room is accented with vinyl plank floors, a ceiling fan, and sliding glass doors providing easy access to the rear deck. The bright and airy kitchen boasts a breakfast island and a dining area highlighted by a charming bump-out window overlooking the backyard. Upstairs, all four
Key facts
- Breakfast island
- Bump-out window
- Palladian window
Tags
Property features AI
Exterior
- Parking: Attached 2-car garage; Driveway and off-street parking
- Utilities: Electric with circuit breakers; Well water; Septic tank
- Home design: Two-story home; Vinyl siding; Facing and entry level not specified
- Construction: Vinyl siding construction; Asphalt/fiberglass roof; Full finished basement
- Exterior features: Deck; Wooded, mostly flat lot; Public paved road frontage; Has a view
Interior
- Kitchen: Dishwasher; Electric cooktop; Electric oven; Electric range; Kitchen island; Eat-in kitchen
- Bedrooms: Bedrooms on multiple levels (details not specified)
- Flooring: Carpet; Luxury vinyl / luxury vinyl plank; Tile; Vinyl
- Bathrooms: 2 full bathrooms; 1 half bathroom
- Heating & cooling: Central air; Ceiling fans; Oil hot water baseboard heating
- Interior features: Dining area and a separate/formal dining room; Entrance foyer; Eat-in kitchen with kitchen island; Game room; Main-level family room; Walk-in closets
- Laundry & utility: Washer hookup; Dryer hookup; Electric water heater
Neighborhood map
What this means for you Summary
Snapshot
- This is a 3-bed/2.0-bath single-family listed at $360k.
Deal economics
- At list price, monthly cash flow is $10 ($121/yr) — positive.
- The deal already cash-flows at list — no discount required.
- To meet the 1% rule (rent ≥ 1% of price), the offer needs to be $350k (2.8% below list).
- Recommended offer: $350k (2.8% below list) — sets the bar for 1% rule.
- Cap rate 6.3% vs local median 3.4% in Arlington Heights — top-decile yield for the area; either an underpriced asset or a hidden risk that comps aren't pricing in. Stress-test before assuming the spread holds.
Location & tenants
- Location reads 77/100 on livability (#317 in PA, #2,815 nationally) — a middle-class / working-renter tenant base. Strengths: cost of living A+, health & safety A+, housing A; Watch: amenities D, employment D.
- East Stroudsburg Area SD (rural): math 25% / reading 43% proficiency, ranked #413 of 539 in PA (top 77%) — families likely to look elsewhere, expect single-tenant / working-renter base with shorter leases.
- Zoned schools: East Stroudsburg El Sch (math 32% / reading 52%, grade F, #883 of 1,518 statewide, top 61%, 605 students, 58% FRL); J T Lambert Intermediate Sch (math 11% / reading 44%, grade F, #399 of 512 statewide, top 79%, 942 students, 61% FRL); East Stroudsburg Shs South (math 43% / reading 50%, grade D-, #177 of 437 statewide, top 40%, 1,338 students, 48% FRL).
- Market conditions: 272 active listings in the ZIP; 1 comparable units currently listed for rent nearby; 278 units permitted in Monroe County in 2024 (52 in 5+ unit buildings).
Forward outlook
- Local home prices are declining (-3.0%/yr); year-one equity from $2k of loan paydown is wiped out by about $11k of value loss. Plan a longer hold.
- Monroe County population projected at -11% by 2050 — secular population decline; favor cash flow + early exit over multi-decade hold.
Negotiation context
- Only 3 days on market — expect competitive offers; lowballing is unlikely to land.
- 6 sale attempts since 8y ago with the ask held roughly flat each time — persistent listings suggest the price (not the market) is what's stuck; bring a comps-based counter.
Questions for the listing agent
- Is there a deadline driving the sale (1031 exchange, divorce, estate, relocation)? That informs how much negotiation room exists.
- Schools are F-rated, which usually means shorter tenancies and higher turnover. Who's the typical renter profile here, and what's been the actual vacancy rate?
- The area grade is low — what's the realistic commute time and amenity access for the typical tenant pool here? Any planned neighborhood developments (good or bad) we should know about?
- What's the average days-on-market for RENTAL listings here right now (not sales)? A rising rental-DOM trend means longer vacancies and softer asking-rent achievability than the comps imply.
- What's the recent tenant-quality profile in this submarket — average credit score on applications, eviction rate, late-payment / NSF rate, and stable-employment percentage? A property-management company in the area should have these aggregated.
- How much new for-sale + rental construction is in the pipeline within 1–3 miles? Heavy new supply typically softens prices + rents 12–24 months out; constrained supply supports both.
Investment metrics
- 1% rule
- 0.97% ✗
- Cap rate
- 6.33%
- Cash-on-cash
- 0.12%
- DSCR
- 1.01
- GRM
- 8.6
CMA / ARV
- ARV (on-the-fly)
- $417,232
- Comps found
- 12
Show comp detail 12 sales within ~0.75 mi
| Address | Dist | Beds/Ba | Sqft | Sold | Price | $/sf | Match |
|---|---|---|---|---|---|---|---|
| 303 Pheasant Run | 0.24mi | 3/2.5 | 2,090 (-11%) | 0mo | $385,300 | $184 | 69 |
| 2043 Gorden Ridge Dr | 0.34mi | 3/2.5 | 2,194 (-6%) | 10mo | $425,000 | $194 | 63 |
| 84 Lenape Dr | 0.49mi | 4/3.0 (+1) | 2,360 (+1%) | 8mo | $320,000 | $136 | 60 |
| 361 Hallowood Dr | 0.65mi | 3/2.0 | 2,348 (+0%) | 16mo | $370,000 | $158 | 57 |
| 72 Lenape Dr | 0.60mi | 4/3.0 (+1) | 2,280 (-3%) | 10mo | $345,000 | $151 | 50 |
| 551 Highland Dr | 0.69mi | 4/2.5 (+1) | 2,424 (+3%) | 10mo | $365,000 | $151 | 47 |
| 1037 Bear Swamp Rd | 0.37mi | 4/2.5 (+1) | 2,150 (-8%) | 20mo | $369,500 | $172 | 45 |
| 438 Rolling Hill Way | 0.56mi | 3/2.0 | 2,165 (-8%) | 23mo | $510,000 | $236 | 42 |
| 108 Lenape Dr | 0.39mi | 4/2.5 (+1) | 2,621 (+12%) | 17mo | $467,000 | $178 | 41 |
| 18 Adam Labar Rd | 0.63mi | 4/2.5 (+1) | 2,627 (+12%) | 6mo | $515,000 | $196 | 38 |
| 542 Hallowood Dr | 0.72mi | 3/2.5 | 2,637 (+12%) | 12mo | $520,000 | $197 | 34 |
| 62 Lenape Dr | 0.67mi | 4/2.0 (+1) | 2,012 (-14%) | 23mo | $323,000 | $161 | 21 |
Match score weights: distance 35% · size 25% · config 20% · recency 20%. Top-matched comps best support the ARV.
Projected returns pro-forma
-3.0% appreciation · 3.0% rent growth · sell at horizon
- IRR
- -16.0%
- Equity multiple
- 0.43×
- Total profit
- $-57,460
- Equity at exit
- $53,662
- IRR
- -7.6%
- Equity multiple
- 0.52×
- Total profit
- $-48,325
- Equity at exit
- $31,118
Cash invested: $100,772 (down + closing). Projections, not guarantees.
Landlord ↔ Tenant lean methodology
- Overall (STATE)
- 62 Landlord-Friendly
- State Pennsylvania
- 62 Landlord-Friendly · EVEN
- County
- — inherits STATE
- City
- — inherits STATE
ZIP-level market 18302
- Home prices YoY
- -20.6%
- Active inventory
- 272
- Price-to-rent
- 8.6×
Monthly cashflow live
- Estimated rent
- $3,500 medium interval (Pro) →
- Mortgage (P&I)
- −$1,887
- Tax from tax record
- −$718 /mo · $8,611/yr
- Insurance
- −$150
- HOA
- −$0
- Vacancy / Maint / Mgmt
- −$735
- Net cashflow
- $10
Break-even live
Sensitivity live
| Price | -10% $214 | -5% $112 | +0% $10 | +5% $-92 | +10% $-194 |
|---|---|---|---|---|---|
| Rent | -10% $-266 | -5% $-128 | +0% $10 | +5% $148 | +10% $287 |
| Rate | -1.0pp $191 | -0.5pp $102 | base $10 | +0.5pp $-83 | +1.0pp $-178 |
UW: 25.0% down · 7.5% · 30yr · 1.5% tax · 5.0% vac · 8.0% maint · 8.0% mgmt
Financing live
Cash to close
- Down payment
- $89,975
- Closing costs
- $10,797
- Reserves months
- —
- Total cash needed
- —
Loan-product check · same deal, 3 products live
Conventional
25% down · 7.5% · 30yr
- Down + closing
- —
- Monthly P&I
- —
- Monthly cashflow
- —
- DSCR
- —
- Eligible?
- —
Personal DTI + credit; lowest rate.
DSCR
20% down · 8.5% · 30yr
- Down + closing
- —
- Monthly P&I
- —
- Monthly cashflow
- —
- DSCR
- —
- Eligible?
- —
No personal income docs; deal must DSCR.
Hard money
10% down · 12.0% · 12mo
- Down + closing
- —
- Monthly P&I
- —
- Monthly cashflow
- —
- DSCR
- —
- Eligible?
- —
Short-term bridge; refi at stabilization.
Rent comps 1 comps
| Address | Beds | Baths | Sqft | Rent | $/sqft | DOM | Units | Dist |
|---|---|---|---|---|---|---|---|---|
| 310 Jennifer Ln East Stroudsburg, PA | 4.0 | 2.5 | 2200 | $3,500 | $1.59 | 45d | 1 | 1.21mi |
Listing history 5 events
-
2026-06-21status $359,900 Pending 3 DOM
-
2026-06-19days on market $359,900 Active 3 DOM
-
2026-06-18days on market $359,900 Active 2 DOM
-
2026-06-17remarks 699-char remark
-
2026-06-17$359,900 Active 1 DOM
ⓘ Source: listings_history table (triggers on properties + properties_extension) + one-shot
backfill from property_details.listing_events for pre-trigger history.
Tax reassessment forecast PA · Partial reset (capped growth)
- Current annual tax
- $8,611 · $718/mo
- Projected year-2 tax
- $8,611 · $718/mo
- Expected delta
- $0/yr ($0/mo · 0.0%)
ⓘ Screening estimate from a state-policy table — verify with the county assessor before closing.
Climate risk First Street
- Flood 1/10 Low FEMA zone X (unshaded) · 0% chance over 30 yrs
- Wildfire 4/10 Moderate
- Heat 3/10 Moderate 7 d/yr ≥94°F today · 15 d/yr by 30 yrs out
- Wind 4/10 Moderate 9% chance of damaging wind over 30 yrs
- Air quality 2/10 Low 1 unhealthy d/yr today · 2 by 30 yrs out
Nearby sold comps map
Loading sold comps map…
Walkable amenities ~0.75 mi
Loading nearby amenities…
Taxation est. · year 1
- Rental income
- $42,000
- − Mortgage interest
- −$20,160
- − Property taxes
- −$8,611
- − Insurance
- −$1,800
- − Repairs & maintenance
- −$3,360
- − Management
- −$3,360
- − Depreciation
- −$10,470
- Taxable loss
- −$5,761
- Est. tax savings @ 24.0%
- +$1,383
- After-tax cash flow
- $1,504/yr
For passive investors: Depreciation is non-cash, so a rental often shows a tax loss while cash-flowing — sheltering income. Rental losses are passive: they offset passive income freely, and up to $25,000/yr can offset ordinary (W-2) income if you actively participate and your MAGI is under $100k (phasing out to $0 by $150k); unused losses carry forward. On sale, claimed depreciation is recaptured at up to 25%, and gains may owe capital-gains tax (a 1031 exchange can defer both). Figures are a year-1 estimate at your 24.0% rate — not tax advice; consult a CPA.
Schools (NCES district)
- District
- East Stroudsburg Area SD
- NCES district ID
- 4208670
- Math proficiency
- 25% ▼ -11.00%
- Reading proficiency
- 43% ▼ -18.00%
- Median HH income
- $57,142
- Composite
- 30.13/100
- National rank
- #6332
- State rank
- #413 of 539 in PA
Livability — Arlington Heights
- Score
- 77/100
- State rank
- #317
- US rank
- #2815
Category grades
Schools grade is shown separately in the Schools card above.
Census & demographics
- Population (ZIP)
- 17,593
Population outlook (Monroe County) Hauer SSP2
- Today (2025)
- 164,099 people
- By 2030
- 161,412 · -1.6%
- By 2040
- 154,616 · -5.8%
- By 2050
- 146,710 · -10.6%
- By 2075
- 140,830 · -14.2%
- By 2100
- 138,472 · -15.6%
Race, ethnicity, and origin ACS 2023
- Neighborhood character
- Diverse neighborhood (Simpson 0.63)
- Race & ethnicity
- White 53% Hispanic / Latino 24% Black 17% Two or more races 12% Asian 2%
- Hispanic origin (detail)
- Puerto Rican 8% Dominican 2%
- Common ancestry
- Romanian 4% Lithuanian 2% Slovak 2%
- Foreign-born
- 13% · Canada, Jamaica
- Languages at home
- 79% English-only · Spanish 13% Other Indo-European 2% French/Haitian/Cajun 2%
Political lean MEDSL · Monroe
- 2024 margin
- Toss-up / Even · D 49.1% · R 49.9%
- 2008→2024 swing
- -17.1pp toward R · 2008: 16.3pp · 2024: -0.8pp
- All cycles
- 2024: R+0.8 2020: D+6.4 2016: D+0.3 2012: D+14.0 2008: D+16.3
Not yet ingested
- Civics
- —
Market trends
- HPI YoY
- ▼ -41.00%
- Current HPI
- 157.9833
- Rent YoY
- —
- Metro
- —
- State GDP YoY
- ▲ 1.68%
- F500 in state
- 34
Industry mix (Fortune 500 HQ in PA)
| Industry | F500 HQs | Revenue |
|---|---|---|
| Healthcare | 2 | $309B |
|
||
| Insurance | 2 | $27B |
|
||
| Telecommunications / Media | 1 | $124B |
|
||
| Industrial Distribution | 1 | $22B |
|
||
| Financial Services | 1 | $20B |
|
||
| Chemicals / Materials | 1 | $18B |
|
||
Price history
+60.7% since first listed9 events — show timeline
- 2026-06-16 Listed $359,900 GLVRMLS
- 2025-04-04 Listing Removed — BRIGHT MLS
- 2025-04-04 Listing Removed — GLVRMLS
- 2025-03-30 Listed $360,000 BRIGHT MLS
- 2025-03-26 Coming Soon — BRIGHT MLS
- 2025-03-25 Listed $360,000 PMAR
- 2025-03-25 Listed $360,000 GLVRMLS
- 2021-07-13 Listed $335,000 PMAR
- 2018-11-14 Listed $223,900 PMAR
Property tax history
+0.5%/yrLatest (2026): $8,611 · +1.7% YoY. Source: county tax records.
Cash-flow waterfall
monthlySold comps — $/sqft
last 12 mo · ≤1 miLoading sold comps…