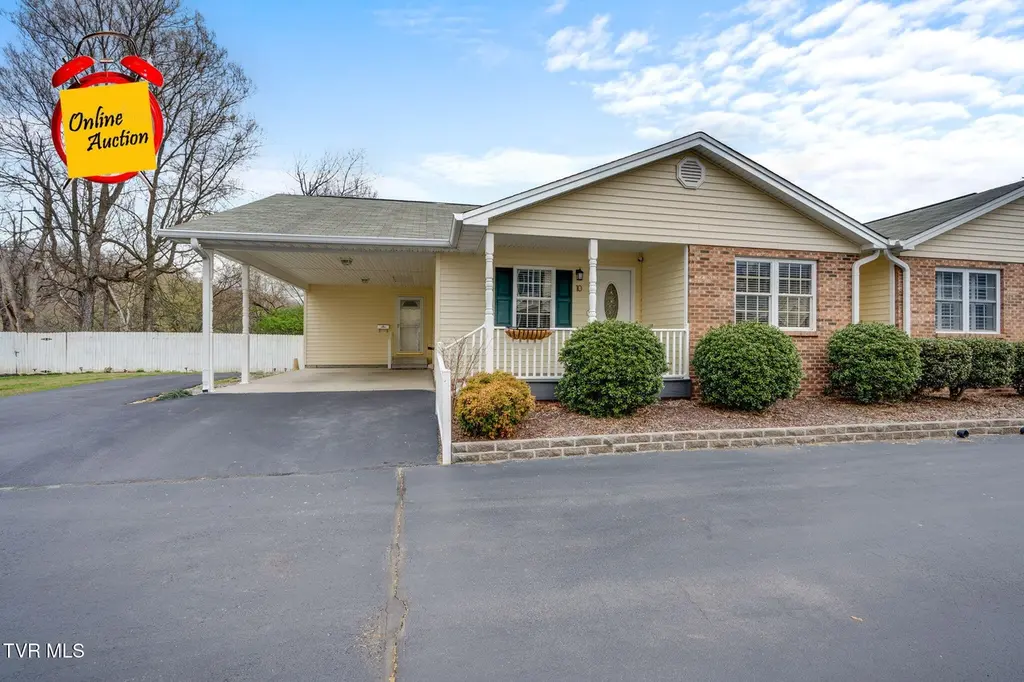
703 Main St Apt 10 · Elizabethton, TN
Flood risk 5/10 · Moderate
- FEMA flood zone
- AE
- Chance of flooding over 30 yrs
- 0.24%
- Est. flood insurance / yr
- $1,358 – $5,099
Fire risk 2/10 · Minimal
- Est. fire insurance / yr
- $949 – $1,763
Heat risk 5/10 · Moderate
- Hot days now (above threshold)
- 7 days/yr
- Hot days in 30 yrs
- 22 days/yr
Wind risk No data
- Chance of severe wind over 30 yrs
- —
Air-quality risk No data
- Unhealthy air days now
- —
- Unhealthy air days in 30 yrs
- —
Risk factors via First Street. Map © Google.
Why this score? — see what drove the D grade
The composite is a weighted blend of 9 inputs, each scored 0–100. Each bar is that input's sub-score; the figure is the points it added to the 100-point composite (weight × sub-score).
- Cash flow +15.0/30.0
- ARV discount +7.5/15.0
- 1% rule +5.0/10.0
- DSCR +5.0/10.0
- Livability +3.3/5.0
- Schools +2.9/10.0
- Rent growth +2.5/5.0
- Condition / age +2.5/5.0
- Appreciation +0.0/10.0
$10,000
🖨 Deal sheet (PDF) 📄 Offer letter ✓ Due diligence
Listing remarks
THIS PROPERTY IS SELLING AT ONLINE AUCTION. BY NO MEANS IS THE STARTING THE BID THE ASKING PRICE OR THE FINAL CONTRACT PRICE. PRICE GIVEN TO BE ABLE TO POPULATE TO THIRD PARTY WEB PROVIDERS. ONLINE ONLY AUCTION RARE OPPORTUNITY CONDO ON THE DOE RIVER!!! BIDDING OPENS ON MONDAY MARCH 30TH @ 8:00 AM. BIDDING BEGINS CLOSING ON TUESDAY APRIL 21ST @ 6:00 PM. AUCTIONEERS NOTE: Wake up to the sound of flowing water in this charming 1,338 sq. ft. end unit condo tucked along the banks of the Doe River. Unit 10 at 703 N Main Street is one of the most coveted units in the association -- an end unit position that delivers privacy, extra natural light, and unobstructed views of the Doe River right from
Key facts
- Covered carports
- Direct river access
- Doe river views
Tags
Neighborhood map
What this means for you Summary
Snapshot
- This is a 2-bed/2.0-bath condo listed at $10k.
Deal economics
- At list price, monthly cash flow is $1k ($13k/yr) — positive.
- The deal already cash-flows at list — no discount required.
- Meets the 1% rule at list price ($2k rent vs $10k).
- Recommended offer: $10k (1.5% below list) — sets the bar for market timing.
- Cap rate 171.0% vs local median 3.5% in Elizabethton — top-decile yield for the area; either an underpriced asset or a hidden risk that comps aren't pricing in. Stress-test before assuming the spread holds.
Location & tenants
- Location reads 66/100 on livability (#121 in TN) — a middle-class / working-renter tenant base. Strengths: cost of living A+, housing A, crime A-; Watch: amenities F, commute F, employment F.
- Elizabethton (suburban): math 36% / reading 35% proficiency, ranked #35 of 139 in TN (top 25%) — families likely to look elsewhere, expect single-tenant / working-renter base with shorter leases.
- Zoned schools: Harold Mccormick Elementary (math 27% / reading 32%, grade F, #423 of 952 statewide, top 48%, 380 students, 0% FRL); T A Dugger Junior High School (math 42% / reading 28%, grade F, #65 of 333 statewide, top 20%, 633 students, 0% FRL); Elizabethton High School (math 17% / reading 41%, grade F, #92 of 332 statewide, top 28%, 863 students, 0% FRL) — zoned schools average 0% FRL vs 43% district-wide (43 pts lower); this property's tenant base skews higher-income than the district average.
- Market conditions: 176 active listings in the ZIP; 1 comparable units currently listed for rent nearby; 184 units permitted in Carter County in 2024 (0 in 5+ unit buildings).
Forward outlook
- Local home prices are declining (-3.0%/yr); year-one equity from $69 of loan paydown is wiped out by about $300 of value loss. Plan a longer hold.
- Carter County population projected at -21% by 2050 — secular population decline; favor cash flow + early exit over multi-decade hold.
- At projected returns (-3.0% appreciation + 3.0% rent growth), your $3k cash investment doubles in ~1 year — after that, you're playing with house money.
Negotiation context
- It's been on market 30 days — a 2% lower offer ($10k) is reasonable based on typical stale-listing flexibility.
Risks & watch-outs
- Watch-outs: flood insurance adds $269/mo.
- Climate carrying-cost: in FEMA flood zone AE (mandatory federal flood insurance); extreme-heat days projected 7→22/yr by 2055 (HVAC capex compounding) — expect insurance premiums to compound above CPI over the hold.
Questions for the listing agent
- What's the actual annual flood-insurance premium (NFIP or private), and is the property in a SFHA with mandatory coverage?
- What does the HOA fee cover, when was the last increase, and are there any pending special assessments or reserve-fund shortfalls?
- Any open or pending special assessments — roof, HVAC, plumbing, elevator, façade? What's the per-unit balance and payoff schedule, and is the seller paying it off at close or rolling it to the buyer?
- Is there a deadline driving the sale (1031 exchange, divorce, estate, relocation)? That informs how much negotiation room exists.
- Schools are D-rated, which usually means shorter tenancies and higher turnover. Who's the typical renter profile here, and what's been the actual vacancy rate?
- The area grade is low — what's the realistic commute time and amenity access for the typical tenant pool here? Any planned neighborhood developments (good or bad) we should know about?
- What's the average days-on-market for RENTAL listings here right now (not sales)? A rising rental-DOM trend means longer vacancies and softer asking-rent achievability than the comps imply.
- What's the recent tenant-quality profile in this submarket — average credit score on applications, eviction rate, late-payment / NSF rate, and stable-employment percentage? A property-management company in the area should have these aggregated.
- How much new apartment / multifamily construction is in the pipeline within 1–3 miles? Heavy new supply (>2% of stock underway) typically softens rents 12–24 months out; light construction supports rent growth.
Investment metrics
- 1% rule
- 20.00% ✓
- Cap rate
- 171.04%
- Cash-on-cash
- 588.38%
- DSCR
- 27.18
- GRM
- 0.4
CMA / ARV
No comps found within radius.
Projected returns pro-forma
-3.0% appreciation · 3.0% rent growth · sell at horizon
- IRR
- —
- Equity multiple
- 25.63×
- Total profit
- $68,965
- Equity at exit
- $1,491
- IRR
- —
- Equity multiple
- 55.19×
- Total profit
- $151,721
- Equity at exit
- $865
Cash invested: $2,800 (down + closing). Projections, not guarantees.
Landlord ↔ Tenant lean methodology
- Overall (STATE)
- 87 Strongly Landlord-Friendly
- State Tennessee
- 87 Strongly Landlord-Friendly · R+13
- County
- — inherits STATE
- City
- — inherits STATE
ZIP-level market 37643
- Home prices YoY
- -19.3%
- Active inventory
- 176
- Price-to-rent
- 0.4×
Monthly cashflow live
- Estimated rent
- $2,000 medium interval (Pro) →
- Mortgage (P&I)
- −$52
- Tax est. 1.5%
- −$12 /mo · $150/yr
- Insurance
- −$4
- Flood insurance flood zone
- −$269 /mo · $3,228/yr
- HOA
- −$138
- Vacancy / Maint / Mgmt
- −$420
- Net cashflow
- $1,104
Break-even live
Sensitivity live
| Price | -10% $1,111 | -5% $1,107 | +0% $1,104 | +5% $1,100 | +10% $1,097 |
|---|---|---|---|---|---|
| Rent | -10% $946 | -5% $1,025 | +0% $1,104 | +5% $1,183 | +10% $1,262 |
| Rate | -1.0pp $1,109 | -0.5pp $1,106 | base $1,104 | +0.5pp $1,101 | +1.0pp $1,099 |
UW: 25.0% down · 7.5% · 30yr · 1.5% tax · 5.0% vac · 8.0% maint · 8.0% mgmt
Financing live
Cash to close
- Down payment
- $2,500
- Closing costs
- $300
- Reserves months
- —
- Total cash needed
- —
Loan-product check · same deal, 3 products live
Conventional
25% down · 7.5% · 30yr
- Down + closing
- —
- Monthly P&I
- —
- Monthly cashflow
- —
- DSCR
- —
- Eligible?
- —
Personal DTI + credit; lowest rate.
DSCR
20% down · 8.5% · 30yr
- Down + closing
- —
- Monthly P&I
- —
- Monthly cashflow
- —
- DSCR
- —
- Eligible?
- —
No personal income docs; deal must DSCR.
Hard money
10% down · 12.0% · 12mo
- Down + closing
- —
- Monthly P&I
- —
- Monthly cashflow
- —
- DSCR
- —
- Eligible?
- —
Short-term bridge; refi at stabilization.
Rent comps 1 comps
| Address | Beds | Baths | Sqft | Rent | $/sqft | DOM | Units | Dist |
|---|---|---|---|---|---|---|---|---|
| 107 Ingram St Elizabethton, TN | 3.0 | 2.0 | 1500 | $2,000 | $1.33 | 14d | 1 | 0.86mi |
HOA detail condo
- Monthly dues
- $138 · $1,656/yr
- Likely covers
- water
- Assessments
- None detected in remarks — confirm with the listing agent.
Listing history 2 events
-
2026-04-23status Pending
-
2026-03-24$10,000 Active
ⓘ Source: listings_history table (triggers on properties + properties_extension) + one-shot
backfill from property_details.listing_events for pre-trigger history.
Climate risk First Street
- Flood 5/10 Major FEMA zone AE · 24% chance over 30 yrs
- Wildfire 2/10 Low
- Heat 5/10 Major
Nearby sold comps map
Loading sold comps map…
Walkable amenities ~0.75 mi
Loading nearby amenities…
Taxation est. · year 1
- Rental income
- $24,000
- − Mortgage interest
- −$560
- − Property taxes
- −$150
- − Insurance
- −$3,279
- − Repairs & maintenance
- −$1,920
- − Management
- −$1,920
- − HOA
- −$1,656
- − Depreciation
- −$291
- Taxable income
- $14,224
- Est. tax owed @ 24.0%
- −$3,414
- After-tax cash flow
- $9,832/yr
For passive investors: Depreciation is non-cash, so a rental often shows a tax loss while cash-flowing — sheltering income. Rental losses are passive: they offset passive income freely, and up to $25,000/yr can offset ordinary (W-2) income if you actively participate and your MAGI is under $100k (phasing out to $0 by $150k); unused losses carry forward. On sale, claimed depreciation is recaptured at up to 25%, and gains may owe capital-gains tax (a 1031 exchange can defer both). Figures are a year-1 estimate at your 24.0% rate — not tax advice; consult a CPA.
Schools (NCES district)
- District
- Elizabethton
- NCES district ID
- 4701110
- Math proficiency
- 36% ▼ -12.00%
- Reading proficiency
- 35% ▼ -8.00%
- Median HH income
- $30,800
- Composite
- 28.94/100
- National rank
- #6630
- State rank
- #35 of 139 in TN
Livability — Elizabethton
- Score
- 66/100
- State rank
- #121
- US rank
- #11785
Category grades
Schools grade is shown separately in the Schools card above.
Census & demographics
- Census place
- Elizabethton, TN
- City population
- 513
- Population (ZIP)
- 33,690
Population outlook (Carter County) Hauer SSP2
- Today (2025)
- 54,493 people
- By 2030
- 52,639 · -3.4%
- By 2040
- 47,929 · -12.0%
- By 2050
- 42,877 · -21.3%
- By 2075
- 31,487 · -42.2%
- By 2100
- 21,979 · -59.7%
Race, ethnicity, and origin ACS 2023
- Neighborhood character
- Predominantly White (93%)
- Race & ethnicity
- White 93% Two or more races 3% Hispanic / Latino 3% Black 2%
- Common ancestry
- Serbian 3% Slovak 2% Italian 2%
- Foreign-born
- 2% · Canada
- Languages at home
- 98% English-only · Spanish 2%
Political lean MEDSL · Carter
- 2024 margin
- Solid R (+63.2) · D 17.9% · R 81.2%
- 2008→2024 swing
- -16.1pp toward R · 2008: -47.2pp · 2024: -63.2pp
- All cycles
- 2024: R+63.2 2020: R+61.5 2016: R+64.0 2012: R+52.0 2008: R+47.2
Not yet ingested
- Civics
- —
Market trends
- HPI YoY
- ▼ -77.08%
- Current HPI
- 321.4024
- Rent YoY
- —
- Metro
- —
- State GDP YoY
- ▲ 2.78%
- F500 in state
- 22
Industry mix (Fortune 500 HQ in TN)
| Industry | F500 HQs | Revenue |
|---|---|---|
| Healthcare | 3 | $91B |
|
||
| Retail | 3 | $72B |
|
||
| Transportation / Logistics | 1 | $88B |
|
||
| Paper / Packaging | 1 | $19B |
|
||
| Insurance | 1 | $13B |
|
||
| Energy | 1 | $12B |
|
||
Price history
2 events — show timeline
- 2026-04-23 Pending — TVRMLS
- 2026-03-24 Listed $10,000 TVRMLS
Property tax history
-5.9%/yrLatest (2025): $705 · -45.3% YoY. Source: county tax records.
Cash-flow waterfall
monthlySold comps — $/sqft
last 12 mo · ≤1 miLoading sold comps…