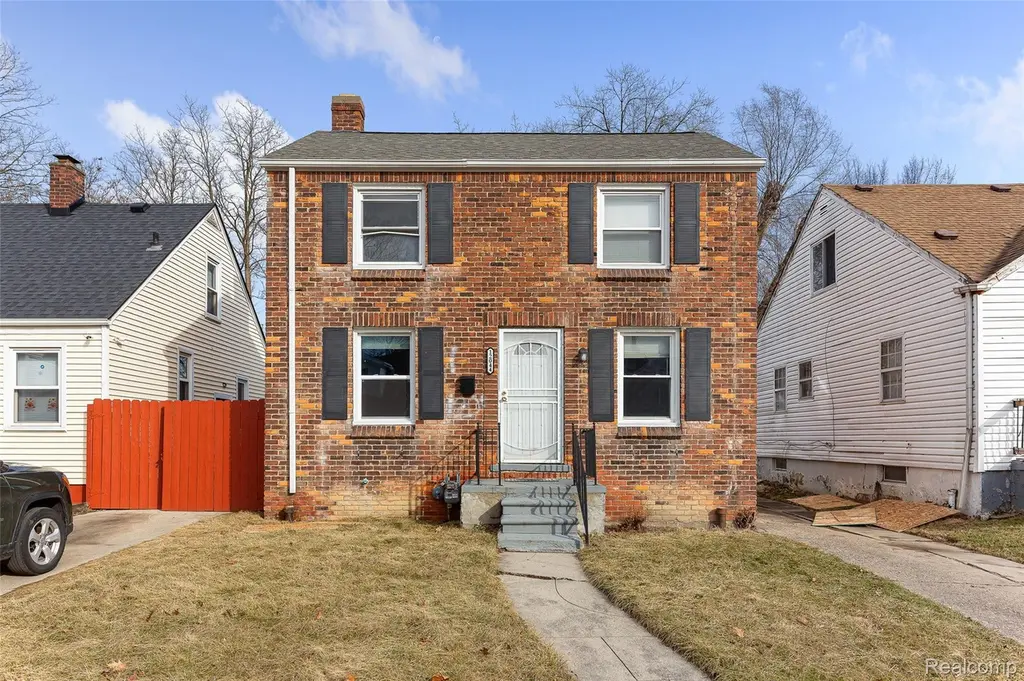
12044 Forrer St · Detroit, MI
Flood risk 6/10 · Moderate
- FEMA flood zone
- X (unshaded)
- Chance of flooding over 30 yrs
- 0.67%
- Est. flood insurance / yr
- $473 – $860
Fire risk 1/10 · Minimal
- Est. fire insurance / yr
- $784 – $1,456
Heat risk 2/10 · Minimal
- Hot days now (above 98°F)
- 7 days/yr
- Hot days in 30 yrs
- 14 days/yr
Wind risk 2/10 · Minimal
- Chance of severe wind over 30 yrs
- —
Air-quality risk 3/10 · Minor
- Unhealthy air days now
- 2 days/yr
- Unhealthy air days in 30 yrs
- 5 days/yr
Risk factors via First Street. Map © Google.
Why this score? — see what drove the C+ grade
The composite is a weighted blend of 9 inputs, each scored 0–100. Each bar is that input's sub-score; the figure is the points it added to the 100-point composite (weight × sub-score).
- Cash flow +30.0/30.0
- 1% rule +10.0/10.0
- DSCR +10.0/10.0
- Rent growth +3.9/5.0
- Livability +3.7/5.0
- Condition / age +2.5/5.0
- Schools +1.3/10.0
- ARV discount +0.0/15.0
- Appreciation +0.0/10.0
$79,000
🖨 Deal sheet (PDF) 📄 Offer letter ✓ Due diligence
Listing remarks MLS
LOOKING FOR A MOVE-IN READY COLONIAL ON THE WEST SIDE OF DETROIT? This is it! Located minutes from downtown Detroit. Whether it could be your opportunity to own this investment property of cash flow with average rents $1,200 or for a first-time homebuyer. You'll love the spacious main floor w/ large living room, dining room w/ several windows that let in TONS of natural sunlight to make a day at home feel blissful. Updated kitchen w/ lots of cabinets w/ counter space has plenty of space to add an entertainment area, game room, home gym, or pantry storage. Fully-fenced backyard perfect for creating your dream garden or ready for you to host family gatherings. New upgrades include: PEX plumbing, 100 amp electrical, new vinyl flooring, Furnace & HWT installed before closing. Great location minutes away from Downtown Detroit Midtown, I-96, M-39 providing easy access to numerous grocery stores & restaurants. Schedule your private showing today. No Seller Financing
Key facts
- New upgrades
- Investment property
- Updated kitchen
Tags
Property features AI
Exterior
- Parking: No garage
- Utilities: Public water; Public sewer; Cable available; Underground utilities
- Home design: Single-family residence; Two-story entry with ground-level entry and steps
- Construction: Block construction; Block foundation; Asphalt roof; Built area above grade: 960
- Exterior features: Paved road access; No pool
Interior
- Bathrooms: 1 full bathroom
- Heating & cooling: Forced air heating (natural gas); No central cooling
- Interior features: Unfinished basement; Total of 4 rooms
Neighborhood map
What this means for you Summary
Snapshot
- This is a 2-bed/1.0-bath single-family listed at $79k.
Deal economics
- At list price, monthly cash flow is $457 ($5k/yr) — positive.
- The deal already cash-flows at list — no discount required.
- Meets the 1% rule at list price ($1k rent vs $79k).
- Recommended offer: $78k (1.5% below list) — sets the bar for market timing.
- Cap rate 13.2% vs local median 10.0% in Detroit — top-decile yield for the area; either an underpriced asset or a hidden risk that comps aren't pricing in. Stress-test before assuming the spread holds.
Location & tenants
- Location reads 73/100 on livability (#218 in MI) — a middle-class / working-renter tenant base. Strengths: amenities A+, commute A+, cost of living A+; Watch: crime F, employment F.
- Detroit Public Schools Community District (urban): math 10% / reading 24% proficiency, ranked #499 of 540 in MI (top 92%) — low school quality limits family demand, transient renter base, plan for 1-2y turnover; 90% free/reduced lunch — lower-income household profile, screen leases tightly.
- Zoned schools: Henderson Academy (math 10% / reading 10%, grade F, #1,230 of 1,397 statewide, top 91%, 520 students, 91% FRL); Cody High School (math 24% / reading 24%, grade F, #481 of 713 statewide, top 81%, 466 students, 88% FRL) — zoned schools at 89% FRL track the district average.
- Market conditions: Rents rising fast (+5.6%/yr); 392 active listings in the ZIP; 40 comparable units currently listed for rent nearby; rentals at typical pace (median 26d on market — plan ~3-4 weeks tenant-placement turnaround); 40% of comp listings sitting > 30 days — soft ceiling on asking rent; lower-income renter base — watch delinquency; 2,639 units permitted in Wayne County in 2024 (1,216 in 5+ unit buildings).
Forward outlook
- Local home prices are declining (-3.0%/yr); year-one equity from $546 of loan paydown is wiped out by about $2k of value loss. Plan a longer hold.
- Wayne County population projected at -17% by 2050 — secular population decline; favor cash flow + early exit over multi-decade hold.
- At projected returns (-3.0% appreciation + 5.6% rent growth), your $22k cash investment doubles in ~5 years — after that, you're playing with house money.
Negotiation context
- It's been on market 20 days — a 2% lower offer ($78k) is reasonable based on typical stale-listing flexibility.
- 18 sale attempts since 21y ago with the ask held roughly flat each time — persistent listings suggest the price (not the market) is what's stuck; bring a comps-based counter.
- Current owner paid $63k; 25% above their basis — modest negotiation headroom, anchor on the comps not their cost.
Risks & watch-outs
- Watch-outs: built in 1940 — expect roof / HVAC / electrical / plumbing capex.
- Climate carrying-cost: major flood risk — expect insurance premiums to compound above CPI over the hold.
Questions for the listing agent
- Built in 1940 — when were the roof, HVAC, electrical panel, plumbing, and water heater last replaced?
- Is there a deadline driving the sale (1031 exchange, divorce, estate, relocation)? That informs how much negotiation room exists.
- Schools are F-rated, which usually means shorter tenancies and higher turnover. Who's the typical renter profile here, and what's been the actual vacancy rate?
- Crime grade is F in this area — have there been break-ins, vandalism, or insurance claims at this property in the last 3 years? What carrier currently insures it and at what premium?
- What's the average days-on-market for RENTAL listings here right now (not sales)? A rising rental-DOM trend means longer vacancies and softer asking-rent achievability than the comps imply.
- What's the recent tenant-quality profile in this submarket — average credit score on applications, eviction rate, late-payment / NSF rate, and stable-employment percentage? A property-management company in the area should have these aggregated.
- How much new for-sale + rental construction is in the pipeline within 1–3 miles? Heavy new supply typically softens prices + rents 12–24 months out; constrained supply supports both.
Investment metrics
- 1% rule
- 1.61% ✓
- Cap rate
- 13.24%
- Cash-on-cash
- 24.82%
- DSCR
- 2.10
- GRM
- 5.2
CMA / ARV
- ARV (median comp)
- $61,254
- List price
- $79,000
- Delta
- 28.97%
- Verdict
- OVERPRICED
- Comps
- 20 within 1.0 mi
Show comp detail 12 sales within ~0.75 mi
| Address | Dist | Beds/Ba | Sqft | Sold | Price | $/sf | Match |
|---|---|---|---|---|---|---|---|
| 12057 Forrer St | 0.03mi | 3/1.0 (+1) | 1,000 (+4%) | 1mo | $45,000 | $45 | 86 |
| 12124 Asbury Park | 0.32mi | 3/1.5 (+1) | 919 (-4%) | 2mo | $130,000 | $141 | 69 |
| 9580 Mansfield St | 0.62mi | 2/1.0 | 890 (-7%) | 0mo | $23,000 | $26 | 59 |
| 11669 Strathmoor St | 0.73mi | 3/1.0 (+1) | 974 (+2%) | 2mo | $30,000 | $31 | 57 |
| 12660 Grandmont Ave | 0.58mi | 3/1.0 (+1) | 1,019 (+6%) | 1mo | $85,000 | $83 | 57 |
| 12203 Grandmont Ave | 0.47mi | 3/1.5 (+1) | 861 (-10%) | 1mo | $95,000 | $110 | 53 |
| 12699 Woodmont Ave | 0.58mi | 3/1.0 (+1) | 1,054 (+10%) | 1mo | $64,000 | $61 | 51 |
| 11375 Grandmont Ave | 0.54mi | 3/1.0 (+1) | 1,083 (+13%) | 1mo | $104,000 | $96 | 48 |
| 9930 Whitcomb St | 0.57mi | 3/1.0 (+1) | 1,078 (+12%) | 2mo | $35,000 | $32 | 46 |
| 9599 Whitcomb St | 0.65mi | 3/1.0 (+1) | 1,060 (+10%) | 1mo | $55,000 | $52 | 46 |
| 9909 Asbury Park | 0.61mi | 3/1.0 (+1) | 1,095 (+14%) | 1mo | $95,000 | $87 | 42 |
| 12690 Asbury Park | 0.51mi | 3/2.0 (+1) | 826 (-14%) | 2mo | $85,000 | $103 | 42 |
Match score weights: distance 35% · size 25% · config 20% · recency 20%. Top-matched comps best support the ARV.
Projected returns pro-forma
-3.0% appreciation · 5.59% rent growth · sell at horizon
- IRR
- 21.2%
- Equity multiple
- 1.89×
- Total profit
- $19,767
- Equity at exit
- $11,779
- IRR
- 31.0%
- Equity multiple
- 4.15×
- Total profit
- $69,578
- Equity at exit
- $6,830
Cash invested: $22,120 (down + closing). Projections, not guarantees.
Landlord ↔ Tenant lean methodology
- Overall (STATE)
- 62 Landlord-Friendly
- State Michigan
- 62 Landlord-Friendly · EVEN
- County
- — inherits STATE
- City
- — inherits STATE
ZIP-level market 48227
- Rents YoY
- 5.6%
- Active inventory
- 392
- Price-to-rent
- 5.2×
Monthly cashflow live
- Estimated rent
- $1,276 high interval (Pro) →
- Mortgage (P&I)
- −$414
- Tax from tax record
- −$103 /mo · $1,238/yr
- Insurance
- −$33
- HOA
- −$0
- Vacancy / Maint / Mgmt
- −$268
- Net cashflow
- $457
Break-even live
Sensitivity live
| Price | -10% $502 | -5% $480 | +0% $457 | +5% $435 | +10% $413 |
|---|---|---|---|---|---|
| Rent | -10% $357 | -5% $407 | +0% $457 | +5% $508 | +10% $558 |
| Rate | -1.0pp $497 | -0.5pp $478 | base $457 | +0.5pp $437 | +1.0pp $416 |
UW: 25.0% down · 7.5% · 30yr · 1.5% tax · 5.0% vac · 8.0% maint · 8.0% mgmt
Financing live
Cash to close
- Down payment
- $19,750
- Closing costs
- $2,370
- Reserves months
- —
- Total cash needed
- —
Loan-product check · same deal, 3 products live
Conventional
25% down · 7.5% · 30yr
- Down + closing
- —
- Monthly P&I
- —
- Monthly cashflow
- —
- DSCR
- —
- Eligible?
- —
Personal DTI + credit; lowest rate.
DSCR
20% down · 8.5% · 30yr
- Down + closing
- —
- Monthly P&I
- —
- Monthly cashflow
- —
- DSCR
- —
- Eligible?
- —
No personal income docs; deal must DSCR.
Hard money
10% down · 12.0% · 12mo
- Down + closing
- —
- Monthly P&I
- —
- Monthly cashflow
- —
- DSCR
- —
- Eligible?
- —
Short-term bridge; refi at stabilization.
Rent comps 40 comps
| Address | Beds | Baths | Sqft | Rent | $/sqft | DOM | Units | Dist |
|---|---|---|---|---|---|---|---|---|
| 12121 Montrose St Detroit, MI | 3.0 | 1.0 | 874 | $1,373 | $1.57 | 23d | 1 | 0.10mi |
| 11393 Prest St Detroit, MI | 3.0 | 1.0 | 900 | $1,550 | $1.72 | 18d | 1 | 0.32mi |
| 11345 Greenfield Rd Detroit, MI | 2.0 | 1.0 | 700 | $1,050 | $1.50 | 14d | 1 | 0.33mi |
| 11397 Whitcomb St Detroit, MI | 3.0 | 1.0 | 1070 | $1,400 | $1.31 | 18d | 1 | 0.36mi |
| 11634 Sussex St Detroit, MI | 3.0 | 1.0 | 1091 | $1,326 | $1.22 | 26d | 1 | 0.38mi |
| 9973 Winthrop St Detroit, MI | 3.0 | 1.0 | 960 | $1,400 | $1.46 | 45d | 1 | 0.43mi |
| 9936 Montrose St Detroit, MI | 3.0 | 1.0 | 963 | $1,200 | $1.25 | 18d | 1 | 0.46mi |
| 12039 Lauder St Detroit, MI | 3.0 | 1.5 | 1000 | $1,500 | $1.50 | 26d | 1 | 0.55mi |
| 9917 Sussex St Detroit, MI | 2.0 | 1.0 | 800 | $1,375 | $1.72 | 45d | 1 | 0.58mi |
| 10015 Robson St Detroit, MI | 3.0 | 2.0 | 1000 | $1,400 | $1.40 | 19d | 1 | 0.58mi |
| 9601 Greenfield Rd Detroit, MI | 1.0 | 1.0 | 500 | $725 | $1.45 | 45d | 1 | 0.58mi |
| 12711 Grandmont Ave Detroit, MI | 3.0 | 1.0 | 1000 | $1,400 | $1.40 | 19d | 1 | 0.65mi |
| 12840 Grandmont Ave Detroit, MI | 3.0 | 1.0 | 1100 | $1,200 | $1.09 | 45d | 1 | 0.70mi |
| 12611 Memorial St Unit 629203 Detroit, MI | 1.0 | 1.0 | 635 | $995 | $1.57 | 26d | 1 | 0.71mi |
| 12611 Memorial St Unit 629104 Detroit, MI | 1.0 | 1.0 | 700 | $995 | $1.42 | 45d | 1 | 0.71mi |
| 9546 Sussex St Detroit, MI | 3.0 | 1.0 | 1000 | $1,400 | $1.40 | 45d | 1 | 0.71mi |
| 9345 Rutherford St Unit 3 Detroit, MI | 2.0 | 1.0 | 850 | $1,050 | $1.24 | 26d | 1 | 0.75mi |
| 12754 Marlowe St Detroit, MI | 3.0 | 2.0 | 1008 | $1,400 | $1.39 | 18d | 1 | 0.79mi |
| 9222 Forrer St Detroit, MI | 3.0 | 1.0 | 947 | $1,450 | $1.53 | 18d | 1 | 0.82mi |
| 9386 Coyle St Detroit, MI | 3.0 | 1.0 | 1000 | $1,300 | $1.30 | 3d | 1 | 0.84mi |
| 9590 Marlowe St Detroit, MI | 2.0 | 1.0 | 877 | $1,430 | $1.63 | 45d | 1 | 0.85mi |
| 14740 W Chicago Unit B Detroit, MI | 2.0 | 1.0 | 900 | $845 | $0.94 | 45d | 1 | 0.87mi |
| 11741 Penrod St Detroit, MI | 3.0 | 1.0 | 1124 | $1,400 | $1.25 | 18d | 1 | 1.01mi |
| 13331 Strathmoor St Detroit, MI | 3.0 | 1.0 | 1084 | $1,100 | $1.01 | 18d | 1 | 1.02mi |
| 13600 Southfield Fwy Detroit, MI | 2.0 | 1.0 | 848 | $1,100 | $1.30 | 6d | 1 | 1.11mi |
| 12944 Rosemont Ave Detroit, MI | 2.0 | 1.0 | 800 | $1,050 | $1.31 | 6d | 1 | 1.13mi |
| 13717 Keal St Detroit, MI | 2.0 | 1.0 | 799 | $1,000 | $1.25 | 45d | 1 | 1.16mi |
| 9108 Archdale St Detroit, MI | 3.0 | 1.0 | 1000 | $1,300 | $1.30 | 6d | 1 | 1.19mi |
| 12941 Penrod St Detroit, MI | 2.0 | 1.0 | 1000 | $1,275 | $1.27 | 45d | 1 | 1.21mi |
| 14264 Coyle St Detroit, MI | 2.0 | 1.0 | 1000 | $1,150 | $1.15 | 45d | 1 | 1.22mi |
| 12875 Faust Ave Detroit, MI | 2.0 | 1.0 | 735 | $1,200 | $1.63 | 6d | 1 | 1.23mi |
| 18450 W Chicago Detroit, MI | 1.0–2.0 | 1.0 | 687 | $1,117 | $1.62 | 0d | 15 | 1.24mi |
| 8604 Whitcomb St Detroit, MI | 3.0 | 2.0 | 1033 | $1,300 | $1.26 | 45d | 1 | 1.26mi |
| 13310 Plymouth Rd Unit 1 Detroit, MI | 1.0 | 1.0 | 650 | $645 | $0.99 | 45d | 1 | 1.28mi |
| 13310 Plymouth Rd Unit 05 Detroit, MI | 1.0 | 1.0 | 650 | $595 | $0.92 | 45d | 1 | 1.28mi |
| 13591 Faust Ave Detroit, MI | 2.0 | 1.0 | 1000 | $1,275 | $1.27 | 45d | 1 | 1.32mi |
| 12950 Glastonbury Ave Detroit, MI | 3.0 | 1.0 | 1000 | $1,400 | $1.40 | 26d | 1 | 1.35mi |
| 14535 Mettetal St Unit 1 Detroit, MI | 2.0 | 1.0 | 965 | $1,000 | $1.04 | 45d | 1 | 1.40mi |
| 13514 Stahelin Ave Detroit, MI | 3.0 | 1.0 | 1000 | $1,400 | $1.40 | 19d | 1 | 1.42mi |
| 8850 Rosemont Ave Detroit, MI | 3.0 | 1.0 | 933 | $1,100 | $1.18 | 19d | 1 | 1.44mi |
Listing history 50 events
-
2026-06-21days on market $79,000 Active 20 DOM
-
2026-06-18days on market $79,000 Active 17 DOM
-
2026-06-17days on market $79,000 Active 16 DOM
-
2026-06-15days on market $79,000 Active 14 DOM
-
2026-06-13days on market $79,000 Active 12 DOM
-
2026-06-13days on market $79,000 Active 11 DOM
-
2026-06-09days on market $79,000 Active 8 DOM
-
2026-06-08days on market $79,000 Active 7 DOM
-
2026-06-07days on market $79,000 Active 6 DOM
-
2026-06-04days on market $79,000 Active 3 DOM
-
2026-06-03days on market $79,000 Active 2 DOM
-
2026-06-02days on market $79,000 Active 1 DOM
-
2026-04-05historical $1,200
-
2026-02-28$79,000 Active 959-char remark
-
2026-02-28$79,000 Active 965-char remark
-
2026-02-16historical
-
2026-02-16historical
-
2025-12-15$79,000 Active
-
2025-12-15$79,000 Active
-
2025-12-13historical
-
2025-12-13historical
-
2025-12-06$1,200
-
2025-12-06historical $1,200
-
2025-12-05$1,200
-
2025-11-26historical $1,200
-
2025-09-19price $79,000
-
2025-09-18price $79,000
-
2025-09-12$89,000 Active
-
2025-09-12$89,000 Active
-
2025-09-10historical
-
2025-09-10historical
-
2025-06-26$1,200
-
2025-06-26historical $1,200
-
2025-06-26$1,200
-
2025-06-17$89,900 Active
-
2025-06-17$89,900 Active
-
2025-06-11historical
-
2025-06-07historical
-
2025-06-07historical
-
2025-05-12price $94,000
-
2025-05-12price $94,000
-
2025-04-22status Active
-
2025-04-21historical
-
2025-03-09$99,000 Active
-
2025-03-09$99,000 Active
-
2025-03-06historical
-
2023-01-31soldstatus $63,000
-
2023-01-31soldstatus $85,000
-
2006-12-19soldstatus $70,000
-
2006-01-05soldstatus $32,000
ⓘ Source: listings_history table (triggers on properties + properties_extension) + one-shot
backfill from property_details.listing_events for pre-trigger history.
Tax reassessment forecast MI · Partial reset (capped growth)
- Current annual tax
- $1,238 · $103/mo
- Projected year-2 tax
- $1,238 · $103/mo
- Expected delta
- $0/yr ($0/mo · 0.0%)
ⓘ Screening estimate from a state-policy table — verify with the county assessor before closing.
Climate risk First Street
- Flood 6/10 Major FEMA zone X (unshaded) · 67% chance over 30 yrs
- Wildfire 1/10 Low
- Heat 2/10 Low 7 d/yr ≥98°F today · 14 d/yr by 30 yrs out
- Wind 2/10 Low
- Air quality 3/10 Moderate 2 unhealthy d/yr today · 5 by 30 yrs out
Nearby sold comps map
Loading sold comps map…
Walkable amenities ~0.75 mi
Loading nearby amenities…
Taxation est. · year 1
- Rental income
- $15,309
- − Mortgage interest
- −$4,425
- − Property taxes
- −$1,238
- − Insurance
- −$395
- − Repairs & maintenance
- −$1,225
- − Management
- −$1,225
- − Depreciation
- −$2,298
- Taxable income
- $4,503
- Est. tax owed @ 24.0%
- −$1,081
- After-tax cash flow
- $4,409/yr
For passive investors: Depreciation is non-cash, so a rental often shows a tax loss while cash-flowing — sheltering income. Rental losses are passive: they offset passive income freely, and up to $25,000/yr can offset ordinary (W-2) income if you actively participate and your MAGI is under $100k (phasing out to $0 by $150k); unused losses carry forward. On sale, claimed depreciation is recaptured at up to 25%, and gains may owe capital-gains tax (a 1031 exchange can defer both). Figures are a year-1 estimate at your 24.0% rate — not tax advice; consult a CPA.
Schools (NCES district)
- District
- Detroit Public Schools Community District
- NCES district ID
- 2601103
- Math proficiency
- 10% ▼ -2.00%
- Reading proficiency
- 24% ▲ 6.00%
- Median HH income
- $25,815
- Composite
- 13.06/100
- National rank
- #9564
- State rank
- #499 of 540 in MI
Livability — Detroit
- Score
- 73/100
- State rank
- #218
- US rank
- #5427
Category grades
Schools grade is shown separately in the Schools card above.
Census & demographics
- Census place
- Detroit, MI
- County
- Wayne County · 1,562,939 people
- City population
- 572,865
- Metro
- Detroit-Warren-Dearborn, MI
- Population (ZIP)
- 40,302
- Household income
- $36,527
- Rent vs Own
- Severe rent burden
- 2371.0
Population outlook (Wayne County) Hauer SSP2
- Today (2025)
- 1,675,273 people
- By 2030
- 1,620,300 · -3.3%
- By 2040
- 1,502,341 · -10.3%
- By 2050
- 1,384,039 · -17.4%
- By 2075
- 1,124,592 · -32.9%
- By 2100
- 881,193 · -47.4%
Race, ethnicity, and origin ACS 2023
- Neighborhood character
- Predominantly Black (95%)
- Race & ethnicity
- Black 95% Two or more races 3% White 1%
- Foreign-born
- 1%
- Languages at home
- 98% English-only · Spanish 1% French/Haitian/Cajun 1%
Political lean MEDSL · Wayne
- 2024 margin
- Strong D (+29.0) · D 62.7% · R 33.7% · Other 3.6%
- 2008→2024 swing
- -20.5pp toward R · 2008: 49.5pp · 2024: 29.0pp
- All cycles
- 2024: D+29.0 2020: D+38.1 2016: D+37.3 2012: D+46.9 2008: D+49.5
Not yet ingested
- Civics
- —
Market trends
- HPI YoY
- ▼ -125.00%
- Current HPI
- 186.4158
- Rent YoY
- ▲ 5.59%
- Metro
- Detroit-Warren-Dearborn, MI
- State GDP YoY
- ▲ 1.37%
- F500 in state
- 28
Industry mix (Fortune 500 HQ in MI)
| Industry | F500 HQs | Revenue |
|---|---|---|
| Automotive Parts | 3 | $48B |
|
||
| Automotive | 2 | $372B |
|
||
| Chemicals | 1 | $45B |
|
||
| Automotive Retail | 1 | $29B |
|
||
| Healthcare / Medical Devices | 1 | $23B |
|
||
| Automotive Technology | 1 | $20B |
|
||
Price history
+125.7% since first listed43 events — show timeline
- 2026-06-01 Listed $79,000 REALCOMP
- 2026-06-01 Listed $79,000 MiRealSource-MiMLS
- 2026-05-29 Listing Removed — REALCOMP
- 2026-05-29 Listing Removed — MiRealSource-MiMLS
- 2026-04-05 Rental Removed $1,200 REALCOMP
- 2026-02-28 Listed $79,000 REALCOMP
- 2026-02-28 Listed $79,000 MiRealSource-MiMLS
- 2026-02-16 Listing Removed — REALCOMP
- 2026-02-16 Listing Removed — MiRealSource-MiMLS
- 2025-12-15 Listed $79,000 REALCOMP
- 2025-12-15 Listed $79,000 MiRealSource-MiMLS
- 2025-12-13 Listing Removed — MiRealSource-MiMLS
- 2025-12-13 Listing Removed — REALCOMP
- 2025-12-06 Listed for Rent $1,200 REALCOMP
- 2025-12-06 Rental Removed $1,200 REALSOURCE
- 2025-12-05 Listed for Rent $1,200 REALSOURCE
- 2025-11-26 Rental Removed $1,200 REALSOURCE
- 2025-09-19 Price Changed $79,000 MiRealSource-MiMLS
- 2025-09-18 Price Changed $79,000 REALCOMP
- 2025-09-12 Listed $89,000 REALCOMP
- 2025-09-12 Listed $89,000 MiRealSource-MiMLS
- 2025-09-10 Listing Removed — REALCOMP
- 2025-09-10 Listing Removed — MiRealSource-MiMLS
- 2025-06-26 Listed for Rent $1,200 REALSOURCE
- 2025-06-26 Rental Removed $1,200 REALCOMP
- 2025-06-26 Listed for Rent $1,200 REALCOMP
- 2025-06-17 Listed $89,900 MiRealSource-MiMLS
- 2025-06-17 Listed $89,900 REALCOMP
- 2025-06-11 Coming Soon — MiRealSource-MiMLS
- 2025-06-07 Listing Removed — MiRealSource-MiMLS
- 2025-06-07 Listing Removed — REALCOMP
- 2025-05-12 Price Changed $94,000 MiRealSource-MiMLS
- 2025-05-12 Price Changed $94,000 REALCOMP
- 2025-04-22 Relisted — REALCOMP
- 2025-04-21 Listing Removed — REALCOMP
- 2025-03-09 Listed $99,000 MiRealSource-MiMLS
- 2025-03-09 Listed $99,000 REALCOMP
- 2025-03-06 Coming Soon — MiRealSource-MiMLS
- 2023-01-31 Sold (Public Records) $85,000 Public Records
- 2023-01-31 Sold (Public Records) $63,000 Public Records
- 2006-12-19 Sold (Public Records) $70,000 Public Records
- 2006-01-05 Sold (MLS) $32,000 REALCOMP
- 2005-06-06 Listed $35,000 REALCOMP
Property tax history
+16.1%/yrLatest (2025): $1,238 · -30.8% YoY. Source: county tax records.
Cash-flow waterfall
monthlySold comps — $/sqft
last 12 mo · ≤1 miLoading sold comps…