7637 North St · Seligman, MO
Flood risk No data
- FEMA flood zone
- —
- Chance of flooding over 30 yrs
- —
- Est. flood insurance / yr
- —
Fire risk No data
- Est. fire insurance / yr
- —
Heat risk No data
- Hot days now (above threshold)
- —
- Hot days in 30 yrs
- —
Wind risk No data
- Chance of severe wind over 30 yrs
- —
Air-quality risk No data
- Unhealthy air days now
- —
- Unhealthy air days in 30 yrs
- —
Risk factors via First Street. Map © Google.
Why this score? — see what drove the D- grade
The composite is a weighted blend of 9 inputs, each scored 0–100. Each bar is that input's sub-score; the figure is the points it added to the 100-point composite (weight × sub-score).
- Appreciation +8.2/10.0
- Cash flow +7.5/30.0
- ARV discount +7.5/15.0
- Livability +3.2/5.0
- Rent growth +2.5/5.0
- Condition / age +2.5/5.0
- 1% rule +2.2/10.0
- Schools +2.1/10.0
- DSCR +1.7/10.0
$200,000
🖨 Deal sheet (PDF) 📄 Offer letter ✓ Due diligence
Listing remarks MLS
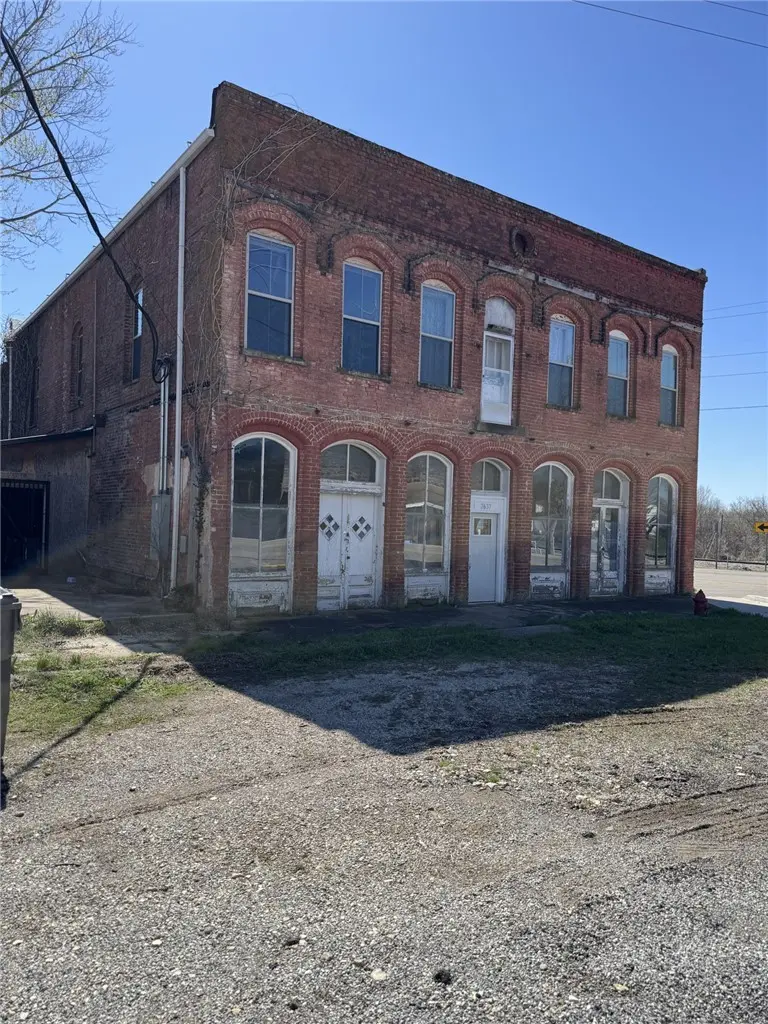
Amazing Opportunity! This historic building is ready for someone to finish it out. 2 loft suites are done with another 2 that need to be finished out in the upper floor. Main floor could be finished out into 3 different businesses. All new AC units, all new plumbing and electric thru out. With ome imagination this building could be a GEM! Rental income available while you finish the other 2 out. Main floor has lots of potential. The owner was designing it to be 3 separate businesses on the lower level. All city utilities. Would be a great hotel, retail, or restaurant. Less than 15 minutes to Roaring river, Beaver Lake, Mark Twain Forest. Rogers/Bentonville 1/2 hour. Come and see this and envision the possibilities! Also listed as commercial MLS 1340463
Key facts
- City utilities
- New plumbing
- Historic building
Tags
Neighborhood map
What this means for you Summary
Snapshot
- This is a 4-bed/2.0-bath single-family listed at $200k.
Deal economics
- At list price, monthly cash flow is $-245 ($-3k/yr) — negative.
- To cash-flow at today's rent, offer at most $165k (17.7% below list).
- To meet the 1% rule (rent ≥ 1% of price), the offer needs to be $144k (28.0% below list).
- Recommended offer: $144k (28.0% below list) — sets the bar for 1% rule.
Location & tenants
- Location reads 65/100 on livability (#274 in MO) — a middle-class / working-renter tenant base. Strengths: crime A+, cost of living A+, housing A+; Watch: amenities F, commute F, employment F.
- Southwest R-V (rural): math 19% / reading 32% proficiency, ranked #288 of 324 in MO (top 89%) — low school quality limits family demand, transient renter base, plan for 1-2y turnover.
- Zoned schools: Southwest Elem. (math 22% / reading 27%, grade F, #879 of 1,115 statewide, top 81%, 347 students, 64% FRL); Southwest Middle (math 18% / reading 28%, grade F, #330 of 391 statewide, top 84%, 219 students, 61% FRL); Southwest High (math 17% / reading 54%, grade F, #314 of 521 statewide, top 61%, 262 students, 56% FRL).
- Market conditions: 36 active listings in the ZIP; 57 units permitted in Barry County in 2024 (0 in 5+ unit buildings).
Forward outlook
- In year one you build about $14k of equity ($1k loan paydown + $13k appreciation (6.5% local appreciation)).
- Barry County population projected at -13% by 2050 — secular population decline; favor cash flow + early exit over multi-decade hold.
- By year 3, paydown + projected appreciation supports a ~$36k cash-out refi (75% LTV) — recoverable capital for the next deal without selling this one.
Negotiation context
- It's been on market 65 days — a 6% lower offer ($188k) is reasonable based on typical stale-listing flexibility.
- 2 sale attempts with the ask held roughly flat each time — persistent listings suggest the price (not the market) is what's stuck; bring a comps-based counter.
Risks & watch-outs
- Watch-outs: built in 1882 — expect roof / HVAC / electrical / plumbing capex.
Questions for the listing agent
- What do current leases actually rent for vs. the listed asking? Can we see a recent rent roll and the last 12 months of T-12 income?
- It's been on market 65 days. Have you received any prior offers? Is the seller open to a 28% concession, seller financing, or rate buy-down credit?
- Built in 1882 — when were the roof, HVAC, electrical panel, plumbing, and water heater last replaced?
- Why hasn't it sold? Are there any deal-killer items the seller is aware of (foundation, flood, title, zoning, code violations)?
- Is there a deadline driving the sale (1031 exchange, divorce, estate, relocation)? That informs how much negotiation room exists.
- Schools are F-rated, which usually means shorter tenancies and higher turnover. Who's the typical renter profile here, and what's been the actual vacancy rate?
- The area grade is low — what's the realistic commute time and amenity access for the typical tenant pool here? Any planned neighborhood developments (good or bad) we should know about?
- What's the average days-on-market for RENTAL listings here right now (not sales)? A rising rental-DOM trend means longer vacancies and softer asking-rent achievability than the comps imply.
- What's the recent tenant-quality profile in this submarket — average credit score on applications, eviction rate, late-payment / NSF rate, and stable-employment percentage? A property-management company in the area should have these aggregated.
- How much new for-sale + rental construction is in the pipeline within 1–3 miles? Heavy new supply typically softens prices + rents 12–24 months out; constrained supply supports both.
Investment metrics
- 1% rule
- 0.72% ✗
- Cap rate
- 4.82%
- Cash-on-cash
- -5.25%
- DSCR
- 0.77
- GRM
- 11.6
CMA / ARV
- ARV (median comp)
- $758,359
- List price
- $200,000
- Delta
- -73.63%
- Verdict
- UNDERPRICED
- Comps
- 1 within 2.0 mi
Projected returns pro-forma
6.47% appreciation · 3.0% rent growth · sell at horizon
- IRR
- 12.3%
- Equity multiple
- 1.85×
- Total profit
- $47,813
- Equity at exit
- $131,736
- IRR
- 13.0%
- Equity multiple
- 3.71×
- Total profit
- $151,565
- Equity at exit
- $244,263
Cash invested: $56,000 (down + closing). Projections, not guarantees.
Landlord ↔ Tenant lean methodology
- Overall (STATE)
- 81 Strongly Landlord-Friendly
- State Missouri
- 81 Strongly Landlord-Friendly · R+10
- County
- — inherits STATE
- City
- — inherits STATE
ZIP-level market 65745
- Home prices YoY
- 2.9%
- Active inventory
- 36
- Price-to-rent
- 11.6×
Monthly cashflow live
- Estimated rent
- $1,440 medium interval (Pro) →
- Mortgage (P&I)
- −$1,049
- Tax est. 1.5%
- −$250 /mo · $3,000/yr
- Insurance
- −$83
- HOA
- −$0
- Vacancy / Maint / Mgmt
- −$302
- Net cashflow
- $-245
Break-even live
Sensitivity live
| Price | -10% $-107 | -5% $-176 | +0% $-245 | +5% $-314 | +10% $-383 |
|---|---|---|---|---|---|
| Rent | -10% $-359 | -5% $-302 | +0% $-245 | +5% $-188 | +10% $-131 |
| Rate | -1.0pp $-144 | -0.5pp $-194 | base $-245 | +0.5pp $-297 | +1.0pp $-349 |
UW: 25.0% down · 7.5% · 30yr · 1.5% tax · 5.0% vac · 8.0% maint · 8.0% mgmt
Financing live
Cash to close
- Down payment
- $50,000
- Closing costs
- $6,000
- Reserves months
- —
- Total cash needed
- —
Loan-product check · same deal, 3 products live
Conventional
25% down · 7.5% · 30yr
- Down + closing
- —
- Monthly P&I
- —
- Monthly cashflow
- —
- DSCR
- —
- Eligible?
- —
Personal DTI + credit; lowest rate.
DSCR
20% down · 8.5% · 30yr
- Down + closing
- —
- Monthly P&I
- —
- Monthly cashflow
- —
- DSCR
- —
- Eligible?
- —
No personal income docs; deal must DSCR.
Hard money
10% down · 12.0% · 12mo
- Down + closing
- —
- Monthly P&I
- —
- Monthly cashflow
- —
- DSCR
- —
- Eligible?
- —
Short-term bridge; refi at stabilization.
Listing history 18 events
-
2026-06-21days on market $200,000 Active 65 DOM
-
2026-06-18days on market $200,000 Active 62 DOM
-
2026-06-17days on market $200,000 Active 61 DOM
-
2026-06-16days on market $200,000 Active 60 DOM
-
2026-06-15days on market $200,000 Active 59 DOM
-
2026-06-14days on market $200,000 Active 57 DOM
-
2026-06-13days on market $200,000 Active 56 DOM
-
2026-06-10days on market $200,000 Active 54 DOM
-
2026-06-09days on market $200,000 Active 53 DOM
-
2026-06-08days on market $200,000 Active 52 DOM
-
2026-06-07days on market $200,000 Active 51 DOM
-
2026-06-03days on market $200,000 Active 47 DOM
-
2026-06-02days on market $200,000 Active 46 DOM
-
2026-06-01days on market $200,000 Active 45 DOM
-
2026-05-31days on market $200,000 Active 44 DOM
-
2026-05-31days on market $200,000 Active 43 DOM
-
2026-04-17$200,000 Active 762-char remark
Show marketing remark (768 chars)
Amazing Opportunity! This historic building is ready for someone to finish it out. 2 loft suites are done with another 2 that need to be finished out in the upper floor. Main floor could be finished out into 3 different businesses. All new AC units, all new plumbing and electric thru out. With some imagination this building could be a GEM! Rental income available while you finish the other 2 out. Main floor has lots of potential. The owner was designing it to be 3 separate businesses on the lower level. All city utilities. Would be a great hotel, retail, or restaurant. Less than 15 minutes to Roaring river, Beaver Lake, Mark Twain Forest. Rogers/Bentonville 1/2 hour. Come and see this and envision the possibilities! Also listed as commercial. MLS #60318973
-
2026-04-17$200,000 Active 768-char remark
Show marketing remark (768 chars)
Amazing Opportunity! This historic building is ready for someone to finish it out. 2 loft suites are done with another 2 that need to be finished out in the upper floor. Main floor could be finished out into 3 different businesses. All new AC units, all new plumbing and electric thru out. With some imagination this building could be a GEM! Rental income available while you finish the other 2 out. Main floor has lots of potential. The owner was designing it to be 3 separate businesses on the lower level. All city utilities. Would be a great hotel, retail, or restaurant. Less than 15 minutes to Roaring river, Beaver Lake, Mark Twain Forest. Rogers/Bentonville 1/2 hour. Come and see this and envision the possibilities! Also listed as commercial. MLS #60318973
ⓘ Source: listings_history table (triggers on properties + properties_extension) + one-shot
backfill from property_details.listing_events for pre-trigger history.
Nearby sold comps map
Loading sold comps map…
Walkable amenities ~0.75 mi
Loading nearby amenities…
Taxation est. · year 1
- Rental income
- $17,274
- − Mortgage interest
- −$11,203
- − Property taxes
- −$3,000
- − Insurance
- −$1,000
- − Repairs & maintenance
- −$1,382
- − Management
- −$1,382
- − Depreciation
- −$5,818
- Taxable loss
- −$6,511
- Est. tax savings @ 24.0%
- +$1,563
- After-tax cash flow
- $-1,377/yr
For passive investors: Depreciation is non-cash, so a rental often shows a tax loss while cash-flowing — sheltering income. Rental losses are passive: they offset passive income freely, and up to $25,000/yr can offset ordinary (W-2) income if you actively participate and your MAGI is under $100k (phasing out to $0 by $150k); unused losses carry forward. On sale, claimed depreciation is recaptured at up to 25%, and gains may owe capital-gains tax (a 1031 exchange can defer both). Figures are a year-1 estimate at your 24.0% rate — not tax advice; consult a CPA.
Schools (NCES district)
- District
- Southwest R-V
- NCES district ID
- 2928710
- Math proficiency
- 19% ▼ -4.00%
- Reading proficiency
- 32% ▼ -3.00%
- Median HH income
- $35,609
- Composite
- 21.05/100
- National rank
- #8449
- State rank
- #288 of 324 in MO
Livability — Seligman
- Score
- 65/100
- State rank
- #274
- US rank
- #12859
Category grades
Schools grade is shown separately in the Schools card above.
Census & demographics
- Census place
- Seligman, MO
- Population (ZIP)
- 3,230
Population outlook (Barry County) Hauer SSP2
- Today (2025)
- 35,207 people
- By 2030
- 34,460 · -2.1%
- By 2040
- 32,643 · -7.3%
- By 2050
- 30,688 · -12.8%
- By 2075
- 26,898 · -23.6%
- By 2100
- 22,000 · -37.5%
Race, ethnicity, and origin ACS 2023
- Neighborhood character
- Predominantly White (89%)
- Race & ethnicity
- White 89% Two or more races 7% Hispanic / Latino 4% Native American 1%
- Common ancestry
- Romanian 4% Lithuanian 4% Slovak 3%
- Foreign-born
- 2% · Canada
- Languages at home
- 97% English-only · Spanish 2%
Political lean MEDSL · Barry
- 2024 margin
- Solid R (+63.5) · D 17.8% · R 81.3%
- 2008→2024 swing
- -28.5pp toward R · 2008: -35.0pp · 2024: -63.5pp
- All cycles
- 2024: R+63.5 2020: R+60.8 2016: R+59.7 2012: R+44.7 2008: R+35.0
Not yet ingested
- Civics
- —
Market trends
- HPI YoY
- ▲ 6.47%
- Current HPI
- 227.5875
- Rent YoY
- —
- Metro
- —
- State GDP YoY
- ▲ 1.84%
- F500 in state
- 20
Industry mix (Fortune 500 HQ in MO)
| Industry | F500 HQs | Revenue |
|---|---|---|
| Healthcare | 1 | $163B |
|
||
| Insurance | 1 | $21B |
|
||
| Industrial Technology | 1 | $17B |
|
||
| Retail | 1 | $16B |
|
||
| Industrial Distribution | 1 | $10B |
|
||
| Utilities | 1 | $9B |
|
||
Price history
+0.0% since first listed2 events — show timeline
- 2026-04-17 Listed $200,000 SOMO
- 2026-04-17 Listed $200,000 NWARMLS
Cash-flow waterfall
monthlySold comps — $/sqft
last 12 mo · ≤1 miLoading sold comps…