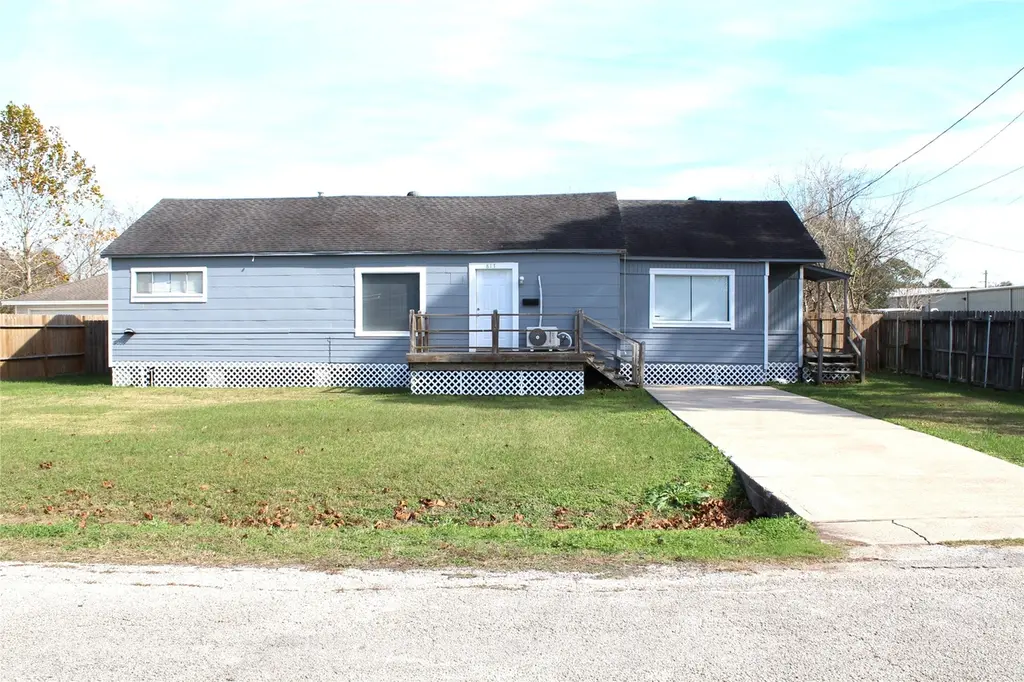
817 Hudler St · La Marque, TX
Flood risk 7/10 · Major
- FEMA flood zone
- X (shaded)
- Chance of flooding over 30 yrs
- 0.59%
- Est. flood insurance / yr
- $507 – $1,088
Fire risk 1/10 · Minimal
- Est. fire insurance / yr
- $1,222 – $2,270
Heat risk 10/10 · Severe
- Hot days now (above 109°F)
- 7 days/yr
- Hot days in 30 yrs
- 27 days/yr
Wind risk 10/10 · Severe
- Chance of severe wind over 30 yrs
- 99.0%
Air-quality risk 3/10 · Minor
- Unhealthy air days now
- 2 days/yr
- Unhealthy air days in 30 yrs
- 2 days/yr
Risk factors via First Street. Map © Google.
Why this score? — see what drove the D grade
The composite is a weighted blend of 9 inputs, each scored 0–100. Each bar is that input's sub-score; the figure is the points it added to the 100-point composite (weight × sub-score).
- Cash flow +15.3/30.0
- ARV discount +8.8/15.0
- 1% rule +4.7/10.0
- DSCR +4.7/10.0
- Rent growth +3.5/5.0
- Livability +3.0/5.0
- Condition / age +2.5/5.0
- Schools +2.4/10.0
- Appreciation +0.0/10.0
$159,999
🖨 Deal sheet (PDF) 📄 Offer letter ✓ Due diligence
Listing remarks MLS
Please come take a look at this inviting 2 bedroom 2 bath home with extra room that could be used as home office/study or anything you like in established neighborhood. No HOA. This home has a really nice, large and completely fenced in back yard. The home itself has a very large, open living area. The kitchen has a bar area that opens to the living room. The oversized primary bedroom has two closets. The home is located at the end of the street, so not a lot of through traffic. Presently, no back neighbors. Easy access to 1-45 and 146. A great opportunity to own a cute, clean and affordable home in a convenient location!
Key facts
- Two closets
- Open living area
- Bar area
Tags
Neighborhood map
What this means for you Summary
Snapshot
- This is a 2-bed/1.0-bath single-family listed at $160k.
Deal economics
- At list price, monthly cash flow is $-9 ($-108/yr) — negative.
- To cash-flow at today's rent, offer at most $158k (1.0% below list).
- To meet the 1% rule (rent ≥ 1% of price), the offer needs to be $155k (3.0% below list).
- Recommended offer: $141k (12.0% below list) — sets the bar for market timing.
- Cap rate 6.7% vs local median 5.6% in La Marque — meaningfully above typical; check what's discounted (condition, days-on-market, listing class) to confirm the premium yield is real.
Location & tenants
- Location reads 59/100 on livability (#1,136 in TX) — a working-class tenant base; expect higher turnover. Strengths: cost of living A+, housing A+; Watch: employment D, schools F, crime F.
- Texas City ISD (suburban): math 28% / reading 29% proficiency, ranked #655 of 826 in TX (top 79%) — low school quality limits family demand, transient renter base, plan for 1-2y turnover; 66% free/reduced lunch — lower-income household profile, screen leases tightly.
- Market conditions: Rents rising (+4.0%/yr); 661 active listings in the ZIP; 12 comparable units currently listed for rent nearby; rentals leasing fast (median 7d on market — plan ~1-2 weeks tenant-placement turnaround); 3,258 units permitted in Galveston County in 2024 (0 in 5+ unit buildings).
Forward outlook
- Local home prices are declining (-3.0%/yr); year-one equity from $1k of loan paydown is wiped out by about $5k of value loss. Plan a longer hold.
- Galveston County population projected at +43% by 2050 — long-run rental-demand tailwind backs the buy-and-hold thesis.
Negotiation context
- It's been on market 153 days — a 12% lower offer ($141k) is reasonable based on typical stale-listing flexibility.
- 11 sale attempts since 25y ago; this cycle's ask has dropped $15k (8%) from the opening price — seller is motivated, your offer sets the floor, not the list.
Risks & watch-outs
- Watch-outs: flood insurance adds $66/mo.
- Climate carrying-cost: major flood risk; severe wind risk, 99% chance of damaging wind over 30y; extreme-heat days projected 7→27/yr by 2055 (HVAC capex compounding) — expect insurance premiums to compound above CPI over the hold.
Questions for the listing agent
- What do current leases actually rent for vs. the listed asking? Can we see a recent rent roll and the last 12 months of T-12 income?
- It's been on market 153 days. Have you received any prior offers? Is the seller open to a 12% concession, seller financing, or rate buy-down credit?
- What's the actual annual flood-insurance premium (NFIP or private), and is the property in a SFHA with mandatory coverage?
- Why hasn't it sold? Are there any deal-killer items the seller is aware of (foundation, flood, title, zoning, code violations)?
- Is there a deadline driving the sale (1031 exchange, divorce, estate, relocation)? That informs how much negotiation room exists.
- Schools are F-rated, which usually means shorter tenancies and higher turnover. Who's the typical renter profile here, and what's been the actual vacancy rate?
- Crime grade is F in this area — have there been break-ins, vandalism, or insurance claims at this property in the last 3 years? What carrier currently insures it and at what premium?
- The area grade is low — what's the realistic commute time and amenity access for the typical tenant pool here? Any planned neighborhood developments (good or bad) we should know about?
- What's the average days-on-market for RENTAL listings here right now (not sales)? A rising rental-DOM trend means longer vacancies and softer asking-rent achievability than the comps imply.
- What's the recent tenant-quality profile in this submarket — average credit score on applications, eviction rate, late-payment / NSF rate, and stable-employment percentage? A property-management company in the area should have these aggregated.
- How much new for-sale + rental construction is in the pipeline within 1–3 miles? Heavy new supply typically softens prices + rents 12–24 months out; constrained supply supports both.
Investment metrics
- 1% rule
- 0.97% ✗
- Cap rate
- 6.72%
- Cash-on-cash
- 1.54%
- DSCR
- 1.07
- GRM
- 8.6
CMA / ARV
- ARV (median comp)
- $164,692
- List price
- $159,999
- Delta
- -2.85%
- Verdict
- FAIR
- Comps
- 20 within 1.0 mi
Show comp detail 12 sales within ~0.75 mi
| Address | Dist | Beds/Ba | Sqft | Sold | Price | $/sf | Match |
|---|---|---|---|---|---|---|---|
| 1708 Rosalee St | 0.31mi | 2/2.0 | 1,316 (-3%) | 1mo | $180,000 | $137 | 75 |
| 2301 Boss St | 0.28mi | 3/2.0 (+1) | 1,410 (+4%) | 1mo | $239,000 | $170 | 71 |
| 301 Albert St | 0.40mi | 2/2.0 | 1,316 (-3%) | 2mo | $64,997 | $49 | 70 |
| 1716 Rosalee St | 0.34mi | 3/2.0 (+1) | 1,420 (+4%) | 0mo | $110,000 | $77 | 68 |
| 1815 Thompson St | 0.33mi | 3/2.0 (+1) | 1,250 (-8%) | 1mo | $199,000 | $159 | 62 |
| 2709 Virginia St | 0.74mi | 2/2.0 | 1,365 (+0%) | 0mo | $183,500 | $134 | 61 |
| 1405 Austin St | 0.59mi | 3/2.0 (+1) | 1,389 (+2%) | 1mo | $235,000 | $169 | 59 |
| 1226 Sunset Ln | 0.31mi | 3/2.0 (+1) | 1,500 (+10%) | 3mo | $249,000 | $166 | 57 |
| 2008 Bellview St | 0.62mi | 3/2.0 (+1) | 1,410 (+4%) | 3mo | $239,900 | $170 | 53 |
| 2026 Rosalee St | 0.61mi | 3/2.0 (+1) | 1,270 (-7%) | 1mo | $189,000 | $149 | 51 |
| 504 Raymond St | 0.74mi | 3/2.0 (+1) | 1,313 (-4%) | 2mo | $120,000 | $91 | 49 |
| 2714 Rosadele St | 0.73mi | 3/2.0 (+1) | 1,456 (+7%) | 2mo | $199,000 | $137 | 43 |
Match score weights: distance 35% · size 25% · config 20% · recency 20%. Top-matched comps best support the ARV.
Projected returns pro-forma
-3.0% appreciation · 3.95% rent growth · sell at horizon
- IRR
- -15.4%
- Equity multiple
- 0.44×
- Total profit
- $-24,899
- Equity at exit
- $23,856
- IRR
- -5.1%
- Equity multiple
- 0.65×
- Total profit
- $-15,737
- Equity at exit
- $13,834
Cash invested: $44,800 (down + closing). Projections, not guarantees.
Landlord ↔ Tenant lean methodology
- Overall (STATE)
- 87 Strongly Landlord-Friendly
- State Texas
- 87 Strongly Landlord-Friendly · R+5
- County
- — inherits STATE
- City
- — inherits STATE
ZIP-level market 77568
- Home prices YoY
- -22.7%
- Rents YoY
- 4.0%
- Active inventory
- 661
- Price-to-rent
- 8.6×
Monthly cashflow live
- Estimated rent
- $1,552 high interval (Pro) →
- Mortgage (P&I)
- −$839
- Tax from tax record
- −$263 /mo · $3,156/yr
- Insurance
- −$67
- Flood insurance flood zone
- −$66 /mo · $798/yr
- HOA
- −$0
- Vacancy / Maint / Mgmt
- −$326
- Net cashflow
- $-9
Break-even live
Sensitivity live
| Price | -10% $82 | -5% $36 | +0% $-9 | +5% $-54 | +10% $-100 |
|---|---|---|---|---|---|
| Rent | -10% $-132 | -5% $-70 | +0% $-9 | +5% $52 | +10% $114 |
| Rate | -1.0pp $72 | -0.5pp $32 | base $-9 | +0.5pp $-50 | +1.0pp $-93 |
UW: 25.0% down · 7.5% · 30yr · 1.5% tax · 5.0% vac · 8.0% maint · 8.0% mgmt
Financing live
Cash to close
- Down payment
- $40,000
- Closing costs
- $4,800
- Reserves months
- —
- Total cash needed
- —
Loan-product check · same deal, 3 products live
Conventional
25% down · 7.5% · 30yr
- Down + closing
- —
- Monthly P&I
- —
- Monthly cashflow
- —
- DSCR
- —
- Eligible?
- —
Personal DTI + credit; lowest rate.
DSCR
20% down · 8.5% · 30yr
- Down + closing
- —
- Monthly P&I
- —
- Monthly cashflow
- —
- DSCR
- —
- Eligible?
- —
No personal income docs; deal must DSCR.
Hard money
10% down · 12.0% · 12mo
- Down + closing
- —
- Monthly P&I
- —
- Monthly cashflow
- —
- DSCR
- —
- Eligible?
- —
Short-term bridge; refi at stabilization.
Rent comps 12 comps
| Address | Beds | Baths | Sqft | Rent | $/sqft | DOM | Units | Dist |
|---|---|---|---|---|---|---|---|---|
| 1230 Kirsten St La Marque, TX | 3.0 | 2.0 | 1704 | $1,660 | $0.97 | 4d | 1 | 0.29mi |
| 203 Beatrice St La Marque, TX | 3.0 | 1.0 | 1304 | $1,395 | $1.07 | 26d | 1 | 0.51mi |
| 1013 Margot St La Marque, TX | 3.0 | 2.0 | 1099 | $1,500 | $1.36 | 20d | 1 | 0.53mi |
| 1825 Bayou Rd La Marque, TX | 2.0 | 1.0 | 1200 | $1,195 | $1.00 | 45d | 1 | 0.63mi |
| 309 S Bell Dr Texas City, TX | 2.0 | 2.0 | 1316 | $1,650 | $1.25 | 45d | 1 | 0.68mi |
| 1006 E Camp Cir La Marque, TX | 3.0 | 1.0 | 1230 | $1,500 | $1.22 | 26d | 1 | 0.70mi |
| 228 S Algeria St Texas City, TX | 1.0 | 1.0 | 1831 | $630 | $0.34 | 0d | 1 | 0.99mi |
| 4417 Edward St Texas City, TX | 2.0 | 2.0 | 983 | $1,100 | $1.12 | 5d | 1 | 1.12mi |
| 4417 Edward St Texas City, TX | 2.0 | 2.0 | 983 | $1,150 | $1.17 | 4d | 1 | 1.12mi |
| 2729 Main St La Marque, TX | 2.0 | 1.0–2.0 | 864 | $950 | $1.10 | 0d | 3 | 1.18mi |
| 619 N Vionett Ln Texas City, TX | 3.0 | 2.0 | 1204 | $1,550 | $1.29 | 7d | 1 | 1.31mi |
| 7510 Hummingbird Ln Texas City, TX | 3.0 | 1.5 | 1200 | $1,550 | $1.29 | 4d | 1 | 1.50mi |
Listing history 42 events
-
2026-06-21days on market $159,999 Active 153 DOM
-
2026-06-18days on market $159,999 Active 150 DOM
-
2026-06-17days on market $159,999 Active 149 DOM
-
2026-06-16days on market $159,999 Active 148 DOM
-
2026-06-15days on market $159,999 Active 147 DOM
-
2026-06-13days on market $159,999 Active 145 DOM
-
2026-06-09days on market $159,999 Active 141 DOM
-
2026-06-08days on market $159,999 Active 140 DOM
-
2026-06-08remarks 650-char remark
-
2026-06-07days on market $159,999 Active 139 DOM
-
2026-06-04days on market $159,999 Active 136 DOM
-
2026-06-03days on market $159,999 Active 135 DOM
-
2026-06-02days on market $159,999 Active 134 DOM
-
2026-06-01days on market $159,999 Active 133 DOM
-
2026-05-31days on market $159,999 Active 132 DOM
-
2026-05-09price $159,999 631-char remark
Show marketing remark (631 chars)
Please come take a look at this inviting 2 bedroom 2 bath home with extra room that could be used as home office/study or anything you like in established neighborhood. No HOA. This home has a really nice, large and completely fenced in back yard. The home itself has a very large, open living area. The kitchen has a bar area that opens to the living room. The oversized primary bedroom has two closets. The home is located at the end of the street, so not a lot of through traffic. Presently, no back neighbors. Easy access to 1-45 and 146. A great opportunity to own a cute, clean and affordable home in a convenient location!
-
2026-02-12price $164,999 631-char remark
Show marketing remark (631 chars)
Please come take a look at this inviting 2 bedroom 2 bath home with extra room that could be used as home office/study or anything you like in established neighborhood. No HOA. This home has a really nice, large and completely fenced in back yard. The home itself has a very large, open living area. The kitchen has a bar area that opens to the living room. The oversized primary bedroom has two closets. The home is located at the end of the street, so not a lot of through traffic. Presently, no back neighbors. Easy access to 1-45 and 146. A great opportunity to own a cute, clean and affordable home in a convenient location!
-
2026-01-19$174,700 Active 631-char remark
Show marketing remark (631 chars)
Please come take a look at this inviting 2 bedroom 2 bath home with extra room that could be used as home office/study or anything you like in established neighborhood. No HOA. This home has a really nice, large and completely fenced in back yard. The home itself has a very large, open living area. The kitchen has a bar area that opens to the living room. The oversized primary bedroom has two closets. The home is located at the end of the street, so not a lot of through traffic. Presently, no back neighbors. Easy access to 1-45 and 146. A great opportunity to own a cute, clean and affordable home in a convenient location!
-
2025-04-02historical $1,650
-
2025-02-25$1,650
-
2022-09-27historical
-
2022-08-04price $174,900
-
2022-07-27price $184,900
-
2022-05-25$190,000 Active
-
2020-06-26status Active
-
2020-06-26historical
-
2020-02-21historical
-
2020-02-17$68,700 Active
-
2017-06-28historical
-
2017-03-05status Active
-
2017-03-02status Option Pending
-
2017-03-02status Active
-
2017-02-24status Option Pending
-
2017-02-21price $66,000
-
2017-02-19status Active
-
2017-02-16status Option Pending
-
2017-02-02$71,000 Active
-
2010-08-31soldstatus
-
2010-08-18historical
-
2010-04-14$32,900
-
2002-04-08historical
-
2001-07-05$59,500
ⓘ Source: listings_history table (triggers on properties + properties_extension) + one-shot
backfill from property_details.listing_events for pre-trigger history.
Tax reassessment forecast TX · Resets to sale price
- Current annual tax
- $3,156 · $263/mo
- Projected year-2 tax
- $3,156 · $263/mo
- Expected delta
- $0/yr ($0/mo · -0.0%)
ⓘ Screening estimate from a state-policy table — verify with the county assessor before closing.
Climate risk First Street
- Flood 7/10 Severe FEMA zone X (shaded) · 59% chance over 30 yrs
- Wildfire 1/10 Low
- Heat 10/10 Extreme 7 d/yr ≥109°F today · 27 d/yr by 30 yrs out
- Wind 10/10 Extreme 99% chance of damaging wind over 30 yrs
- Air quality 3/10 Moderate 2 unhealthy d/yr today · 2 by 30 yrs out
Nearby sold comps map
Loading sold comps map…
Walkable amenities ~0.75 mi
Loading nearby amenities…
Taxation est. · year 1
- Rental income
- $18,625
- − Mortgage interest
- −$8,962
- − Property taxes
- −$3,156
- − Insurance
- −$1,597
- − Repairs & maintenance
- −$1,490
- − Management
- −$1,490
- − Depreciation
- −$4,655
- Taxable loss
- −$2,725
- Est. tax savings @ 24.0%
- +$654
- After-tax cash flow
- $546/yr
For passive investors: Depreciation is non-cash, so a rental often shows a tax loss while cash-flowing — sheltering income. Rental losses are passive: they offset passive income freely, and up to $25,000/yr can offset ordinary (W-2) income if you actively participate and your MAGI is under $100k (phasing out to $0 by $150k); unused losses carry forward. On sale, claimed depreciation is recaptured at up to 25%, and gains may owe capital-gains tax (a 1031 exchange can defer both). Figures are a year-1 estimate at your 24.0% rate — not tax advice; consult a CPA.
Schools (NCES district)
- District
- Texas City ISD
- NCES district ID
- 4842510
- Math proficiency
- 28% ▼ -10.00%
- Reading proficiency
- 29% ▼ -4.00%
- Median HH income
- $44,875
- Composite
- 24.47/100
- National rank
- #7664
- State rank
- #655 of 826 in TX
Livability — La Marque
- Score
- 59/100
- State rank
- #1136
- US rank
- #20037
Category grades
Schools grade is shown separately in the Schools card above.
Census & demographics
- Census place
- La Marque, TX
- County
- Galveston County · 357,330 people
- City population
- 23,083
- Metro
- Houston-The Woodlands-Sugar Land, TX
- Population (ZIP)
- 23,083
- Household income
- $74,694
- Rent vs Own
- Severe rent burden
- 700.0
Population outlook (Galveston County) Hauer SSP2
- Today (2025)
- 390,640 people
- By 2030
- 425,226 · +8.9%
- By 2040
- 493,765 · +26.4%
- By 2050
- 559,698 · +43.3%
- By 2075
- 719,260 · +84.1%
- By 2100
- 819,628 · +109.8%
Race, ethnicity, and origin ACS 2023
- Neighborhood character
- Highly diverse neighborhood (Simpson 0.71)
- Race & ethnicity
- White 37% Hispanic / Latino 29% Black 26% Two or more races 17% Asian 3%
- Hispanic origin (detail)
- Mexican 22% Puerto Rican 1%
- Common ancestry
- Lithuanian 1% Italian 1% Serbian 1%
- Foreign-born
- 8% · Canada
- Languages at home
- 77% English-only · Spanish 21% Tagalog/Filipino 1% Other Asian/Pacific 1%
Political lean MEDSL · Galveston
- 2024 margin
- Strong R (+27.4) · D 35.7% · R 63.1% · Other 1.2%
- 2008→2024 swing
- -7.9pp toward R · 2008: -19.5pp · 2024: -27.4pp
- All cycles
- 2024: R+27.4 2020: R+22.6 2016: R+22.6 2012: R+26.9 2008: R+19.5
Not yet ingested
- Civics
- —
Market trends
- HPI YoY
- ▼ -69.39%
- Current HPI
- 236.0239
- Rent YoY
- ▲ 3.95%
- Metro
- Houston-The Woodlands-Sugar Land, TX
- State GDP YoY
- ▲ 3.95%
- F500 in state
- 110
Industry mix (Fortune 500 HQ in TX)
| Industry | F500 HQs | Revenue |
|---|---|---|
| Energy | 16 | $1,198B |
|
||
| Technology | 5 | $198B |
|
||
| Engineering / Construction | 4 | $72B |
|
||
| Energy Services | 3 | $60B |
|
||
| Utilities | 3 | $41B |
|
||
| Healthcare | 2 | $330B |
|
||
Price history
+168.9% since first listed27 events — show timeline
- 2026-05-09 Price Changed $159,999 HARMLS
- 2026-02-12 Price Changed $164,999 HARMLS
- 2026-01-19 Listed $174,700 HARMLS
- 2025-04-02 Rental Removed $1,650 REDFIN
- 2025-02-25 Listed for Rent $1,650 REDFIN
- 2022-09-27 Listing Removed — HARMLS
- 2022-08-04 Price Changed $174,900 HARMLS
- 2022-07-27 Price Changed $184,900 HARMLS
- 2022-05-25 Listed $190,000 HARMLS
- 2020-06-26 Relisted — HARMLS
- 2020-06-26 Listing Removed — HARMLS
- 2020-02-21 Listing Removed — HARMLS
- 2020-02-17 Listed $68,700 HARMLS
- 2017-06-28 Listing Removed — HARMLS
- 2017-03-05 Relisted — HARMLS
- 2017-03-02 Pending — HARMLS
- 2017-03-02 Relisted — HARMLS
- 2017-02-24 Pending — HARMLS
- 2017-02-21 Price Changed $66,000 HARMLS
- 2017-02-19 Relisted — HARMLS
- 2017-02-16 Pending — HARMLS
- 2017-02-02 Listed $71,000 HARMLS
- 2010-08-31 Sold (Public Records) — Public Records
- 2010-08-18 Listing Removed — HARMLS
- 2010-04-14 Listed $32,900 HARMLS
- 2002-04-08 Listing Removed — HARMLS
- 2001-07-05 Listed $59,500 HARMLS
Property tax history
+12.0%/yrLatest (2025): $3,156 · +23.6% YoY. Source: county tax records.
Cash-flow waterfall
monthlySold comps — $/sqft
last 12 mo · ≤1 miLoading sold comps…