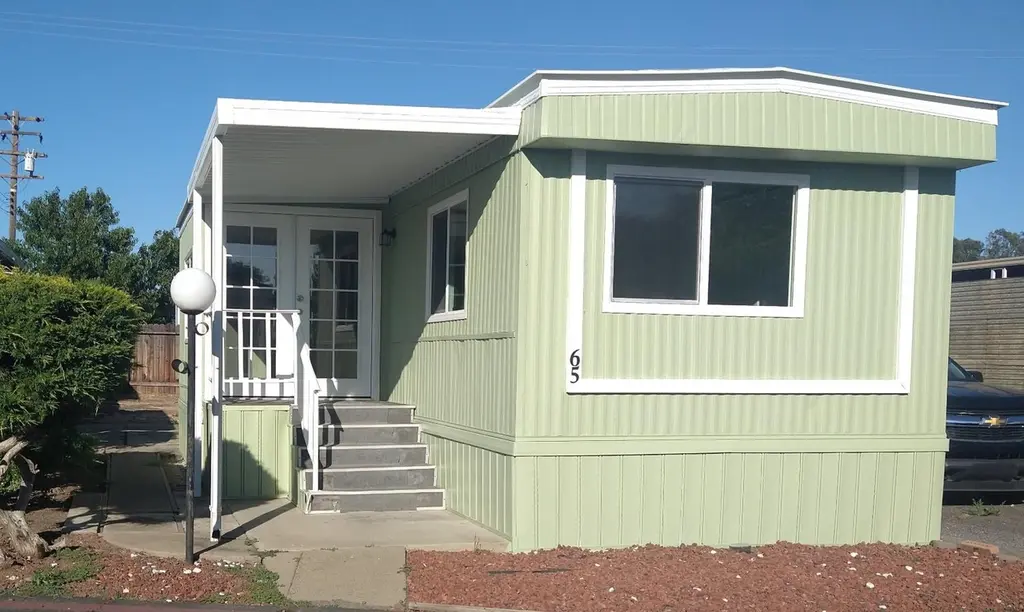
6025 Dias Ave #65 · Sacramento, CA
Flood risk 1/10 · Minimal
- FEMA flood zone
- X
- Chance of flooding over 30 yrs
- 0.0%
- Est. flood insurance / yr
- $507 – $1,088
Fire risk 1/10 · Minimal
- Est. fire insurance / yr
- $659 – $1,223
Heat risk 7/10 · Major
- Hot days now (above 102°F)
- 6 days/yr
- Hot days in 30 yrs
- 13 days/yr
Wind risk 1/10 · Minimal
- Chance of severe wind over 30 yrs
- —
Air-quality risk 10/10 · Severe
- Unhealthy air days now
- 28 days/yr
- Unhealthy air days in 30 yrs
- 33 days/yr
Risk factors via First Street. Map © Google.
Why this score? — see what drove the B grade
The composite is a weighted blend of 9 inputs, each scored 0–100. Each bar is that input's sub-score; the figure is the points it added to the 100-point composite (weight × sub-score).
- Cash flow +30.0/30.0
- 1% rule +10.0/10.0
- DSCR +10.0/10.0
- ARV discount +7.5/15.0
- Rent growth +4.1/5.0
- Livability +3.6/5.0
- Schools +3.5/10.0
- Condition / age +2.5/5.0
- Appreciation +0.0/10.0
$100,000
🖨 Deal sheet 📄 Offer letter ✓ Due diligence
Listing remarks
Delightfully Remodeled Skyline Manufactured Home in All-Ages Park that's close to schools, shopping and bus stops. 2 bedrooms and 1 bath ready for immediate move-in. Sellers completed total renovation with dual-pane windows, double front doors, new light switches, new grounded outlets, living room ceiling fan, recessed cup lights, Luxury Vinyl Plank simulated wood floor, sheet rock interior walls. Kitchen has new sink with faucet, quartz countertops, new cabinets and drawers, disposal and range hood with exhaust. Bathroom has new sink with faucet, tub with shower and toilet. Home has new water heater, furnace and central air units! New owner may install refrigerator with water and ice maker
Key facts
- Total renovation
- Recessed cup lights
- Dual-pane windows
Tags
Property features AI
Finance
- Other: Located in Sacramento, CA (95824); directions available to park entrance and space number
- HOA & community: No homeowners association; Community of 222 units; Not a senior community; Land lease not required (listed land lease amount noted separately)
Exterior
- Parking: Off-street parking; Guest parking available; No garage (parking total: 2)
- Utilities: Individual electric meter; Individual gas meter; Natural gas connected; Internet available; Underground utilities; Private water (well); Private and public sewer listed
- Home design: Manufactured in park (single wide); Skyline make; Updated/remodeled; Built in 1978
- Construction: Metal roof; Aluminum/metal skirting; Single-wide manufactured home
- Exterior features: Backyard; Close to clubhouse; Regular-shaped lot; Porch awning
Interior
- Kitchen: Stone counters; Hood over range; Plumbed for ice maker; Garbage disposal; Gas water heater
- Bedrooms: 2 bedrooms
- Flooring: Simulated wood flooring
- Bathrooms: 1 full bathroom with tub/shower combo
- Heating & cooling: Central heating (gas); Central cooling; Ceiling fans
- Interior features: Updated/remodeled interior; Porch with awning, porch steps and railings; Dual-pane full windows; Carpeted porch
- Laundry & utility: Washer/dryer hookups inside; 220V outlet in laundry
Neighborhood map
What this means for you Summary
Snapshot
- This is a 2-bed/1.0-bath manufactured listed at $100k.
Deal economics
- At list price, monthly cash flow is $500 ($6k/yr) — positive.
- The deal already cash-flows at list — no discount required.
- Meets the 1% rule at list price ($2k rent vs $100k).
- Cap rate 12.3% vs local median 3.0% in Sacramento — top-decile yield for the area; either an underpriced asset or a hidden risk that comps aren't pricing in. Stress-test before assuming the spread holds.
Location & tenants
- Location reads 71/100 on livability (#218 in CA) — a middle-class / working-renter tenant base. Strengths: amenities A+, commute A+, housing A; Watch: schools D+, crime F, cost of living F.
- Sacramento City Unified (urban): math 32% / reading 43% proficiency, ranked #804 of 1,400 in CA (top 57%) — families likely to look elsewhere, expect single-tenant / working-renter base with shorter leases; 63% free/reduced lunch — lower-income household profile, screen leases tightly.
- Market conditions: Rents rising fast (+6.4%/yr); 67 active listings in the ZIP; 22 comparable units currently listed for rent nearby; rentals at typical pace (median 21d on market — plan ~3-4 weeks tenant-placement turnaround); 6,825 units permitted in Sacramento County in 2024 (1,752 in 5+ unit buildings).
- This rent runs 32% of the median local income ($56k/yr) — at the standard rent-burdened threshold; future hikes will face affordability resistance.
Forward outlook
- Local home prices are declining (-3.0%/yr); year-one equity from $691 of loan paydown is wiped out by about $3k of value loss. Plan a longer hold.
- Sacramento County population projected at +17% by 2050 — long-run rental-demand tailwind backs the buy-and-hold thesis.
- At projected returns (-3.0% appreciation + 6.4% rent growth), your $28k cash investment doubles in ~5 years — after that, you're playing with house money.
Negotiation context
- Only 13 days on market — expect competitive offers; lowballing is unlikely to land.
Risks & watch-outs
- Climate carrying-cost: extreme-heat days projected 6→13/yr by 2055 (HVAC capex compounding) — expect insurance premiums to compound above CPI over the hold.
Questions for the listing agent
- Built in 1978 — when were the roof, HVAC, electrical panel, plumbing, and water heater last replaced?
- Is there a deadline driving the sale (1031 exchange, divorce, estate, relocation)? That informs how much negotiation room exists.
- Schools are D-rated, which usually means shorter tenancies and higher turnover. Who's the typical renter profile here, and what's been the actual vacancy rate?
- Crime grade is F in this area — have there been break-ins, vandalism, or insurance claims at this property in the last 3 years? What carrier currently insures it and at what premium?
- What's the average days-on-market for RENTAL listings here right now (not sales)? A rising rental-DOM trend means longer vacancies and softer asking-rent achievability than the comps imply.
- What's the recent tenant-quality profile in this submarket — average credit score on applications, eviction rate, late-payment / NSF rate, and stable-employment percentage? A property-management company in the area should have these aggregated.
- How much new for-sale + rental construction is in the pipeline within 1–3 miles? Heavy new supply typically softens prices + rents 12–24 months out; constrained supply supports both.
Investment metrics
- 1% rule
- 1.51% ✓
- Cap rate
- 12.29%
- Cash-on-cash
- 21.41%
- DSCR
- 1.95
- GRM
- 5.5
CMA / ARV
- ARV (on-the-fly)
- $57,792
- Comps found
- 5
Show comp detail 5 sales within ~0.75 mi
| Address | Dist | Beds/Ba | Sqft | Sold | Price | $/sf | Match |
|---|---|---|---|---|---|---|---|
| 6414 Capital Dr #20 | 0.31mi | 2/1.0 | 720 (+7%) | 10mo | $40,000 | $56 | 65 |
| 6401 Capital Cir #17 | 0.30mi | 2/1.0 | 720 (+7%) | 21mo | $75,000 | $104 | 56 |
| 6025 Dias Ave #17 | 0.13mi | 1/1.5 (-1) | 757 (+13%) | 15mo | $60,000 | $79 | 53 |
| 6311 Convention Ln #100 | 0.49mi | 2/2.0 | 768 (+14%) | 6mo | $75,000 | $98 | 44 |
| 6727 Capital Cir #225 | 0.64mi | 1/1.0 (-1) | 700 (+4%) | 23mo | $60,000 | $86 | 39 |
Match score weights: distance 35% · size 25% · config 20% · recency 20%. Top-matched comps best support the ARV.
Projected returns pro-forma
-3.0% appreciation · 6.44% rent growth · sell at horizon
- IRR
- 17.8%
- Equity multiple
- 1.75×
- Total profit
- $21,033
- Equity at exit
- $14,910
- IRR
- 28.6%
- Equity multiple
- 3.97×
- Total profit
- $83,148
- Equity at exit
- $8,646
Cash invested: $28,000 (down + closing). Projections, not guarantees.
Landlord ↔ Tenant lean methodology
- Overall (STATE)
- 18 Strongly Tenant-Friendly
- State California
- 18 Strongly Tenant-Friendly · D+13
- County
- — inherits STATE
- City
- — inherits STATE
ZIP-level market 95824
- Rents YoY
- 6.4%
- Active inventory
- 67
- Price-to-rent
- 5.5×
Monthly cashflow live
- Estimated rent
- $1,507 high interval (Pro) →
- Mortgage (P&I)
- −$524
- Tax est. 1.5%
- −$125 /mo · $1,500/yr
- Insurance
- −$42
- HOA
- −$0
- Vacancy / Maint / Mgmt
- −$317
- Net cashflow
- $500
Break-even live
UW: 25.0% down · 7.5% · 30yr · 1.5% tax · 5.0% vac · 8.0% maint · 8.0% mgmt
Financing live
Cash to close
- Down payment
- $25,000
- Closing costs
- $3,000
- Reserves months
- —
- Total cash needed
- —
Loan-product check · same deal, 3 products live
Conventional
25% down · 7.5% · 30yr
- Down + closing
- —
- Monthly P&I
- —
- Monthly cashflow
- —
- DSCR
- —
- Eligible?
- —
Personal DTI + credit; lowest rate.
DSCR
20% down · 8.5% · 30yr
- Down + closing
- —
- Monthly P&I
- —
- Monthly cashflow
- —
- DSCR
- —
- Eligible?
- —
No personal income docs; deal must DSCR.
Hard money
10% down · 12.0% · 12mo
- Down + closing
- —
- Monthly P&I
- —
- Monthly cashflow
- —
- DSCR
- —
- Eligible?
- —
Short-term bridge; refi at stabilization.
Rent comps 22 comps
| Address | Beds | Baths | Sqft | Rent | $/sqft | DOM | Units | Dist |
|---|---|---|---|---|---|---|---|---|
| 6125 Stockton Blvd Sacramento, CA | 1.0 | 1.0 | 580 | $1,395 | $2.41 | 2d | 5 | 0.17mi |
| 6470 Stockton Blvd Sacramento, CA | 1.0–2.0 | 1.0–2.0 | 856 | $1,845 | $2.16 | 43d | 2 | 0.36mi |
| 6624 Lemon Hill Ave Sacramento, CA | 1.0 | 1.0 | 650 | $1,385 | $2.13 | 2d | 1 | 0.48mi |
| 5545 Sky Pkwy Sacramento, CA | 1.0–2.0 | 1.0 | 716 | $1,630 | $2.28 | 17d | 7 | 0.72mi |
| 5028 Thurman Way Sacramento, CA | 1.0 | 1.0 | 600 | $1,325 | $2.21 | 3d | 1 | 0.81mi |
| 5102 Gordon Dr Sacramento, CA | 1.0 | 1.0 | 650 | $1,590 | $2.45 | 43d | 1 | 0.81mi |
| 5100 Gordon Dr Sacramento, CA | 1.0 | 1.0 | 650 | $1,300 | $2.00 | 43d | 1 | 0.82mi |
| 5364 Young St Unit 6 Sacramento, CA | 2.0 | 1.0 | 750 | $1,545 | $2.06 | 4d | 1 | 0.88mi |
| 5630 53rd St Unit 2 Sacramento, CA | 1.0 | 1.0 | 550 | $995 | $1.81 | 4d | 1 | 0.96mi |
| 5626 53rd St Unit 2 Sacramento, CA | 1.0 | 1.0 | 500 | $995 | $1.99 | 23d | 1 | 0.97mi |
| 6500 47th St Sacramento, CA | 1.0–2.0 | 1.0–2.0 | 715 | $1,650 | $2.31 | 43d | 7 | 0.99mi |
| 6921 Lewiston Way Sacramento, CA | 1.0 | 1.0 | 569 | $1,495 | $2.63 | 3d | 5 | 1.02mi |
| 5730 Falconer Way Unit B Sacramento, CA | 2.0 | 1.0 | 750 | $1,400 | $1.87 | 23d | 1 | 1.07mi |
| 5730 Falconer Way Unit D Sacramento, CA | 2.0 | 1.0 | 750 | $1,350 | $1.80 | 20d | 1 | 1.07mi |
| 5720 Falconer Way Apt B Sacramento, CA | 2.0 | 1.0 | 750 | $1,350 | $1.80 | 23d | 1 | 1.07mi |
| 5724 Falconer Way Unit 2 Sacramento, CA | 2.0 | 1.5 | 750 | $1,500 | $2.00 | 43d | 1 | 1.08mi |
| 5726 Falconer Way Unit 6 Sacramento, CA | 2.0 | 1.0 | 750 | $1,400 | $1.87 | 23d | 1 | 1.09mi |
| 5726 Falconer Way Unit 4 Sacramento, CA | 2.0 | 1.0 | 750 | $1,350 | $1.80 | 23d | 1 | 1.09mi |
| 5431 Bradford Dr Sacramento, CA | 2.0 | 1.0 | 600 | $1,750 | $2.92 | 4d | 1 | 1.41mi |
| 7051 Bowling Dr Sacramento, CA | 1.0–2.0 | 1.0–1.5 | 716 | $1,445 | $2.02 | 2d | 5 | 1.45mi |
| 5609 Odea Dr Sacramento, CA | 2.0 | 2.0 | 650 | $1,795 | $2.76 | 7d | 1 | 1.46mi |
| 4500 63rd St Sacramento, CA | 1.0–2.0 | 1.0 | 675 | $1,695 | $2.51 | 14d | 2 | 1.48mi |
Listing history 1 events
-
2026-05-31days on market $100,000 Active 13 DOM
ⓘ Source: listings_history table (triggers on properties + properties_extension) + one-shot
backfill from property_details.listing_events for pre-trigger history.
Climate risk First Street
- Flood 1/10 Low FEMA zone X · 0% chance over 30 yrs
- Wildfire 1/10 Low
- Heat 7/10 Severe 6 d/yr ≥102°F today · 13 d/yr by 30 yrs out
- Wind 1/10 Low
- Air quality 10/10 Extreme 28 unhealthy d/yr today · 33 by 30 yrs out
Nearby sold comps map
Loading sold comps map…
Walkable amenities ~0.75 mi
Loading nearby amenities…
Taxation est. · year 1
- Rental income
- $18,086
- − Mortgage interest
- −$5,602
- − Property taxes
- −$1,500
- − Insurance
- −$500
- − Repairs & maintenance
- −$1,447
- − Management
- −$1,447
- − Depreciation
- −$2,909
- Taxable income
- $4,682
- Est. tax owed @ 24.0%
- −$1,124
- After-tax cash flow
- $4,871/yr
For passive investors: Depreciation is non-cash, so a rental often shows a tax loss while cash-flowing — sheltering income. Rental losses are passive: they offset passive income freely, and up to $25,000/yr can offset ordinary (W-2) income if you actively participate and your MAGI is under $100k (phasing out to $0 by $150k); unused losses carry forward. On sale, claimed depreciation is recaptured at up to 25%, and gains may owe capital-gains tax (a 1031 exchange can defer both). Figures are a year-1 estimate at your 24.0% rate — not tax advice; consult a CPA.
Schools (NCES district)
- District
- Sacramento City Unified
- NCES district ID
- 0633840
- Math proficiency
- 32% ▬ 0.00%
- Reading proficiency
- 43% ▲ 3.00%
- Median HH income
- $49,280
- Composite
- 34.86/100
- National rank
- #10000
- State rank
- #804 of 1400 in CA
Livability — Sacramento
- Score
- 71/100
- State rank
- #218
- US rank
- #6957
Category grades
Schools grade is shown separately in the Schools card above.
Census & demographics
- Census place
- Sacramento, CA
- County
- Sacramento County · 1,539,646 people
- City population
- 761,410
- Metro
- Sacramento-Roseville-Folsom, CA
- Population (ZIP)
- 33,083
- Household income
- $56,477
- Rent vs Own
- Severe rent burden
- 1671.0
Population outlook (Sacramento County) Hauer SSP2
- Today (2025)
- 1,660,763 people
- By 2030
- 1,732,990 · +4.3%
- By 2040
- 1,855,755 · +11.7%
- By 2050
- 1,941,335 · +16.9%
- By 2075
- 2,046,162 · +23.2%
- By 2100
- 1,961,444 · +18.1%
Race, ethnicity, and origin ACS 2023
- Neighborhood character
- Highly diverse neighborhood (Simpson 0.70)
- Race & ethnicity
- Hispanic / Latino 43% Asian 29% White 13% Two or more races 12% Black 10% Native American 2% Pacific Islander 2%
- Hispanic origin (detail)
- Mexican 38%
- Common ancestry
- Lithuanian 1% Russian 1%
- Foreign-born
- 33% · Canada, Vietnam, China
- Languages at home
- 44% English-only · Spanish 29% Other Asian/Pacific 12% Vietnamese 5%
Political lean MEDSL · Sacramento
- 2024 margin
- D (+19.7) · D 58.1% · R 38.4% · Other 3.5%
- 2008→2024 swing
- +0.7pp no change · 2008: 19.0pp · 2024: 19.7pp
- All cycles
- 2024: D+19.7 2020: D+25.3 2016: D+23.7 2012: D+16.3 2008: D+19.0
Not yet ingested
- Civics
- —
Market trends
- HPI YoY
- ▼ -341.41%
- Current HPI
- 409.6203
- Rent YoY
- ▲ 6.44%
- Metro
- Sacramento-Roseville-Folsom, CA
- State GDP YoY
- ▲ 3.21%
- F500 in state
- 116
Industry mix (Fortune 500 HQ in CA)
| Industry | F500 HQs | Revenue |
|---|---|---|
| Technology | 27 | $1,492B |
|
||
| Financial Services | 3 | $174B |
|
||
| Retail | 3 | $44B |
|
||
| Insurance | 3 | $26B |
|
||
| Media / Entertainment | 2 | $115B |
|
||
| Pharmaceuticals / Biotech | 2 | $62B |
|
||
Property tax history
+9.1%/yrLatest (2025): $116 · -3.1% YoY. Source: county tax records.
Cash-flow waterfall
monthlySold comps — $/sqft
last 12 mo · ≤1 miLoading sold comps…