302 N Illinois Ave · West Frankfort, IL
Flood risk 1/10 · Minimal
- FEMA flood zone
- X (unshaded)
- Chance of flooding over 30 yrs
- 0.0%
- Est. flood insurance / yr
- $473 – $860
Fire risk 1/10 · Minimal
- Est. fire insurance / yr
- $804 – $1,492
Heat risk 5/10 · Moderate
- Hot days now (above 107°F)
- 7 days/yr
- Hot days in 30 yrs
- 20 days/yr
Wind risk 2/10 · Minimal
- Chance of severe wind over 30 yrs
- 3.0%
Air-quality risk 2/10 · Minimal
- Unhealthy air days now
- 0 days/yr
- Unhealthy air days in 30 yrs
- 1 days/yr
Risk factors via First Street. Map © Google.
Why this score? — see what drove the B- grade
The composite is a weighted blend of 9 inputs, each scored 0–100. Each bar is that input's sub-score; the figure is the points it added to the 100-point composite (weight × sub-score).
- Cash flow +30.0/30.0
- 1% rule +10.0/10.0
- DSCR +10.0/10.0
- ARV discount +7.5/15.0
- Livability +2.8/5.0
- Rent growth +2.5/5.0
- Condition / age +2.5/5.0
- Schools +0.9/10.0
- Appreciation +0.0/10.0
$50,000
🖨 Deal sheet 📄 Offer letter ✓ Due diligence
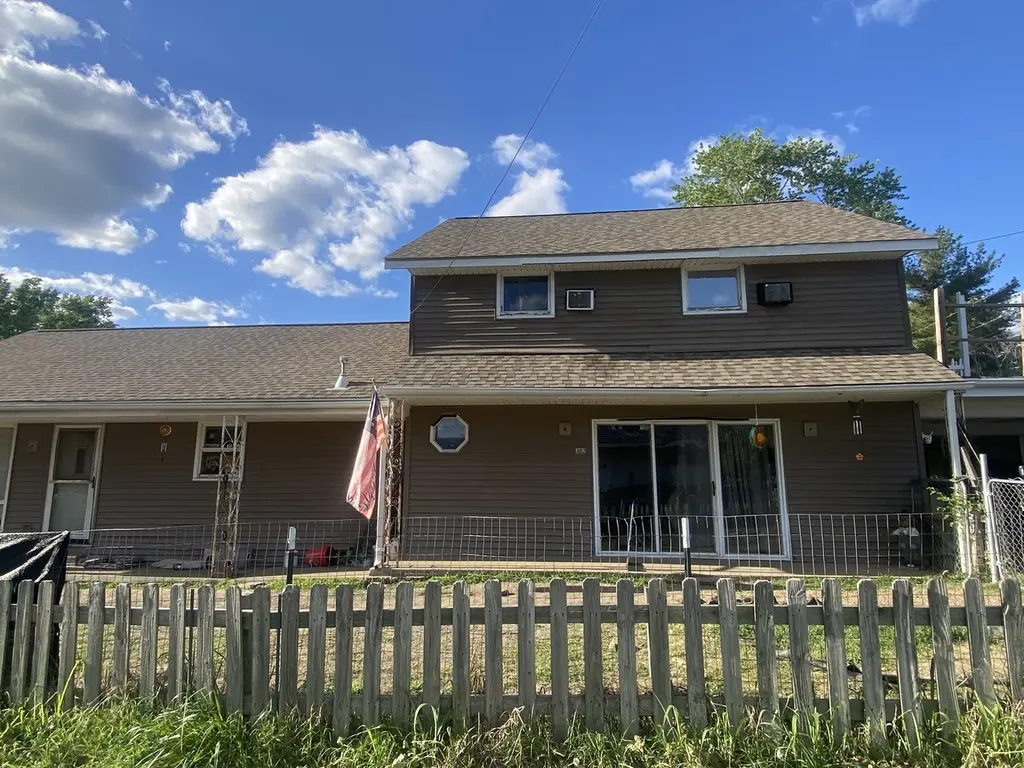
Listing remarks
Tons of opportunities with this 2160 square foot home. With your vision this 4 bedroom, 2 and a half bath home can become the home of your dreams. This home offers an newer roof and vinyl siding, as well as two kitchens. This is the perfect project if you are looking to completly make a home your own, or perhaps make it your next investment property.
Key facts
- Two kitchens
- Newer roof
- Vinyl siding
Tags
Property features AI
Finance
- Other: Possession at closing
- HOA & community: No master association fee required
Exterior
- Utilities: Public water; Public sewer
- Home design: Detached single-family home; 1.5-story design; Fee simple ownership
- Construction: Built 61–70 years ago; Vinyl siding; Shake roof; Home built before 1978
- Exterior features: Lot dimensions 122 x 100; Approximately 0.25–0.49 acre lot
Interior
- Kitchen: Kitchen on main level (20 x 13)
- Bedrooms: Four bedrooms total; Master bedroom on main level (28 x 9); Second-level bedrooms: one 15 x 10, one 11 x 11, one 11 x 12
- Bathrooms: Two full bathrooms; One half bathroom
- Heating & cooling: Electric heating; Window air conditioning units
- Interior features: Six total rooms; Dining room; Family room; Living room
- Laundry & utility: Laundry room
Neighborhood map
What this means for you Summary
Snapshot
- This is a 4-bed/2.5-bath other listed at $50k.
Deal economics
- At list price, monthly cash flow is $763 ($9k/yr) — positive.
- The deal already cash-flows at list — no discount required.
- Meets the 1% rule at list price ($1k rent vs $50k).
- Recommended offer: $48k (3.0% below list) — sets the bar for market timing.
- Cap rate 24.6% vs local median 5.8% in West Frankfort — top-decile yield for the area; either an underpriced asset or a hidden risk that comps aren't pricing in. Stress-test before assuming the spread holds.
Location & tenants
- Location reads 56/100 on livability (#1,210 in IL) — a working-class tenant base; expect higher turnover. Strengths: cost of living A+, housing A+; Watch: crime D, schools F, amenities F.
- Frankfort CUSD 168 (town): math 6% / reading 16% proficiency, ranked #577 of 620 in IL (top 93%) — low school quality limits family demand, transient renter base, plan for 1-2y turnover.
- Market conditions: 90 active listings in the ZIP; 17 units permitted in Franklin County in 2024 (0 in 5+ unit buildings).
Forward outlook
- Local home prices are declining (-3.0%/yr); year-one equity from $346 of loan paydown is wiped out by about $2k of value loss. Plan a longer hold.
- Franklin County population projected at -16% by 2050 — secular population decline; favor cash flow + early exit over multi-decade hold.
- At projected returns (-3.0% appreciation + 3.0% rent growth), your $14k cash investment doubles in ~2 years — after that, you're playing with house money.
Negotiation context
- It's been on market 35 days — a 3% lower offer ($48k) is reasonable based on typical stale-listing flexibility.
- 8 sale attempts since 11y ago; this cycle's ask is 11% above the opening price — seller raised mid-cycle; expect resistance to lowballs.
Risks & watch-outs
- Climate carrying-cost: extreme-heat days projected 7→20/yr by 2055 (HVAC capex compounding) — expect insurance premiums to compound above CPI over the hold.
Questions for the listing agent
- It's been on market 35 days. Have you received any prior offers? Is the seller open to a 3% concession, seller financing, or rate buy-down credit?
- Is there a deadline driving the sale (1031 exchange, divorce, estate, relocation)? That informs how much negotiation room exists.
- Schools are F-rated, which usually means shorter tenancies and higher turnover. Who's the typical renter profile here, and what's been the actual vacancy rate?
- Crime grade is D in this area — have there been break-ins, vandalism, or insurance claims at this property in the last 3 years? What carrier currently insures it and at what premium?
- What's the average days-on-market for RENTAL listings here right now (not sales)? A rising rental-DOM trend means longer vacancies and softer asking-rent achievability than the comps imply.
- What's the recent tenant-quality profile in this submarket — average credit score on applications, eviction rate, late-payment / NSF rate, and stable-employment percentage? A property-management company in the area should have these aggregated.
- How much new for-sale + rental construction is in the pipeline within 1–3 miles? Heavy new supply typically softens prices + rents 12–24 months out; constrained supply supports both.
Investment metrics
- 1% rule
- 2.81% ✓
- Cap rate
- 24.61%
- Cash-on-cash
- 65.43%
- DSCR
- 3.91
- GRM
- 3.0
CMA / ARV
- ARV (median comp)
- $111,061
- List price
- $50,000
- Delta
- -54.98%
- Verdict
- UNDERPRICED
- Comps
- 20 within 1.0 mi
Projected returns pro-forma
-3.0% appreciation · 3.0% rent growth · sell at horizon
- IRR
- 64.6%
- Equity multiple
- 3.90×
- Total profit
- $40,539
- Equity at exit
- $7,455
- IRR
- 69.0%
- Equity multiple
- 8.00×
- Total profit
- $97,992
- Equity at exit
- $4,323
Cash invested: $14,000 (down + closing). Projections, not guarantees.
Landlord ↔ Tenant lean methodology
- Overall (STATE)
- 43 Moderately Tenant-Leaning
- State Illinois
- 43 Moderately Tenant-Leaning · D+7
- County
- — inherits STATE
- City
- — inherits STATE
ZIP-level market 62896
- Active inventory
- 90
- Price-to-rent
- 3.0×
Monthly cashflow live
- Estimated rent
- $1,404 medium interval (Pro) →
- Mortgage (P&I)
- −$262
- Tax est. 1.5%
- −$62 /mo · $750/yr
- Insurance
- −$21
- HOA
- −$0
- Vacancy / Maint / Mgmt
- −$295
- Net cashflow
- $763
Break-even live
UW: 25.0% down · 7.5% · 30yr · 1.5% tax · 5.0% vac · 8.0% maint · 8.0% mgmt
Financing live
Cash to close
- Down payment
- $12,500
- Closing costs
- $1,500
- Reserves months
- —
- Total cash needed
- —
Loan-product check · same deal, 3 products live
Conventional
25% down · 7.5% · 30yr
- Down + closing
- —
- Monthly P&I
- —
- Monthly cashflow
- —
- DSCR
- —
- Eligible?
- —
Personal DTI + credit; lowest rate.
DSCR
20% down · 8.5% · 30yr
- Down + closing
- —
- Monthly P&I
- —
- Monthly cashflow
- —
- DSCR
- —
- Eligible?
- —
No personal income docs; deal must DSCR.
Hard money
10% down · 12.0% · 12mo
- Down + closing
- —
- Monthly P&I
- —
- Monthly cashflow
- —
- DSCR
- —
- Eligible?
- —
Short-term bridge; refi at stabilization.
Listing history 34 events
-
2026-06-18days on market $50,000 Active 35 DOM
-
2026-06-17days on market $50,000 Active 34 DOM
-
2026-06-16days on market $50,000 Active 33 DOM
-
2026-06-15days on market $50,000 Active 32 DOM
-
2026-06-13days on market $50,000 Active 30 DOM
-
2026-06-12statusdays on market $50,000 Active 29 DOM
-
2026-06-07statusdays on market $50,000 Pending 27 DOM
-
2026-06-04days on market $50,000 Active 26 DOM
-
2026-06-02days on market $50,000 Active 25 DOM
-
2026-06-01days on market $50,000 Active 24 DOM
-
2026-05-31days on market $50,000 Active 23 DOM
-
2026-05-31days on market $50,000 Active 22 DOM
-
2026-05-06status Pending 352-char remark
-
2025-12-02historical
-
2025-10-16price
-
2025-10-09price
-
2025-10-02price
-
2025-09-09price
-
2025-08-27Active
-
2024-06-20historical
-
2024-06-19historical
-
2024-02-19price
-
2024-01-10price
-
2023-12-21Active
-
2023-09-19soldstatus $45,100
-
2023-09-19soldstatus $45,100 Closed
-
2023-07-31status Pending
-
2023-07-25$45,000
-
2023-07-25$45,000 Active
-
2021-08-07historical
-
2016-10-17soldstatus $90,000
-
2016-10-17soldstatus $90,000
-
2015-05-11$84,500
-
2015-05-11$84,500
ⓘ Source: listings_history table (triggers on properties + properties_extension) + one-shot
backfill from property_details.listing_events for pre-trigger history.
Climate risk First Street
- Flood 1/10 Low FEMA zone X (unshaded) · 0% chance over 30 yrs
- Wildfire 1/10 Low
- Heat 5/10 Major 7 d/yr ≥107°F today · 20 d/yr by 30 yrs out
- Wind 2/10 Low 3% chance of damaging wind over 30 yrs
- Air quality 2/10 Low 0 unhealthy d/yr today · 1 by 30 yrs out
Nearby sold comps map
Loading sold comps map…
Walkable amenities ~0.75 mi
Loading nearby amenities…
Taxation est. · year 1
- Rental income
- $16,844
- − Mortgage interest
- −$2,801
- − Property taxes
- −$750
- − Insurance
- −$250
- − Repairs & maintenance
- −$1,348
- − Management
- −$1,348
- − Depreciation
- −$1,455
- Taxable income
- $8,894
- Est. tax owed @ 24.0%
- −$2,135
- After-tax cash flow
- $7,026/yr
For passive investors: Depreciation is non-cash, so a rental often shows a tax loss while cash-flowing — sheltering income. Rental losses are passive: they offset passive income freely, and up to $25,000/yr can offset ordinary (W-2) income if you actively participate and your MAGI is under $100k (phasing out to $0 by $150k); unused losses carry forward. On sale, claimed depreciation is recaptured at up to 25%, and gains may owe capital-gains tax (a 1031 exchange can defer both). Figures are a year-1 estimate at your 24.0% rate — not tax advice; consult a CPA.
Schools (NCES district)
- District
- Frankfort CUSD 168
- NCES district ID
- 1741580
- Math proficiency
- 6% ▼ -9.00%
- Reading proficiency
- 16% ▼ -10.00%
- Median HH income
- $34,447
- Composite
- 8.93/100
- National rank
- #9886
- State rank
- #577 of 620 in IL
Livability — West Frankfort
- Score
- 56/100
- State rank
- #1210
- US rank
- #22742
Category grades
Schools grade is shown separately in the Schools card above.
Census & demographics
- Census place
- West Frankfort, IL
- City population
- 10,691
- Population (ZIP)
- 10,691
Population outlook (Franklin County) Hauer SSP2
- Today (2025)
- 37,954 people
- By 2030
- 36,828 · -3.0%
- By 2040
- 34,452 · -9.2%
- By 2050
- 31,855 · -16.1%
- By 2075
- 25,171 · -33.7%
- By 2100
- 18,462 · -51.4%
Race, ethnicity, and origin ACS 2023
- Neighborhood character
- Predominantly White (96%)
- Race & ethnicity
- White 96% Two or more races 2%
- Common ancestry
- Romanian 2% Lithuanian 1% Iranian 1%
- Foreign-born
- 1% · Canada, Jamaica
- Languages at home
- 98% English-only · Spanish 1%
Political lean MEDSL · Franklin
- 2024 margin
- Solid R (+50.6) · D 24.1% · R 74.6% · Other 1.3%
- 2008→2024 swing
- -47.8pp toward R · 2008: -2.8pp · 2024: -50.6pp
- All cycles
- 2024: R+50.6 2020: R+47.5 2016: R+45.3 2012: R+16.8 2008: R+2.8
Not yet ingested
- Civics
- —
Market trends
- HPI YoY
- ▼ -94.00%
- Current HPI
- 86.36
- Rent YoY
- —
- Metro
- —
- State GDP YoY
- ▲ 1.59%
- F500 in state
- 60
Industry mix (Fortune 500 HQ in IL)
| Industry | F500 HQs | Revenue |
|---|---|---|
| Insurance | 4 | $201B |
|
||
| Consumer Goods | 4 | $87B |
|
||
| Industrial Machinery | 3 | $64B |
|
||
| Healthcare | 2 | $55B |
|
||
| Retail / Pharmacy | 1 | $148B |
|
||
| Agriculture / Food | 1 | $86B |
|
||
Price history
-46.6% since first listed25 events — show timeline
- 2026-06-10 Relisted — MRED as Distributed by MLS Grid
- 2026-06-04 Pending — MRED as Distributed by MLS Grid
- 2026-05-21 Relisted — MRED as Distributed by MLS Grid
- 2026-05-06 Pending — MRED as Distributed by MLS Grid
- 2025-12-02 Listing Removed — MRED as Distributed by MLS Grid
- 2025-10-16 Price Changed — MRED as Distributed by MLS Grid
- 2025-10-09 Price Changed — MRED as Distributed by MLS Grid
- 2025-10-02 Price Changed — MRED as Distributed by MLS Grid
- 2025-09-09 Price Changed — MRED as Distributed by MLS Grid
- 2025-08-27 Listed — MRED as Distributed by MLS Grid
- 2024-06-20 Listing Removed — RMLSA as Distributed by MLS Grid
- 2024-06-19 Listing Removed — MRED as Distributed by MLS Grid
- 2024-02-19 Price Changed — RMLSA as Distributed by MLS Grid
- 2024-01-10 Price Changed — RMLSA as Distributed by MLS Grid
- 2023-12-21 Listed — RMLSA as Distributed by MLS Grid
- 2023-09-19 Sold (MLS) $45,100 RMLSA as Distributed by MLS Grid
- 2023-09-19 Sold (MLS) $45,100 MRED as Distributed by MLS Grid
- 2023-07-31 Pending — RMLSA as Distributed by MLS Grid
- 2023-07-25 Listed $45,000 RMLSA as Distributed by MLS Grid
- 2023-07-25 Listed $45,000 MRED as Distributed by MLS Grid
- 2021-08-07 Listing Removed — RMLSA as Distributed by MLS Grid
- 2016-10-17 Sold (MLS) $90,000 RMLSA as Distributed by MLS Grid
- 2016-10-17 Sold (MLS) $90,000 MRED as Distributed by MLS Grid
- 2015-05-11 Listed $84,500 RMLSA as Distributed by MLS Grid
- 2015-05-11 Listed $84,500 MRED as Distributed by MLS Grid
Property tax history
+9.6%/yrLatest (2024): $3,938 · +8.0% YoY. Source: county tax records.
Cash-flow waterfall
monthlySold comps — $/sqft
last 12 mo · ≤1 miLoading sold comps…