None · Williamsville, NY
Flood risk 1/10 · Minimal
- FEMA flood zone
- X (unshaded)
- Chance of flooding over 30 yrs
- 0.0%
- Est. flood insurance / yr
- $473 – $860
Fire risk 1/10 · Minimal
- Est. fire insurance / yr
- $691 – $1,283
Heat risk 3/10 · Minor
- Hot days now (above 94°F)
- 7 days/yr
- Hot days in 30 yrs
- 15 days/yr
Wind risk 1/10 · Minimal
- Chance of severe wind over 30 yrs
- —
Air-quality risk 2/10 · Minimal
- Unhealthy air days now
- 2 days/yr
- Unhealthy air days in 30 yrs
- 2 days/yr
Risk factors via First Street. Map © Google.
Why this score? — see what drove the C grade
The composite is a weighted blend of 9 inputs, each scored 0–100. Each bar is that input's sub-score; the figure is the points it added to the 100-point composite (weight × sub-score).
- Cash flow +20.2/30.0
- ARV discount +7.5/15.0
- DSCR +6.4/10.0
- Schools +6.3/10.0
- 1% rule +5.3/10.0
- Livability +4.2/5.0
- Rent growth +3.8/5.0
- Condition / age +2.0/5.0
- Appreciation +0.0/10.0
$197,000
🖨 Deal sheet (PDF) 📄 Offer letter ✓ Due diligence
Listing remarks MLS
NEUTRAL DECOR IN THIS 2ND FLOOR UNIT W/ CANVAS COVERED PATIO. THIS LOCATION DOES NOT BACK UP TO THE BUSY STREET MAKING THE BALCONY A PERFECT RESPITE FROM A BUSY DAY. FULLY WHITE APPLIANCED KIT. W/ NEWER CERAMIC FLOOR. BATH OFFERS NEWER CERAMIC FLOOR & NEWER MIRRORS & VANITY TOP. GREAT AMENITIES & CONVENIENT AREA.
Key facts
- Brand-new cabinets
- Oakbrook condominium
- Listed 15 days
Tags
Neighborhood map
What this means for you Summary
Snapshot
- This is a 2-bed/1.0-bath condo listed at $197k. Condition is rated fair.
Deal economics
- At list price, monthly cash flow is $249 ($3k/yr) — positive.
- The deal already cash-flows at list — no discount required.
- Meets the 1% rule at list price ($2k rent vs $197k).
- Recommended offer: $194k (1.5% below list) — sets the bar for market timing.
- Cap rate 7.8% vs local median 3.5% in Williamsville — top-decile yield for the area; either an underpriced asset or a hidden risk that comps aren't pricing in. Stress-test before assuming the spread holds.
Location & tenants
- Location reads 84/100 on livability (#44 in NY, #693 nationally) — a professional / high-income tenant draw. Strengths: schools A+, commute A+, employment A+.
- Williamsville Central School District (suburban): math 64% / reading 77% proficiency, ranked #114 of 590 in NY (top 19%) — strong family-tenant draw, lease renewals of 3-5y typical; only 10% free/reduced lunch — higher-income household profile.
- Market conditions: Rents rising fast (+5.0%/yr); 334 active listings in the ZIP; 4 comparable units currently listed for rent nearby; rentals leasing fast (median 3d on market — plan ~1-2 weeks tenant-placement turnaround); solid renter incomes; 1,244 units permitted in Erie County in 2024 (563 in 5+ unit buildings).
Forward outlook
- Local home prices are declining (-3.0%/yr); year-one equity from $1k of loan paydown is wiped out by about $6k of value loss. Plan a longer hold.
Negotiation context
- It's been on market 16 days — a 2% lower offer ($194k) is reasonable based on typical stale-listing flexibility.
- 2 sale attempts since 25y ago with the ask held roughly flat each time — persistent listings suggest the price (not the market) is what's stuck; bring a comps-based counter.
- Current owner paid $45k; list at $197k implies a 339% gain — meaningful room to come down on a strong offer.
Questions for the listing agent
- Have any recent inspections been done? Can we get a copy of the seller's disclosures and any deferred-maintenance estimates?
- Any open or pending special assessments — roof, HVAC, plumbing, elevator, façade? What's the per-unit balance and payoff schedule, and is the seller paying it off at close or rolling it to the buyer?
- Is there a deadline driving the sale (1031 exchange, divorce, estate, relocation)? That informs how much negotiation room exists.
- Schools are A-rated — typically a magnet for longer-tenancy family renters. What's the average tenant stay here, and is there a school-zone premium baked into asking?
- What's the average days-on-market for RENTAL listings here right now (not sales)? A rising rental-DOM trend means longer vacancies and softer asking-rent achievability than the comps imply.
- What's the recent tenant-quality profile in this submarket — average credit score on applications, eviction rate, late-payment / NSF rate, and stable-employment percentage? A property-management company in the area should have these aggregated.
- How much new apartment / multifamily construction is in the pipeline within 1–3 miles? Heavy new supply (>2% of stock underway) typically softens rents 12–24 months out; light construction supports rent growth.
Investment metrics
- 1% rule
- 1.03% ✓
- Cap rate
- 7.81%
- Cash-on-cash
- 5.41%
- DSCR
- 1.24
- GRM
- 8.1
CMA / ARV
No comps found within radius.
Projected returns pro-forma
-3.0% appreciation · 5.01% rent growth · sell at horizon
- IRR
- -5.7%
- Equity multiple
- 0.78×
- Total profit
- $-11,860
- Equity at exit
- $29,373
- IRR
- 6.3%
- Equity multiple
- 1.51×
- Total profit
- $28,154
- Equity at exit
- $17,033
Cash invested: $55,160 (down + closing). Projections, not guarantees.
Landlord ↔ Tenant lean methodology
- Overall (STATE)
- 15 Strongly Tenant-Friendly
- State New York
- 15 Strongly Tenant-Friendly · D+10
- County
- — inherits STATE
- City
- — inherits STATE
ZIP-level market 14221
- Rents YoY
- 5.0%
- Active inventory
- 334
- Price-to-rent
- 8.1×
Monthly cashflow live
- Estimated rent
- $2,038 medium interval (Pro) →
- Mortgage (P&I)
- −$1,033
- Tax est. 1.5%
- −$246 /mo · $2,955/yr
- Insurance
- −$82
- HOA
- −$0
- Vacancy / Maint / Mgmt
- −$428
- Net cashflow
- $249
Break-even live
Sensitivity live
| Price | -10% $385 | -5% $317 | +0% $249 | +5% $180 | +10% $112 |
|---|---|---|---|---|---|
| Rent | -10% $88 | -5% $168 | +0% $249 | +5% $329 | +10% $410 |
| Rate | -1.0pp $348 | -0.5pp $299 | base $249 | +0.5pp $197 | +1.0pp $146 |
UW: 25.0% down · 7.5% · 30yr · 1.5% tax · 5.0% vac · 8.0% maint · 8.0% mgmt
Financing live
Cash to close
- Down payment
- $49,250
- Closing costs
- $5,910
- Reserves months
- —
- Total cash needed
- —
Loan-product check · same deal, 3 products live
Conventional
25% down · 7.5% · 30yr
- Down + closing
- —
- Monthly P&I
- —
- Monthly cashflow
- —
- DSCR
- —
- Eligible?
- —
Personal DTI + credit; lowest rate.
DSCR
20% down · 8.5% · 30yr
- Down + closing
- —
- Monthly P&I
- —
- Monthly cashflow
- —
- DSCR
- —
- Eligible?
- —
No personal income docs; deal must DSCR.
Hard money
10% down · 12.0% · 12mo
- Down + closing
- —
- Monthly P&I
- —
- Monthly cashflow
- —
- DSCR
- —
- Eligible?
- —
Short-term bridge; refi at stabilization.
Rent comps 4 comps
| Address | Beds | Baths | Sqft | Rent | $/sqft | DOM | Units | Dist |
|---|---|---|---|---|---|---|---|---|
| 990 Hopkins Rd Unit G Buffalo, NY | 2.0 | 2.0 | 1100 | $2,200 | $2.00 | 12d | 1 | 0.91mi |
| 1325 N Forest Rd Buffalo, NY | 1.0–3.0 | 1.0 | 870 | $1,748 | $2.01 | 3d | 9 | 1.04mi |
| 23 Northwood Dr Buffalo, NY | 1.0–2.0 | 1.0–2.0 | 800 | $2,145 | $2.68 | 3d | 1 | 1.45mi |
| 255 Evans St Williamsville, NY | 1.0–2.0 | 1.0–2.0 | 975 | $2,350 | $2.41 | 3d | 13 | 1.45mi |
HOA detail condo
- Monthly dues
- $0 · $0/yr
- Assessments
- None detected in remarks — confirm with the listing agent.
Listing history 11 events
-
2026-06-21days on market $197,000 Active 16 DOM
-
2026-06-18days on market $197,000 Active 13 DOM
-
2026-06-17days on market $197,000 Active 12 DOM
-
2026-06-16days on market $197,000 Active 11 DOM
-
2026-06-15days on market $197,000 Active 10 DOM
-
2026-06-13days on market $197,000 Active 8 DOM
-
2026-06-10days on market $197,000 Active 5 DOM
-
2026-06-09days on market $197,000 Active 4 DOM
-
2026-06-08days on market $197,000 Active 3 DOM
-
2026-06-07remarks 695-char remark
-
2026-06-07$197,000 Active 2 DOM
ⓘ Source: listings_history table (triggers on properties + properties_extension) + one-shot
backfill from property_details.listing_events for pre-trigger history.
Climate risk First Street
- Flood 1/10 Low FEMA zone X (unshaded) · 0% chance over 30 yrs
- Wildfire 1/10 Low
- Heat 3/10 Moderate 7 d/yr ≥94°F today · 15 d/yr by 30 yrs out
- Wind 1/10 Low
- Air quality 2/10 Low 2 unhealthy d/yr today · 2 by 30 yrs out
Nearby sold comps map
Loading sold comps map…
Walkable amenities ~0.75 mi
Loading nearby amenities…
Taxation est. · year 1
- Rental income
- $24,455
- − Mortgage interest
- −$11,035
- − Property taxes
- −$2,955
- − Insurance
- −$985
- − Repairs & maintenance
- −$1,956
- − Management
- −$1,956
- − Depreciation
- −$5,731
- Taxable loss
- −$164
- Est. tax savings @ 24.0%
- +$39
- After-tax cash flow
- $3,022/yr
For passive investors: Depreciation is non-cash, so a rental often shows a tax loss while cash-flowing — sheltering income. Rental losses are passive: they offset passive income freely, and up to $25,000/yr can offset ordinary (W-2) income if you actively participate and your MAGI is under $100k (phasing out to $0 by $150k); unused losses carry forward. On sale, claimed depreciation is recaptured at up to 25%, and gains may owe capital-gains tax (a 1031 exchange can defer both). Figures are a year-1 estimate at your 24.0% rate — not tax advice; consult a CPA.
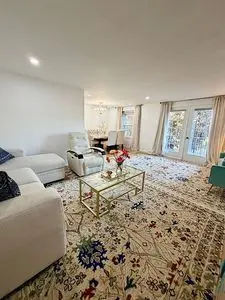
Condition & rehab AI · 1 photo
This move-in ready condo is in fair condition with good updates, but a fresh coat of paint and some minor updates could significantly enhance its value.
Value-add opportunities
- Both Painting — Fresh paint enhances curb appeal and interior aesthetics
- Both New flooring — Hardwood flooring is durable and adds value
- Both New window treatments — Updated window treatments improve curb appeal and natural light
- Both New lighting fixtures — Modern lighting fixtures enhance the home's ambiance and value
- Both New carpet or rug — A new carpet or rug can improve comfort and aesthetics
- Both New curtains — New curtains can enhance the home's curb appeal and interior aesthetics
Renovation cost estimate screening
Value-add ROI direction
- Both Painting — Fresh paint enhances curb appeal and interior aesthetics ↑
- Both New flooring — Hardwood flooring is durable and adds value ↑
- Both New window treatments — Updated window treatments improve curb appeal and natural light ↑
- Both New lighting fixtures — Modern lighting fixtures enhance the home's ambiance and value ↑
- Both New carpet or rug — A new carpet or rug can improve comfort and aesthetics ↑
- Both New curtains — New curtains can enhance the home's curb appeal and interior aesthetics ↑
ⓘ Cost ranges are severity-bucket heuristics (US national rule-of-thumb). Get contractor quotes + a written scope before underwriting a rehab budget.
Schools (NCES district)
- District
- Williamsville Central School District
- NCES district ID
- 3631470
- Math proficiency
- 64% ▼ -14.00%
- Reading proficiency
- 77% ▲ 6.00%
- Median HH income
- $79,907
- Composite
- 62.59/100
- National rank
- #678
- State rank
- #114 of 590 in NY
Livability — Williamsville
- Score
- 84/100
- State rank
- #44
- US rank
- #693
Category grades
Schools grade is shown separately in the Schools card above.
Census & demographics
- County
- Erie County · 714,559 people
- City population
- 55,255
- Metro
- Buffalo-Cheektowaga, NY
- Population (ZIP)
- 55,255
- Household income
- $101,615
- Rent vs Own
- Severe rent burden
- 1956.0
Population outlook (Erie County) Hauer SSP2
- Today (2025)
- 933,037 people
- By 2030
- 935,181 · +0.2%
- By 2040
- 928,531 · -0.5%
- By 2050
- 905,725 · -2.9%
- By 2075
- 834,037 · -10.6%
- By 2100
- 708,033 · -24.1%
Race, ethnicity, and origin ACS 2023
- Neighborhood character
- Predominantly White (84%)
- Race & ethnicity
- White 84% Asian 8% Two or more races 4% Hispanic / Latino 3% Black 2%
- Common ancestry
- Romanian 15% Lithuanian 2% Slovak 2%
- Foreign-born
- 10% · Canada, China, South Korea
- Languages at home
- 88% English-only · Other Indo-European 3% Other Asian/Pacific 2% Spanish 2%
Political lean MEDSL · Erie
- 2024 margin
- Lean D (+9.7) · D 54.8% · R 45.2%
- 2008→2024 swing
- -7.9pp toward R · 2008: 17.5pp · 2024: 9.7pp
- All cycles
- 2024: D+9.7 2020: D+14.7 2016: D+4.8 2012: D+15.6 2008: D+17.5
Not yet ingested
- Civics
- —
Market trends
- HPI YoY
- ▼ -301.37%
- Current HPI
- 322.6947
- Rent YoY
- ▲ 5.01%
- Metro
- Buffalo-Cheektowaga, NY
- State GDP YoY
- ▲ 2.60%
- F500 in state
- 92
Industry mix (Fortune 500 HQ in NY)
| Industry | F500 HQs | Revenue |
|---|---|---|
| Financial Services | 10 | $950B |
|
||
| Consumer Goods | 9 | $162B |
|
||
| Insurance | 4 | $225B |
|
||
| Telecommunications | 2 | $144B |
|
||
| Pharmaceuticals | 2 | $112B |
|
||
| Media / Entertainment | 2 | $69B |
|
||
Price history
+302.9% since first listed3 events — show timeline
- 2026-06-06 Listed $197,000 FSBO.com
- 2001-05-23 Sold (MLS) $44,900 WNYREIS
- 2001-02-28 Listed $48,900 WNYREIS
Cash-flow waterfall
monthlySold comps — $/sqft
last 12 mo · ≤1 miLoading sold comps…