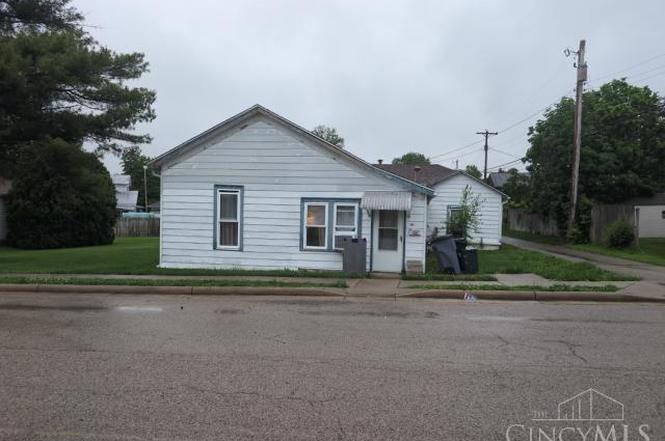
101 California St · Farmersville, OH
Flood risk 1/10 · Minimal
- FEMA flood zone
- X (unshaded)
- Chance of flooding over 30 yrs
- 0.0%
- Est. flood insurance / yr
- $507 – $1,088
Fire risk 1/10 · Minimal
- Est. fire insurance / yr
- $713 – $1,323
Heat risk 4/10 · Minor
- Hot days now (above 101°F)
- 7 days/yr
- Hot days in 30 yrs
- 19 days/yr
Wind risk 2/10 · Minimal
- Chance of severe wind over 30 yrs
- 1.0%
Air-quality risk 2/10 · Minimal
- Unhealthy air days now
- 1 days/yr
- Unhealthy air days in 30 yrs
- 2 days/yr
Risk factors via First Street. Map © Google.
Why this score? — see what drove the D+ grade
The composite is a weighted blend of 9 inputs, each scored 0–100. Each bar is that input's sub-score; the figure is the points it added to the 100-point composite (weight × sub-score).
- Cash flow +15.0/30.0
- ARV discount +7.5/15.0
- Schools +5.3/10.0
- 1% rule +5.0/10.0
- DSCR +5.0/10.0
- Livability +3.7/5.0
- Rent growth +2.5/5.0
- Condition / age +2.5/5.0
- Appreciation +0.0/10.0
$1
🖨 Deal sheet 📄 Offer letter ✓ Due diligence
Listing remarks MLS
Investment opportunity in Farmersville/Valley View SD! Everything is on one floor. Walking distance to VV Middle School. Extra wide lot. In need of rehab. Kitchen is currently gutted. Cash offers only.
Key facts
- 7,871 sq ft lot
- Garage
- Built 1919
Property features AI
Finance
- Other: Lot size about 0.1807 acres (7,871 sq ft)
- Financial info: Auction: Yes; Lease considered: No
- HOA & community: No HOA
Exterior
- Parking: Attached garage with 1 garage space
- Utilities: Public water; Public sewer; Natural gas
- Home design: Craftsman/Bungalow style single-family home; One level
- Construction: Poured foundation
- Exterior features: Shingle roof; Aluminum siding; Windows: Other
Interior
- Kitchen: Kitchen approximately 9 x 9
- Bedrooms: Three bedrooms total; Primary bedroom approximately 10 x 10 (on main level); Second bedroom approximately 9 x 9 (on main level); Third bedroom approximately 9 x 9 (on main level)
- Bathrooms: One full bathroom on main level with shower
- Heating & cooling: Forced air heating; Water heating: Other
- Interior features: Six total rooms; Crawl basement
Neighborhood map
What this means for you Summary
Snapshot
- This is a 3-bed/1.0-bath single-family listed at $1.
Deal economics
- At list price, monthly cash flow is $1k ($13k/yr) — positive.
- The deal already cash-flows at list — no discount required.
- Meets the 1% rule at list price ($1k rent vs $1).
Location & tenants
- Location reads 74/100 on livability (#275 in OH, #4,528 nationally) — a middle-class / working-renter tenant base. Strengths: crime A+, cost of living A+, housing A+; Watch: amenities F, commute F, health & safety F.
- Valley View Local (suburban): math 54% / reading 69% proficiency, ranked #250 of 656 in OH (top 38%) — acceptable for families but not a draw, mixed tenant base, ~2y average lease.
- Market conditions: 15 active listings in the ZIP; solid renter incomes; 907 units permitted in Montgomery County in 2024 (416 in 5+ unit buildings).
Forward outlook
- Local home prices are declining (-3.0%/yr); year-one equity from $0 of loan paydown is wiped out by about $0 of value loss. Plan a longer hold.
- Montgomery County population projected at -10% by 2050 — secular population decline; favor cash flow + early exit over multi-decade hold.
- At projected returns (-3.0% appreciation + 3.0% rent growth), your $0 cash investment doubles in ~1 year — after that, you're playing with house money.
Negotiation context
- Only 3 days on market — expect competitive offers; lowballing is unlikely to land.
- 2 sale attempts since 4y ago with the ask held roughly flat each time — persistent listings suggest the price (not the market) is what's stuck; bring a comps-based counter.
Risks & watch-outs
- Watch-outs: built in 1919 — expect roof / HVAC / electrical / plumbing capex.
Questions for the listing agent
- Built in 1919 — when were the roof, HVAC, electrical panel, plumbing, and water heater last replaced?
- Is there a deadline driving the sale (1031 exchange, divorce, estate, relocation)? That informs how much negotiation room exists.
- Schools are A-rated — typically a magnet for longer-tenancy family renters. What's the average tenant stay here, and is there a school-zone premium baked into asking?
- The area grade is low — what's the realistic commute time and amenity access for the typical tenant pool here? Any planned neighborhood developments (good or bad) we should know about?
- What's the average days-on-market for RENTAL listings here right now (not sales)? A rising rental-DOM trend means longer vacancies and softer asking-rent achievability than the comps imply.
- What's the recent tenant-quality profile in this submarket — average credit score on applications, eviction rate, late-payment / NSF rate, and stable-employment percentage? A property-management company in the area should have these aggregated.
- How much new for-sale + rental construction is in the pipeline within 1–3 miles? Heavy new supply typically softens prices + rents 12–24 months out; constrained supply supports both.
Investment metrics
- 1% rule
- 137010.00% ✓
- Cap rate
- 1298852.80%
- Cash-on-cash
- 4638737.53%
- DSCR
- 206398.72
- GRM
- 0.0
CMA / ARV
- ARV (on-the-fly)
- $224,352
- Comps found
- 8
Show comp detail 8 sales within ~0.75 mi
| Address | Dist | Beds/Ba | Sqft | Sold | Price | $/sf | Match |
|---|---|---|---|---|---|---|---|
| 40 Iris Ave | 0.09mi | 3/2.0 | 1,388 (-6%) | 6mo | $211,000 | $152 | 76 |
| 53 Maple St | 0.12mi | 4/1.0 (+1) | 1,431 (-3%) | 10mo | $225,000 | $157 | 76 |
| 54 Apple Dr | 0.22mi | 3/2.0 | 1,596 (+8%) | 2mo | $259,900 | $163 | 70 |
| 57 Apple Dr | 0.18mi | 3/1.0 | 1,276 (-14%) | 6mo | $191,000 | $150 | 64 |
| 120 E Center St | 0.31mi | 2/2.0 (-1) | 1,408 (-5%) | 9mo | $200,000 | $142 | 62 |
| 307 W Walnut St | 0.08mi | 3/1.0 | 1,256 (-15%) | 12mo | $185,000 | $147 | 61 |
| 52 Maple St | 0.16mi | 3/2.0 | 1,692 (+15%) | 22mo | $165,000 | $98 | 46 |
| 76 Meadowgate Ct | 0.43mi | 4/2.5 (+1) | 1,640 (+11%) | 10mo | $320,000 | $195 | 42 |
Match score weights: distance 35% · size 25% · config 20% · recency 20%. Top-matched comps best support the ARV.
Projected returns pro-forma
-3.0% appreciation · 3.0% rent growth · sell at horizon
- IRR
- —
- Equity multiple
- 246277.30×
- Total profit
- $68,957
- Equity at exit
- $0
- IRR
- —
- Equity multiple
- 531779.77×
- Total profit
- $148,898
- Equity at exit
- $0
Cash invested: $0 (down + closing). Projections, not guarantees.
Landlord ↔ Tenant lean methodology
- Overall (STATE)
- 73 Landlord-Friendly
- State Ohio
- 73 Landlord-Friendly · R+6
- County
- — inherits STATE
- City
- — inherits STATE
ZIP-level market 45325
- Home prices YoY
- -29.0%
- Active inventory
- 15
Monthly cashflow live
- Estimated rent
- $1,370 medium interval (Pro) →
- Mortgage (P&I)
- −$0
- Tax est. 1.5%
- −$0 /mo · $0/yr
- Insurance
- −$0
- HOA
- −$0
- Vacancy / Maint / Mgmt
- −$288
- Net cashflow
- $1,082
Break-even live
UW: 25.0% down · 7.5% · 30yr · 1.5% tax · 5.0% vac · 8.0% maint · 8.0% mgmt
Financing live
Cash to close
- Down payment
- $0
- Closing costs
- $0
- Reserves months
- —
- Total cash needed
- —
Loan-product check · same deal, 3 products live
Conventional
25% down · 7.5% · 30yr
- Down + closing
- —
- Monthly P&I
- —
- Monthly cashflow
- —
- DSCR
- —
- Eligible?
- —
Personal DTI + credit; lowest rate.
DSCR
20% down · 8.5% · 30yr
- Down + closing
- —
- Monthly P&I
- —
- Monthly cashflow
- —
- DSCR
- —
- Eligible?
- —
No personal income docs; deal must DSCR.
Hard money
10% down · 12.0% · 12mo
- Down + closing
- —
- Monthly P&I
- —
- Monthly cashflow
- —
- DSCR
- —
- Eligible?
- —
Short-term bridge; refi at stabilization.
Listing history 4 events
-
2026-06-18days on market $1 Active 3 DOM
-
2026-06-17days on market $1 Active 2 DOM
-
2026-06-16remarks 392-char remark
-
2026-06-16$1 Active 1 DOM
ⓘ Source: listings_history table (triggers on properties + properties_extension) + one-shot
backfill from property_details.listing_events for pre-trigger history.
Climate risk First Street
- Flood 1/10 Low FEMA zone X (unshaded) · 0% chance over 30 yrs
- Wildfire 1/10 Low
- Heat 4/10 Moderate 7 d/yr ≥101°F today · 19 d/yr by 30 yrs out
- Wind 2/10 Low 100% chance of damaging wind over 30 yrs
- Air quality 2/10 Low 1 unhealthy d/yr today · 2 by 30 yrs out
Nearby sold comps map
Loading sold comps map…
Walkable amenities ~0.75 mi
Loading nearby amenities…
Taxation est. · year 1
- Rental income
- $16,441
- − Mortgage interest
- −$0
- − Property taxes
- −$0
- − Insurance
- −$0
- − Repairs & maintenance
- −$1,315
- − Management
- −$1,315
- − Depreciation
- −$0
- Taxable income
- $13,811
- Est. tax owed @ 24.0%
- −$3,315
- After-tax cash flow
- $9,674/yr
For passive investors: Depreciation is non-cash, so a rental often shows a tax loss while cash-flowing — sheltering income. Rental losses are passive: they offset passive income freely, and up to $25,000/yr can offset ordinary (W-2) income if you actively participate and your MAGI is under $100k (phasing out to $0 by $150k); unused losses carry forward. On sale, claimed depreciation is recaptured at up to 25%, and gains may owe capital-gains tax (a 1031 exchange can defer both). Figures are a year-1 estimate at your 24.0% rate — not tax advice; consult a CPA.
Schools (NCES district)
- District
- Valley View Local
- NCES district ID
- 3904874
- Math proficiency
- 54% ▼ -17.00%
- Reading proficiency
- 69% ▼ -7.00%
- Median HH income
- $60,457
- Composite
- 53.26/100
- National rank
- #1495
- State rank
- #250 of 656 in OH
Livability — Farmersville
- Score
- 74/100
- State rank
- #275
- US rank
- #4528
Category grades
Schools grade is shown separately in the Schools card above.
Census & demographics
- Census place
- Farmersville, OH
- County
- Montgomery · 506,435 people
- Metro
- Dayton-Kettering-Beavercreek, OH
- Population (ZIP)
- 2,746
- Household income
- $79,688
- Rent vs Own
- Severe rent burden
- 3.3
Population outlook (Montgomery County) Hauer SSP2
- Today (2025)
- 523,241 people
- By 2030
- 514,948 · -1.6%
- By 2040
- 493,378 · -5.7%
- By 2050
- 469,639 · -10.2%
- By 2075
- 418,360 · -20.0%
- By 2100
- 353,315 · -32.5%
Race, ethnicity, and origin ACS 2023
- Neighborhood character
- Predominantly White (97%)
- Race & ethnicity
- White 97% Two or more races 3%
- Common ancestry
- Slovak 4% Italian 3% Lithuanian 2%
- Foreign-born
- 0%
Political lean MEDSL · Montgomery
- 2024 margin
- Toss-up / Even · D 49.8% · R 49.3%
- 2008→2024 swing
- -5.8pp toward R · 2008: 6.2pp · 2024: 0.5pp
- All cycles
- 2024: D+0.5 2020: D+2.2 2016: R+1.2 2012: D+3.1 2008: D+6.2
Not yet ingested
- Civics
- —
Market trends
- HPI YoY
- ▼ -93.25%
- Current HPI
- 228.4052
- Rent YoY
- —
- Metro
- —
- State GDP YoY
- ▲ 1.98%
- F500 in state
- 48
Industry mix (Fortune 500 HQ in OH)
| Industry | F500 HQs | Revenue |
|---|---|---|
| Insurance | 3 | $145B |
|
||
| Industrial Machinery | 3 | $49B |
|
||
| Financial Services | 3 | $24B |
|
||
| Consumer Goods | 2 | $93B |
|
||
| Aerospace / Defense | 2 | $47B |
|
||
| Utilities | 2 | $33B |
|
||
Price history
-14.8% since first listed5 events — show timeline
- 2026-06-15 Listed $1 Cincy MLS
- 2022-08-12 Sold (MLS) $42,500 Dayton MLS
- 2022-08-12 Sold (MLS) $42,500 Dayton MLS
- 2022-07-18 Pending — Dayton MLS
- 2022-07-14 Listed $49,900 Dayton MLS
Property tax history
+5.0%/yrLatest (2025): $2,583 · -0.1% YoY. Source: county tax records.
Cash-flow waterfall
monthlySold comps — $/sqft
last 12 mo · ≤1 miLoading sold comps…