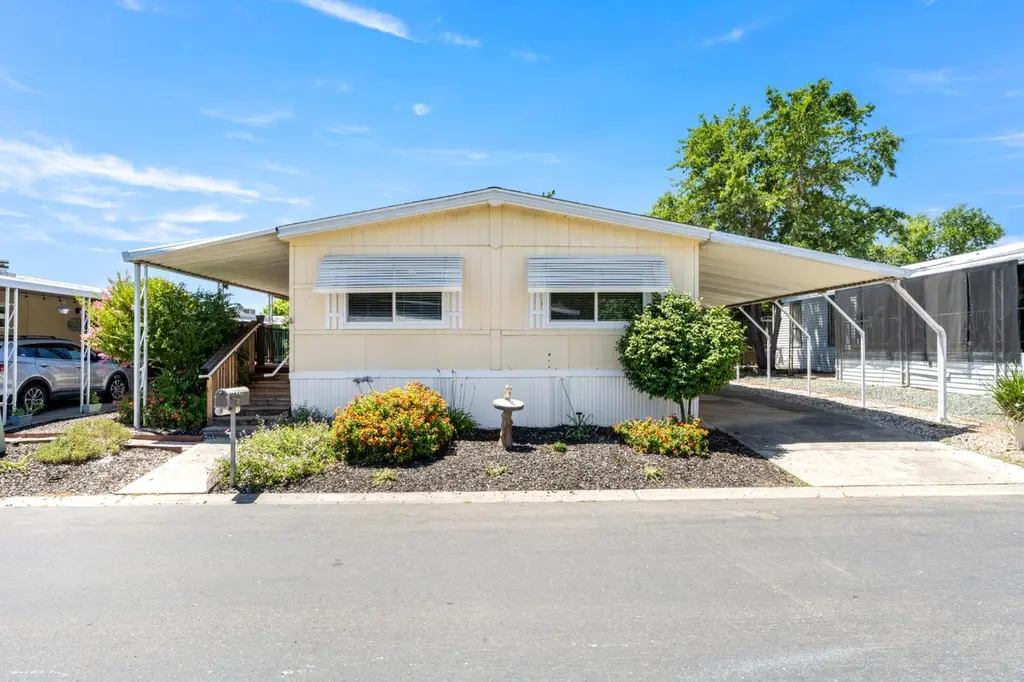
220 Pau Hana Cir · Citrus Heights, CA
Flood risk 4/10 · Minor
- FEMA flood zone
- X (unshaded)
- Chance of flooding over 30 yrs
- 0.2%
- Est. flood insurance / yr
- $507 – $1,088
Fire risk 3/10 · Minor
- Est. fire insurance / yr
- $659 – $1,223
Heat risk 7/10 · Major
- Hot days now (above 103°F)
- 7 days/yr
- Hot days in 30 yrs
- 15 days/yr
Wind risk 1/10 · Minimal
- Chance of severe wind over 30 yrs
- —
Air-quality risk 10/10 · Severe
- Unhealthy air days now
- 34 days/yr
- Unhealthy air days in 30 yrs
- 36 days/yr
Risk factors via First Street. Map © Google.
Why this score? — see what drove the B grade
The composite is a weighted blend of 9 inputs, each scored 0–100. Each bar is that input's sub-score; the figure is the points it added to the 100-point composite (weight × sub-score).
- Cash flow +30.0/30.0
- DSCR +10.0/10.0
- 1% rule +9.9/10.0
- ARV discount +7.5/15.0
- Schools +4.4/10.0
- Rent growth +3.0/5.0
- Livability +3.0/5.0
- Condition / age +2.5/5.0
- Appreciation +0.0/10.0
$145,000
🖨 Deal sheet 📄 Offer letter ✓ Due diligence
Listing remarks
Beautifully updated with open floor plan, laminate flooring throughout. Kitchen has shaker cabinetry with granite counter tops and stainless-steel appliances. Fresh paint interior. Nice deck with awning for your enjoyment. Roof replaced in 2023, HVAC 21-22.Stonegate 55 plus community with clubhouse, pool and game room.
Key facts
- Open floor plan
- Nice deck
- Shaker cabinetry
Tags
Property features AI
Finance
- HOA & community: No homeowners association; Located in a senior community; Land lease: No (land lease amount listed separately)
Exterior
- Parking: Covered parking; Guest parking available
- Utilities: Public water; Public sewer; Natural gas connected and gas plumbed; Internet available; 220 volts in kitchen and laundry
- Home design: Manufactured home (double wide) located in a park; Updated/remodeled; Made by Champion (90003 Champion); Metal skirting; Built in 1983
- Construction: Composition roof
- Exterior features: Carport awning and porch awning; Backyard with landscaping; Shed(s) for additional storage
Interior
- Kitchen: Island; Built-in electric range; Free-standing electric range; Free-standing refrigerator; Dishwasher; Microwave; Garbage disposal
- Bedrooms: 3 bedrooms (includes a master bedroom)
- Flooring: Laminate flooring; Tile flooring
- Bathrooms: 2 full bathrooms; Bathrooms include tub with shower over and separate shower stall(s)
- Heating & cooling: Central heating; Central cooling
- Interior features: Porch steps and a covered, railed deck; Dual-pane windows with window coverings; Storage area (exterior shed)
- Laundry & utility: Washer and dryer included; Laundry in interior (electric hook-up)
Neighborhood map
What this means for you Summary
Snapshot
- This is a 3-bed/2.0-bath manufactured listed at $145k.
Deal economics
- At list price, monthly cash flow is $710 ($9k/yr) — positive.
- The deal already cash-flows at list — no discount required.
- Meets the 1% rule at list price ($2k rent vs $145k).
- Cap rate 12.2% vs local median 3.4% in Citrus Heights — top-decile yield for the area; either an underpriced asset or a hidden risk that comps aren't pricing in. Stress-test before assuming the spread holds.
Location & tenants
- Location reads 60/100 on livability (#614 in CA) — a middle-class / working-renter tenant base. Strengths: housing A+; Watch: schools D, crime D-, amenities F.
- San Juan Unified (suburban): math 40% / reading 62% proficiency, ranked #138 of 517 in CA (top 27%) — acceptable for families but not a draw, mixed tenant base, ~2y average lease.
- Market conditions: Rents rising (+1.9%/yr); 210 active listings in the ZIP; 21 comparable units currently listed for rent nearby; rentals leasing fast (median 4d on market — plan ~1-2 weeks tenant-placement turnaround); solid renter incomes; 6,825 units permitted in Sacramento County in 2024 (1,752 in 5+ unit buildings).
- This rent runs 32% of the median local income ($81k/yr) — at the standard rent-burdened threshold; future hikes will face affordability resistance.
Forward outlook
- Local home prices are declining (-3.0%/yr); year-one equity from $1k of loan paydown is wiped out by about $4k of value loss. Plan a longer hold.
- Sacramento County population projected at +17% by 2050 — long-run rental-demand tailwind backs the buy-and-hold thesis.
- At projected returns (-3.0% appreciation + 1.9% rent growth), your $41k cash investment doubles in ~7 years — after that, you're playing with house money.
Negotiation context
- Only 11 days on market — expect competitive offers; lowballing is unlikely to land.
Risks & watch-outs
- Climate carrying-cost: extreme-heat days projected 7→15/yr by 2055 (HVAC capex compounding) — expect insurance premiums to compound above CPI over the hold.
Questions for the listing agent
- Is there a deadline driving the sale (1031 exchange, divorce, estate, relocation)? That informs how much negotiation room exists.
- Schools are D-rated, which usually means shorter tenancies and higher turnover. Who's the typical renter profile here, and what's been the actual vacancy rate?
- Crime grade is D in this area — have there been break-ins, vandalism, or insurance claims at this property in the last 3 years? What carrier currently insures it and at what premium?
- What's the average days-on-market for RENTAL listings here right now (not sales)? A rising rental-DOM trend means longer vacancies and softer asking-rent achievability than the comps imply.
- What's the recent tenant-quality profile in this submarket — average credit score on applications, eviction rate, late-payment / NSF rate, and stable-employment percentage? A property-management company in the area should have these aggregated.
- How much new for-sale + rental construction is in the pipeline within 1–3 miles? Heavy new supply typically softens prices + rents 12–24 months out; constrained supply supports both.
Investment metrics
- 1% rule
- 1.49% ✓
- Cap rate
- 12.17%
- Cash-on-cash
- 20.98%
- DSCR
- 1.93
- GRM
- 5.6
CMA / ARV
- ARV (on-the-fly)
- $79,296
- Comps found
- 12
Show comp detail 12 sales within ~0.75 mi
| Address | Dist | Beds/Ba | Sqft | Sold | Price | $/sf | Match |
|---|---|---|---|---|---|---|---|
| 206 Pau Hana Cir | 0.06mi | 2/2.0 (-1) | 1,344 (0%) | 7mo | $130,000 | $97 | 86 |
| 256 Corto Ln | 0.05mi | 2/2.0 (-1) | 1,368 (+2%) | 8mo | $75,000 | $55 | 83 |
| 258 Corto Ln | 0.04mi | 2/2.0 (-1) | 1,344 (0%) | 14mo | $85,000 | $63 | 81 |
| 209 Pau Hana Cir | 0.06mi | 2/2.0 (-1) | 1,344 (0%) | 17mo | $79,500 | $59 | 78 |
| 241 Pau Hana Cir | 0.11mi | 3/2.0 | 1,341 (-0%) | 21mo | $76,000 | $57 | 77 |
| 104 Cambria | 0.28mi | 2/2.0 (-1) | 1,290 (-4%) | 0mo | $119,900 | $93 | 75 |
| 250 Corto Ln | 0.07mi | 3/2.0 | 1,498 (+12%) | 11mo | $109,900 | $73 | 68 |
| 252 Corto Ln | 0.07mi | 3/2.0 | 1,440 (+7%) | 22mo | $62,500 | $43 | 67 |
| 266 Corto Ln #266 | 0.04mi | 2/2.0 (-1) | 1,528 (+14%) | 8mo | $37,500 | $25 | 64 |
| 190 Saxton Cir #190 | 0.11mi | 2/2.0 (-1) | 1,154 (-14%) | 11mo | $137,500 | $119 | 57 |
| 77 Cambria Cir | 0.39mi | 2/2.0 (-1) | 1,188 (-12%) | 8mo | $70,000 | $59 | 50 |
| 149 Chabot | 0.27mi | 2/2.0 (-1) | 1,200 (-11%) | 19mo | $62,000 | $52 | 49 |
Match score weights: distance 35% · size 25% · config 20% · recency 20%. Top-matched comps best support the ARV.
Projected returns pro-forma
-3.0% appreciation · 1.9% rent growth · sell at horizon
- IRR
- 12.2%
- Equity multiple
- 1.48×
- Total profit
- $19,382
- Equity at exit
- $21,620
- IRR
- 20.2%
- Equity multiple
- 2.62×
- Total profit
- $65,713
- Equity at exit
- $12,537
Cash invested: $40,600 (down + closing). Projections, not guarantees.
Landlord ↔ Tenant lean methodology
- Overall (STATE)
- 18 Strongly Tenant-Friendly
- State California
- 18 Strongly Tenant-Friendly · D+13
- County
- — inherits STATE
- City
- — inherits STATE
ZIP-level market 95621
- Rents YoY
- 1.9%
- Active inventory
- 210
- Price-to-rent
- 5.6×
Monthly cashflow live
- Estimated rent
- $2,167 high interval (Pro) →
- Mortgage (P&I)
- −$760
- Tax est. 1.5%
- −$181 /mo · $2,175/yr
- Insurance
- −$60
- HOA
- −$0
- Vacancy / Maint / Mgmt
- −$455
- Net cashflow
- $710
Break-even live
UW: 25.0% down · 7.5% · 30yr · 1.5% tax · 5.0% vac · 8.0% maint · 8.0% mgmt
Financing live
Cash to close
- Down payment
- $36,250
- Closing costs
- $4,350
- Reserves months
- —
- Total cash needed
- —
Loan-product check · same deal, 3 products live
Conventional
25% down · 7.5% · 30yr
- Down + closing
- —
- Monthly P&I
- —
- Monthly cashflow
- —
- DSCR
- —
- Eligible?
- —
Personal DTI + credit; lowest rate.
DSCR
20% down · 8.5% · 30yr
- Down + closing
- —
- Monthly P&I
- —
- Monthly cashflow
- —
- DSCR
- —
- Eligible?
- —
No personal income docs; deal must DSCR.
Hard money
10% down · 12.0% · 12mo
- Down + closing
- —
- Monthly P&I
- —
- Monthly cashflow
- —
- DSCR
- —
- Eligible?
- —
Short-term bridge; refi at stabilization.
Rent comps 21 comps
| Address | Beds | Baths | Sqft | Rent | $/sqft | DOM | Units | Dist |
|---|---|---|---|---|---|---|---|---|
| 6841 Castleberry Cir Citrus Heights, CA | 3.0 | 2.0 | 1162 | $2,300 | $1.98 | 4d | 1 | 0.38mi |
| 7434 Auburn Oaks Ct Citrus Heights, CA | 1.0–2.0 | 1.0 | 790 | $1,875 | $2.37 | 24d | 4 | 0.50mi |
| 7434 Auburn Oaks Ct Citrus Heights, CA | 2.0 | 1.0 | 890 | $1,975 | $2.22 | 3d | 1 | 0.50mi |
| 7445 Auburn Oaks Ct Unit K Citrus Heights, CA | 2.0 | 2.0 | 929 | $1,700 | $1.83 | 22d | 1 | 0.53mi |
| 7445 Auburn Oaks Ct Unit K Citrus Heights, CA | 2.0 | 2.0 | 929 | $1,695 | $1.82 | 44d | 1 | 0.53mi |
| 8077 Cornerstone Way Citrus Heights, CA | 4.0 | 2.0 | 1380 | $2,795 | $2.03 | 44d | 1 | 0.64mi |
| 7915 Zenith Dr Citrus Heights, CA | 2.0 | 1.0 | 1015 | $1,895 | $1.87 | 22d | 1 | 0.83mi |
| 7437 Antelope Rd Citrus Heights, CA | 2.0 | 2.5 | 1287 | $2,550 | $1.98 | 4d | 1 | 0.83mi |
| 7632 Van Maren Ln Unit 1 Citrus Heights, CA | 4.0 | 2.0 | 1300 | $2,495 | $1.92 | 15d | 1 | 0.91mi |
| 7603 Linden Ave Citrus Heights, CA | 2.0 | 1.5 | 990 | $1,900 | $1.92 | 18d | 1 | 0.92mi |
| 7827 Zenith Dr Citrus Heights, CA | 2.0 | 2.0 | 1031 | $1,995 | $1.94 | 15d | 1 | 0.93mi |
| 333 Cirby Way Roseville, CA | 1.0–2.0 | 1.0 | 796 | $2,115 | $2.66 | 2d | 4 | 0.97mi |
| 425 Cirby Way Roseville, CA | 1.0–2.0 | 1.0–2.0 | 812 | $2,274 | $2.80 | 2d | 1 | 1.04mi |
| 7761 Pompei Ct Unit 7763 Citrus Heights, CA | 2.0 | 1.0 | 900 | $1,705 | $1.89 | 24d | 1 | 1.10mi |
| 6413 Tupelo Dr Citrus Heights, CA | 1.0–2.0 | 1.0–2.0 | 775 | $2,000 | $2.58 | 2d | 10 | 1.11mi |
| 7658 Poppy Way Citrus Heights, CA | 2.0 | 1.0 | 900 | $1,785 | $1.98 | 15d | 1 | 1.15mi |
| 7658 Poppy Way Unit 7658 Citrus Heights, CA | 2.0 | 1.0 | 900 | $1,695 | $1.88 | 3d | 1 | 1.15mi |
| 3 Somer Ridge Dr Roseville, CA | 1.0–2.0 | 1.0–2.0 | 909 | $2,270 | $2.50 | 2d | 6 | 1.21mi |
| 7541 Ramona Ln Citrus Heights, CA | 1.0–2.0 | 1.0–2.0 | 837 | $2,295 | $2.74 | 2d | 9 | 1.38mi |
| 7139 Baranga Dr Citrus Heights, CA | 3.0 | 1.5 | 1162 | $2,500 | $2.15 | 2d | 1 | 1.43mi |
| 7135 Cobalt Way Citrus Heights, CA | 3.0 | 1.0 | 1200 | $1,995 | $1.66 | 4d | 1 | 1.47mi |
Listing history 9 events
-
2026-06-18days on market $145,000 Active 11 DOM
-
2026-06-17days on market $145,000 Active 10 DOM
-
2026-06-16days on market $145,000 Active 9 DOM
-
2026-06-15days on market $145,000 Active 8 DOM
-
2026-06-13days on market $145,000 Active 6 DOM
-
2026-06-13days on market $145,000 Active 5 DOM
-
2026-06-09days on market $145,000 Active 2 DOM
-
2026-06-08remarks 320-char remark
-
2026-06-08$145,000 Active 1 DOM
ⓘ Source: listings_history table (triggers on properties + properties_extension) + one-shot
backfill from property_details.listing_events for pre-trigger history.
Climate risk First Street
- Flood 4/10 Moderate FEMA zone X (unshaded) · 20% chance over 30 yrs
- Wildfire 3/10 Moderate
- Heat 7/10 Severe 7 d/yr ≥103°F today · 15 d/yr by 30 yrs out
- Wind 1/10 Low
- Air quality 10/10 Extreme 34 unhealthy d/yr today · 36 by 30 yrs out
Nearby sold comps map
Loading sold comps map…
Walkable amenities ~0.75 mi
Loading nearby amenities…
Taxation est. · year 1
- Rental income
- $26,005
- − Mortgage interest
- −$8,122
- − Property taxes
- −$2,175
- − Insurance
- −$725
- − Repairs & maintenance
- −$2,080
- − Management
- −$2,080
- − Depreciation
- −$4,218
- Taxable income
- $6,604
- Est. tax owed @ 24.0%
- −$1,585
- After-tax cash flow
- $6,935/yr
For passive investors: Depreciation is non-cash, so a rental often shows a tax loss while cash-flowing — sheltering income. Rental losses are passive: they offset passive income freely, and up to $25,000/yr can offset ordinary (W-2) income if you actively participate and your MAGI is under $100k (phasing out to $0 by $150k); unused losses carry forward. On sale, claimed depreciation is recaptured at up to 25%, and gains may owe capital-gains tax (a 1031 exchange can defer both). Figures are a year-1 estimate at your 24.0% rate — not tax advice; consult a CPA.
Schools (NCES district)
- District
- San Juan Unified
- NCES district ID
- 0634620
- Math proficiency
- 40% ▲ 3.00%
- Reading proficiency
- 62% ▲ 16.00%
- Median HH income
- $55,655
- Composite
- 44.07/100
- National rank
- #2878
- State rank
- #138 of 517 in CA
Livability — Citrus Heights
- Score
- 60/100
- State rank
- #614
- US rank
- #19580
Category grades
Schools grade is shown separately in the Schools card above.
Census & demographics
- Census place
- Citrus Heights, CA
- County
- Sacramento County · 1,539,646 people
- City population
- 89,370
- Metro
- Sacramento-Roseville-Folsom, CA
- Population (ZIP)
- 42,442
- Household income
- $80,901
- Rent vs Own
- Severe rent burden
- 1854.0
Population outlook (Sacramento County) Hauer SSP2
- Today (2025)
- 1,660,763 people
- By 2030
- 1,732,990 · +4.3%
- By 2040
- 1,855,755 · +11.7%
- By 2050
- 1,941,335 · +16.9%
- By 2075
- 2,046,162 · +23.2%
- By 2100
- 1,961,444 · +18.1%
Race, ethnicity, and origin ACS 2023
- Neighborhood character
- Predominantly White (66%)
- Race & ethnicity
- White 66% Hispanic / Latino 19% Two or more races 11% Asian 6% Black 2%
- Hispanic origin (detail)
- Mexican 16%
- Common ancestry
- Subsaharan African 3% Lithuanian 3% Scotch-Irish 2%
- Foreign-born
- 15% · Canada, Vietnam
- Languages at home
- 78% English-only · Spanish 10% Russian/Polish/Slavic 6% Other Indo-European 3%
Political lean MEDSL · Sacramento
- 2024 margin
- D (+19.7) · D 58.1% · R 38.4% · Other 3.5%
- 2008→2024 swing
- +0.7pp no change · 2008: 19.0pp · 2024: 19.7pp
- All cycles
- 2024: D+19.7 2020: D+25.3 2016: D+23.7 2012: D+16.3 2008: D+19.0
Not yet ingested
- Civics
- —
Market trends
- HPI YoY
- ▼ -408.14%
- Current HPI
- 351.9333
- Rent YoY
- ▲ 1.90%
- Metro
- Sacramento-Roseville-Folsom, CA
- State GDP YoY
- ▲ 3.21%
- F500 in state
- 116
Industry mix (Fortune 500 HQ in CA)
| Industry | F500 HQs | Revenue |
|---|---|---|
| Technology | 27 | $1,492B |
|
||
| Financial Services | 3 | $174B |
|
||
| Retail | 3 | $44B |
|
||
| Insurance | 3 | $26B |
|
||
| Media / Entertainment | 2 | $115B |
|
||
| Pharmaceuticals / Biotech | 2 | $62B |
|
||
Property tax history
+5.2%/yrLatest (2025): $265 · +11.2% YoY. Source: county tax records.
Cash-flow waterfall
monthlySold comps — $/sqft
last 12 mo · ≤1 miLoading sold comps…