 Fourplex
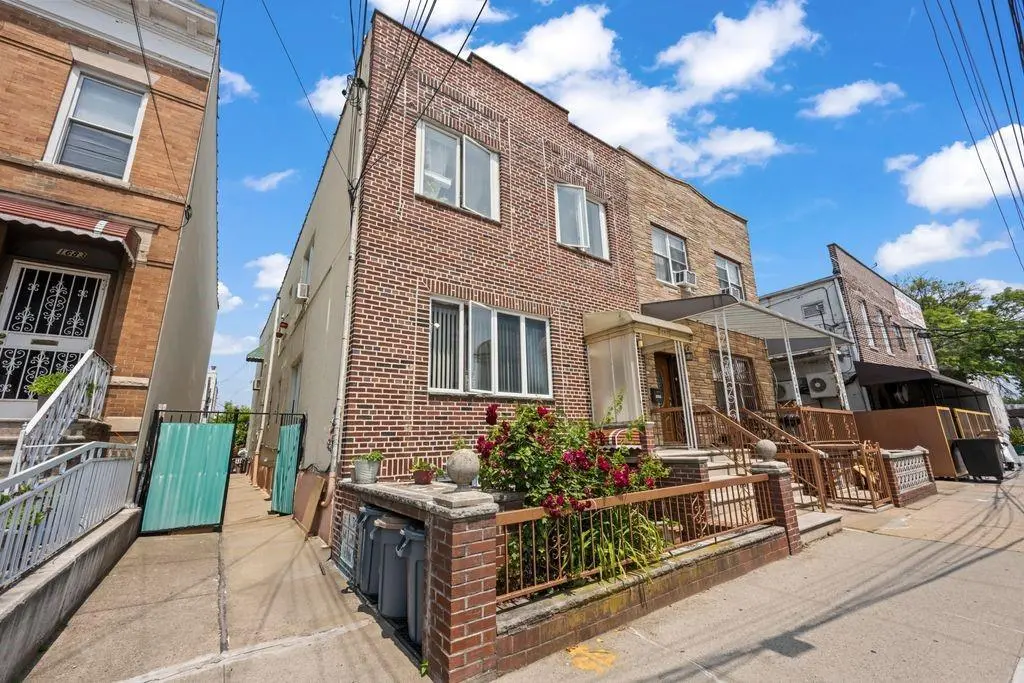
1687 83rd St · New York, NY
Flood risk 1/10 · Minimal
- FEMA flood zone
- X (unshaded)
- Chance of flooding over 30 yrs
- 0.0%
- Est. flood insurance / yr
- $507 – $1,088
Fire risk 1/10 · Minimal
- Est. fire insurance / yr
- $691 – $1,283
Heat risk 6/10 · Moderate
- Hot days now (above 97°F)
- 7 days/yr
- Hot days in 30 yrs
- 15 days/yr
Wind risk 6/10 · Moderate
- Chance of severe wind over 30 yrs
- 68.0%
Air-quality risk 4/10 · Minor
- Unhealthy air days now
- 5 days/yr
- Unhealthy air days in 30 yrs
- 7 days/yr
Risk factors via First Street. Map © Google.
Why this score? — see what drove the D- grade
The composite is a weighted blend of 9 inputs, each scored 0–100. Each bar is that input's sub-score; the figure is the points it added to the 100-point composite (weight × sub-score).
- Cash flow +15.0/30.0
- Schools +5.0/10.0
- DSCR +4.6/10.0
- Rent growth +4.0/5.0
- Livability +3.8/5.0
- 1% rule +3.4/10.0
- Condition / age +2.5/5.0
- ARV discount +0.9/15.0
- Appreciation +0.0/10.0
$1,999,999
🖨 Deal sheet (PDF) 📄 Offer letter ✓ Due diligence
Multi-family units
County records classify this as Multi-Family (2-4 Unit). Listing-text estimate: 4 units. confirmed
Listing remarks
Welcome to this well-maintained 4-family home ideally located in the heart of Bensonhurst. This solid brick property features three spacious 2-bedroom apartments and one large 3-bedroom unit, providing excellent flexibility for both investors and end users. The fully finished basement offers additional storage space and endless possibilities for customization. The building measures 21x78 and sits on an oversized 28x120 lot, providing ample living space along with outdoor potential. Enjoy the convenience of being close to local transportation, schools, parks, and a variety of shopping and dining options. Whether you’re looking to generate strong rental income or create a comfortable ho
Key facts
- Solid brick
- Close to parks
- Close to schools
Tags
Neighborhood map
What this means for you Summary
Snapshot
- This is a 3×2bd/1.2ba + 1×3bd/1.2ba units multifamily listed at $2.00M.
Deal economics
- At list price, monthly cash flow is $615 ($7k/yr) — positive. Per door: $154/mo.
- The deal already cash-flows at list — no discount required.
- To meet the 1% rule (rent ≥ 1% of price), the offer needs to be $1.68M (15.9% below list).
- Recommended offer: $1.68M (15.9% below list) — sets the bar for 1% rule.
- Cap rate 6.7% vs local median 2.6% in New York — top-decile yield for the area; either an underpriced asset or a hidden risk that comps aren't pricing in. Stress-test before assuming the spread holds.
Location & tenants
- Location reads 75/100 on livability (#268 in NY, #4,188 nationally) — a middle-class / working-renter tenant base. Strengths: amenities A+, commute A+, health & safety A; Watch: crime F, cost of living F.
- Zoned schools: Ps 204 Vince Lombardi (math 69% / reading 72%, grade A-, #442 of 2,108 statewide, top 21%, 1,005 students, 75% FRL); Madeleine Brennan School (The) (math 71% / reading 79%, grade A, #54 of 729 statewide, top 8%, 1,554 students, 76% FRL); Midwood High School (math 94% / reading 96%, grade A+, #83 of 1,100 statewide, top 8%, 4,062 students, 73% FRL).
- Market conditions: Rents rising fast (+5.9%/yr); 334 active listings in the ZIP; 10,063 units permitted in Kings County in 2024 (9,789 in 5+ unit buildings).
- At $16,823/mo this rent would consume 306% of the median local household income ($66k/yr) (locally 6028% of renters already pay >50% of income on rent) — very limited rent-growth headroom before tenants either downsize or default.
Forward outlook
- Local home prices are declining (-3.0%/yr); year-one equity from $14k of loan paydown is wiped out by about $60k of value loss. Plan a longer hold.
- Kings County population projected at +13% by 2050 — modest demand growth; plan on rents tracking national, not racing it.
Negotiation context
- It's been on market 38 days — a 3% lower offer ($1.94M) is reasonable based on typical stale-listing flexibility.
Risks & watch-outs
- Watch-outs: built in 1931 — expect roof / HVAC / electrical / plumbing capex.
- Climate carrying-cost: major wind risk, 68% chance of damaging wind over 30y; extreme-heat days projected 7→15/yr by 2055 (HVAC capex compounding) — expect insurance premiums to compound above CPI over the hold.
Questions for the listing agent
- It's been on market 38 days. Have you received any prior offers? Is the seller open to a 16% concession, seller financing, or rate buy-down credit?
- Can we see the unit-by-unit rent roll, current vacancy, and any below-market leases? What's the average tenancy length?
- What capital expenditures (roof, boiler, parking lot, exteriors) have been made in the last 5 years, and what's planned in the next 2?
- Built in 1931 — when were the roof, HVAC, electrical panel, plumbing, and water heater last replaced?
- Is there a deadline driving the sale (1031 exchange, divorce, estate, relocation)? That informs how much negotiation room exists.
- Schools are B-rated — typically a magnet for longer-tenancy family renters. What's the average tenant stay here, and is there a school-zone premium baked into asking?
- Crime grade is F in this area — have there been break-ins, vandalism, or insurance claims at this property in the last 3 years? What carrier currently insures it and at what premium?
- The area grade is low — what's the realistic commute time and amenity access for the typical tenant pool here? Any planned neighborhood developments (good or bad) we should know about?
- What's the average days-on-market for RENTAL listings here right now (not sales)? A rising rental-DOM trend means longer vacancies and softer asking-rent achievability than the comps imply.
- What's the recent tenant-quality profile in this submarket — average credit score on applications, eviction rate, late-payment / NSF rate, and stable-employment percentage? A property-management company in the area should have these aggregated.
- How much new apartment / multifamily construction is in the pipeline within 1–3 miles? Heavy new supply (>2% of stock underway) typically softens rents 12–24 months out; light construction supports rent growth.
Investment metrics
- 1% rule
- 0.84% ✗
- Cap rate
- 6.66%
- Cash-on-cash
- 1.32%
- DSCR
- 1.06
- GRM
- 9.9
CMA / ARV
- ARV (on-the-fly)
- $1,742,910
- Comps found
- 12
Show comp detail 12 sales within ~0.75 mi
| Address | Dist | Beds/Ba | Sqft | Sold | Price | $/sf | Match |
|---|---|---|---|---|---|---|---|
| 1651 79th St | 0.20mi | 8/4.0 | 3,280 (+3%) | 5mo | $1,940,000 | $591 | 79 |
| 1464 86th St | 0.38mi | 8/4.0 | 3,040 (-5%) | 5mo | $3,450,000 | $1,135 | 67 |
| 8309 20th Ave | 0.48mi | 8/4.0 | 3,276 (+2%) | 4mo | $1,540,000 | $470 | 67 |
| 2041 85th St | 0.55mi | 7/4.0 (-1) | 3,280 (+3%) | 1mo | $1,580,000 | $482 | 61 |
| 1519 71 St | 0.65mi | 7/5.0 (-1) | 3,200 (+0%) | 6mo | $1,650,000 | $516 | 59 |
| 7005 19th Ave | 0.71mi | 7/4.0 (-1) | 3,120 (-2%) | 2mo | $2,060,000 | $660 | 53 |
| 1702 74th St | 0.43mi | 7/3.0 (-1) | 3,432 (+7%) | 5mo | $1,430,000 | $417 | 52 |
| 2144 82nd St | 0.69mi | 7/6.0 (-1) | 3,395 (+6%) | 1mo | $1,850,000 | $545 | 47 |
| 125 Bay 26th St | 0.70mi | 7/2.5 (-1) | 3,288 (+3%) | 3mo | $1,790,000 | $544 | 46 |
| 1516 70th St | 0.67mi | 8/4.0 | 2,800 (-12%) | 5mo | $1,882,000 | $672 | 40 |
| 62 Bay 26th St | 0.61mi | 7/3.0 (-1) | 2,880 (-10%) | 5mo | $1,370,000 | $476 | 39 |
| 8743 Bay 16th St | 0.43mi | 7/9.0 (-1) | 2,800 (-12%) | 3mo | $1,999,999 | $714 | 37 |
Match score weights: distance 35% · size 25% · config 20% · recency 20%. Top-matched comps best support the ARV.
Projected returns pro-forma
-3.0% appreciation · 5.87% rent growth · sell at horizon
- IRR
- -11.3%
- Equity multiple
- 0.58×
- Total profit
- $-235,376
- Equity at exit
- $298,206
- IRR
- 1.4%
- Equity multiple
- 1.11×
- Total profit
- $61,180
- Equity at exit
- $172,923
Cash invested: $560,000 (down + closing). Projections, not guarantees.
Landlord ↔ Tenant lean methodology
- Overall (CITY)
- 0 Strongly Tenant-Friendly
- State New York
- 15 Strongly Tenant-Friendly · D+10
- County
- — inherits STATE
- City New York
- 0 Strongly Tenant-Friendly · D+34
ZIP-level market 11214
- Rents YoY
- 5.9%
- Active inventory
- 334
- Price-to-rent
- 40.7×
Monthly cashflow live
- Estimated rent
- $16,823 high interval (Pro) →
- Mortgage (P&I)
- −$10,488
- Tax from tax record
- −$1,353 /mo · $16,240/yr
- Insurance
- −$833
- HOA
- −$0
- Vacancy / Maint / Mgmt
- −$3,533
- Net cashflow
- $615
Break-even live
Sensitivity live
| Price | -10% $1,747 | -5% $1,181 | +0% $615 | +5% $49 | +10% $-517 |
|---|---|---|---|---|---|
| Rent | -10% $-714 | -5% $-49 | +0% $615 | +5% $1,280 | +10% $1,944 |
| Rate | -1.0pp $1,622 | -0.5pp $1,124 | base $615 | +0.5pp $97 | +1.0pp $-430 |
4-unit breakdown (identical units grouped — click to expand)
| Units | Beds | Baths | Est. rent |
|---|---|---|---|
| 3× units | 2 | 1.2 | $12,279 |
| #1 | 2 | 1.2 | $4,093 |
| #2 | 2 | 1.2 | $4,093 |
| #3 | 2 | 1.2 | $4,093 |
| 1× unit | 3 | 1.2 | $4,543 |
| Total (4 units) | $16,823 | ||
UW: 25.0% down · 7.5% · 30yr · 1.5% tax · 5.0% vac · 8.0% maint · 8.0% mgmt
Financing live
Cash to close
- Down payment
- $500,000
- Closing costs
- $60,000
- Reserves months
- —
- Total cash needed
- —
Loan-product check · same deal, 3 products live
Conventional
25% down · 7.5% · 30yr
- Down + closing
- —
- Monthly P&I
- —
- Monthly cashflow
- —
- DSCR
- —
- Eligible?
- —
Personal DTI + credit; lowest rate.
DSCR
20% down · 8.5% · 30yr
- Down + closing
- —
- Monthly P&I
- —
- Monthly cashflow
- —
- DSCR
- —
- Eligible?
- —
No personal income docs; deal must DSCR.
Hard money
10% down · 12.0% · 12mo
- Down + closing
- —
- Monthly P&I
- —
- Monthly cashflow
- —
- DSCR
- —
- Eligible?
- —
Short-term bridge; refi at stabilization.
Listing history 2 events
-
2025-07-25status Pending
-
2025-06-17$1,999,999 Active
ⓘ Source: listings_history table (triggers on properties + properties_extension) + one-shot
backfill from property_details.listing_events for pre-trigger history.
Tax reassessment forecast NY · Partial reset (capped growth)
- Current annual tax
- $16,240 · $1,353/mo
- Projected year-2 tax
- $25,020 · $2,085/mo
- Expected delta
- +$8,780/yr (+$732/mo · 54.1%)
ⓘ Screening estimate from a state-policy table — verify with the county assessor before closing.
Climate risk First Street
- Flood 1/10 Low FEMA zone X (unshaded) · 0% chance over 30 yrs
- Wildfire 1/10 Low
- Heat 6/10 Major 7 d/yr ≥97°F today · 15 d/yr by 30 yrs out
- Wind 6/10 Major 68% chance of damaging wind over 30 yrs
- Air quality 4/10 Moderate 5 unhealthy d/yr today · 7 by 30 yrs out
Nearby sold comps map
Loading sold comps map…
Walkable amenities ~0.75 mi
Loading nearby amenities…
Taxation est. · year 1
- Rental income
- $201,876
- − Mortgage interest
- −$112,031
- − Property taxes
- −$16,240
- − Insurance
- −$10,000
- − Repairs & maintenance
- −$16,150
- − Management
- −$16,150
- − Depreciation
- −$58,182
- Taxable loss
- −$26,877
- Est. tax savings @ 24.0%
- +$6,450
- After-tax cash flow
- $13,834/yr
For passive investors: Depreciation is non-cash, so a rental often shows a tax loss while cash-flowing — sheltering income. Rental losses are passive: they offset passive income freely, and up to $25,000/yr can offset ordinary (W-2) income if you actively participate and your MAGI is under $100k (phasing out to $0 by $150k); unused losses carry forward. On sale, claimed depreciation is recaptured at up to 25%, and gains may owe capital-gains tax (a 1031 exchange can defer both). Figures are a year-1 estimate at your 24.0% rate — not tax advice; consult a CPA.
Schools (NCES district)
No district data.
Livability — New York
- Score
- 75/100
- State rank
- #268
- US rank
- #4188
Category grades
Schools grade is shown separately in the Schools card above.
Census & demographics
- Census place
- New York, NY
- County
- Kings County · 2,614,986 people
- City population
- 7,731,280
- Metro
- New York-Newark-Jersey City, NY-NJ-PA
- Population (ZIP)
- 89,397
- Household income
- $65,895
- Rent vs Own
- Severe rent burden
- 6028.0
Population outlook (Kings County) Hauer SSP2
- Today (2025)
- 2,847,441 people
- By 2030
- 2,937,006 · +3.1%
- By 2040
- 3,095,491 · +8.7%
- By 2050
- 3,228,968 · +13.4%
- By 2075
- 3,321,723 · +16.7%
- By 2100
- 3,111,387 · +9.3%
Race, ethnicity, and origin ACS 2023
- Neighborhood character
- Diverse neighborhood (Simpson 0.67)
- Race & ethnicity
- White 40% Asian 38% Hispanic / Latino 17% Two or more races 6% Black 2%
- Hispanic origin (detail)
- Mexican 5% Puerto Rican 3% Dominican 2%
- Common ancestry
- Scotch-Irish 4% Subsaharan African 3% Romanian 2%
- Foreign-born
- 56% · China, Canada, Vietnam
- Languages at home
- 26% English-only · Chinese 28% Russian/Polish/Slavic 15% Spanish 13%
Political lean MEDSL · Kings
- 2024 margin
- Solid D (+44.0) · D 72.0% · R 28.0%
- 2008→2024 swing
- -15.5pp toward R · 2008: 59.4pp · 2024: 44.0pp
- All cycles
- 2024: D+44.0 2020: D+54.8 2016: D+61.8 2012: D+63.9 2008: D+59.4
Not yet ingested
- Civics
- —
Market trends
- HPI YoY
- ▼ -184.55%
- Current HPI
- 276.0804
- Rent YoY
- ▲ 5.87%
- Metro
- New York-Newark-Jersey City, NY-NJ-PA
- State GDP YoY
- ▲ 2.60%
- F500 in state
- 92
Industry mix (Fortune 500 HQ in NY)
| Industry | F500 HQs | Revenue |
|---|---|---|
| Financial Services | 10 | $950B |
|
||
| Consumer Goods | 9 | $162B |
|
||
| Insurance | 4 | $225B |
|
||
| Telecommunications | 2 | $144B |
|
||
| Pharmaceuticals | 2 | $112B |
|
||
| Media / Entertainment | 2 | $69B |
|
||
Price history
2 events — show timeline
- 2025-07-25 Pending — BNYMLS
- 2025-06-17 Listed $1,999,999 BNYMLS
Property tax history
+5.5%/yrLatest (2025): $16,240 · +6.9% YoY. Source: county tax records.
Cash-flow waterfall
monthlySold comps — $/sqft
last 12 mo · ≤1 miLoading sold comps…