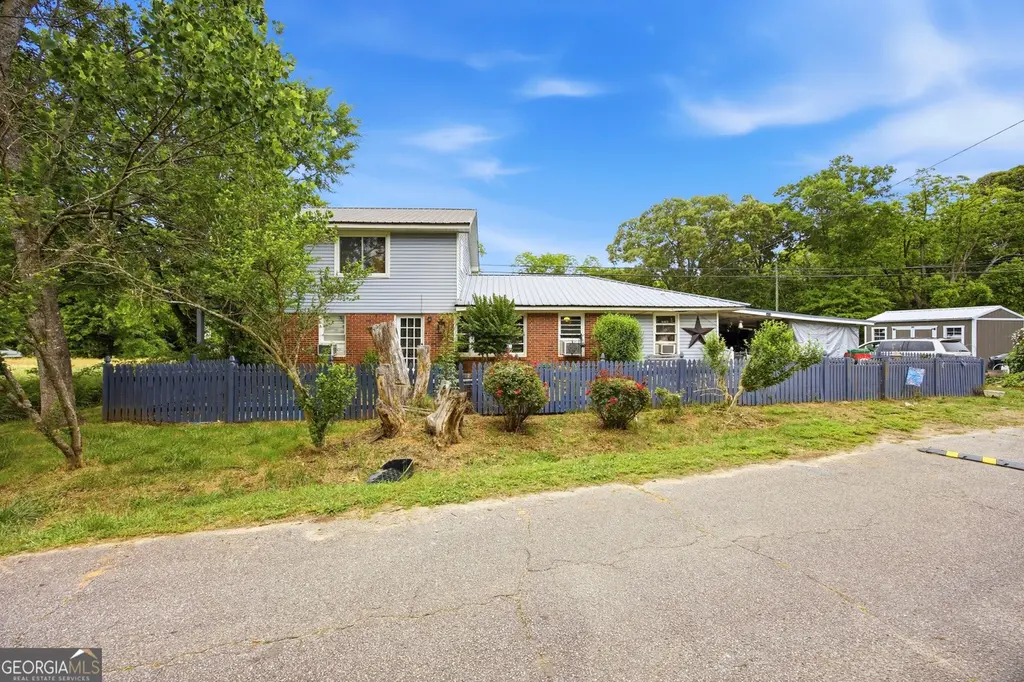
50 Edgewood Dr #1 · Danielsville, GA
Flood risk 1/10 · Minimal
- FEMA flood zone
- X (unshaded)
- Chance of flooding over 30 yrs
- 0.0%
- Est. flood insurance / yr
- $507 – $1,088
Fire risk 4/10 · Minor
- Est. fire insurance / yr
- $963 – $1,789
Heat risk 6/10 · Moderate
- Hot days now (above 105°F)
- 7 days/yr
- Hot days in 30 yrs
- 17 days/yr
Wind risk 4/10 · Minor
- Chance of severe wind over 30 yrs
- 18.0%
Air-quality risk 4/10 · Minor
- Unhealthy air days now
- 4 days/yr
- Unhealthy air days in 30 yrs
- 5 days/yr
Risk factors via First Street. Map © Google.
Why this score? — see what drove the B+ grade
The composite is a weighted blend of 9 inputs, each scored 0–100. Each bar is that input's sub-score; the figure is the points it added to the 100-point composite (weight × sub-score).
- Cash flow +25.0/30.0
- ARV discount +15.0/15.0
- Appreciation +10.0/10.0
- DSCR +8.1/10.0
- 1% rule +5.6/10.0
- Schools +3.7/10.0
- Livability +3.6/5.0
- Rent growth +2.5/5.0
- Condition / age +2.5/5.0
$150,000
🖨 Deal sheet 📄 Offer letter ✓ Due diligence
Listing remarks
Discover the potential of this spacious 5-bedroom, 2-bathroom home situated on a quiet lot in the heart of Danielsville. Offering over 1,700 square feet of living space, this property features a versatile floor plan with a mix of hardwood and tile flooring. The exterior is a low-maintenance blend of brick and vinyl, complemented by a functional carport. Located just minutes from Madison County High School and local shops, this home presents a fantastic opportunity for those looking to customize a large space or seeking an investment in a growing community.
Key facts
- Functional carport
- Quiet lot
- Versatile floor plan
Tags
Property features AI
Finance
- Other: Home warranty included
- HOA & community: No HOA; Association fees: None; Community features: None
Exterior
- Parking: Detached garage
- Utilities: Public water; Public sewer; Utilities: None
- Home design: Single-family residence; Residential property; Entry level: Unit 1
- Construction: Built in 1960; Brick construction
- Exterior features: Roof: Other; Lot features: Other
Interior
- Kitchen: Appliances: Other
- Bedrooms: 5 bedrooms (all on the main level)
- Flooring: Other flooring
- Bathrooms: 2 full bathrooms (both on the main level)
- Heating & cooling: Heating: Other; Cooling: Other; Has heating and cooling
- Interior features: One-and-a-half story layout; Resale condition; No basement; No fireplaces
- Laundry & utility: Laundry: Other
Neighborhood map
What this means for you Summary
Snapshot
- This is a 5-bed/2.0-bath single-family listed at $150k.
Deal economics
- At list price, monthly cash flow is $325 ($4k/yr) — positive.
- The deal already cash-flows at list — no discount required.
- Meets the 1% rule at list price ($2k rent vs $150k).
- Recommended offer: $146k (3.0% below list) — sets the bar for market timing.
- Cap rate 8.9% vs local median 2.3% in Danielsville — top-decile yield for the area; either an underpriced asset or a hidden risk that comps aren't pricing in. Stress-test before assuming the spread holds.
Location & tenants
- Location reads 71/100 on livability (#83 in GA) — a middle-class / working-renter tenant base. Strengths: crime A+, cost of living A+, housing A+; Watch: amenities F, commute F, health & safety F.
- Madison County (rural): math 46% / reading 42% proficiency, ranked #29 of 174 in GA (top 17%) — families likely to look elsewhere, expect single-tenant / working-renter base with shorter leases.
- Zoned schools: Danielsville Elementary School (math 52% / reading 45%, grade D, #284 of 1,228 statewide, top 23%, 679 students, 61% FRL).
- Market conditions: 64 active listings in the ZIP; 189 units permitted in Madison County in 2024 (0 in 5+ unit buildings).
Forward outlook
- In year one you build about $16k of equity ($1k loan paydown + $15k appreciation (10.0% local appreciation)).
- At projected returns (10.0% appreciation + 3.0% rent growth), your $42k cash investment doubles in ~3 years — after that, you're playing with house money.
- By year 3, paydown + projected appreciation supports a ~$41k cash-out refi (75% LTV) — recoverable capital for the next deal without selling this one.
Negotiation context
- It's been on market 31 days — a 3% lower offer ($146k) is reasonable based on typical stale-listing flexibility.
- Current owner paid $37k; list at $150k implies a 305% gain — meaningful room to come down on a strong offer.
Risks & watch-outs
- Climate carrying-cost: extreme-heat days projected 7→17/yr by 2055 (HVAC capex compounding) — expect insurance premiums to compound above CPI over the hold.
Questions for the listing agent
- It's been on market 31 days. Have you received any prior offers? Is the seller open to a 3% concession, seller financing, or rate buy-down credit?
- Built in 1960 — when were the roof, HVAC, electrical panel, plumbing, and water heater last replaced?
- Is there a deadline driving the sale (1031 exchange, divorce, estate, relocation)? That informs how much negotiation room exists.
- What's the average days-on-market for RENTAL listings here right now (not sales)? A rising rental-DOM trend means longer vacancies and softer asking-rent achievability than the comps imply.
- What's the recent tenant-quality profile in this submarket — average credit score on applications, eviction rate, late-payment / NSF rate, and stable-employment percentage? A property-management company in the area should have these aggregated.
- How much new for-sale + rental construction is in the pipeline within 1–3 miles? Heavy new supply typically softens prices + rents 12–24 months out; constrained supply supports both.
Investment metrics
- 1% rule
- 1.06% ✓
- Cap rate
- 8.89%
- Cash-on-cash
- 9.28%
- DSCR
- 1.41
- GRM
- 7.9
CMA / ARV
- ARV (on-the-fly)
- $289,100
- Comps found
- 5
Show comp detail 5 sales within ~0.75 mi
| Address | Dist | Beds/Ba | Sqft | Sold | Price | $/sf | Match |
|---|---|---|---|---|---|---|---|
| 112 Northridge Dr | 0.13mi | 4/2.5 (-1) | 1,631 (+11%) | 4mo | $319,900 | $196 | 66 |
| 112 Northridge Dr #8 | 0.13mi | 4/2.5 (-1) | 1,631 (+11%) | 4mo | $319,900 | $196 | 66 |
| 150 Northridge Dr #3 | 0.13mi | 4/2.5 (-1) | 1,631 (+11%) | 6mo | $299,900 | $184 | 65 |
| 210 Northridge Dr #1 | 0.12mi | 4/2.0 (-1) | 1,663 (+13%) | 10mo | $329,900 | $198 | 60 |
| 210 Northridge Dr | 0.12mi | 4/3.0 (-1) | 1,663 (+13%) | 10mo | $329,900 | $198 | 56 |
Match score weights: distance 35% · size 25% · config 20% · recency 20%. Top-matched comps best support the ARV.
Projected returns pro-forma
10.0% appreciation · 3.0% rent growth · sell at horizon
- IRR
- 31.0%
- Equity multiple
- 3.44×
- Total profit
- $102,331
- Equity at exit
- $135,132
- IRR
- 26.8%
- Equity multiple
- 7.79×
- Total profit
- $284,998
- Equity at exit
- $291,417
Cash invested: $42,000 (down + closing). Projections, not guarantees.
Landlord ↔ Tenant lean methodology
- Overall (STATE)
- 90 Strongly Landlord-Friendly
- State Georgia
- 90 Strongly Landlord-Friendly · R+3
- County
- — inherits STATE
- City
- — inherits STATE
ZIP-level market 30633
- Home prices YoY
- 4.0%
- Active inventory
- 64
- Price-to-rent
- 7.9×
Monthly cashflow live
- Estimated rent
- $1,584 medium interval (Pro) →
- Mortgage (P&I)
- −$787
- Tax from tax record
- −$77 /mo · $929/yr
- Insurance
- −$62
- HOA
- −$0
- Vacancy / Maint / Mgmt
- −$333
- Net cashflow
- $325
Break-even live
UW: 25.0% down · 7.5% · 30yr · 1.5% tax · 5.0% vac · 8.0% maint · 8.0% mgmt
Financing live
Cash to close
- Down payment
- $37,500
- Closing costs
- $4,500
- Reserves months
- —
- Total cash needed
- —
Loan-product check · same deal, 3 products live
Conventional
25% down · 7.5% · 30yr
- Down + closing
- —
- Monthly P&I
- —
- Monthly cashflow
- —
- DSCR
- —
- Eligible?
- —
Personal DTI + credit; lowest rate.
DSCR
20% down · 8.5% · 30yr
- Down + closing
- —
- Monthly P&I
- —
- Monthly cashflow
- —
- DSCR
- —
- Eligible?
- —
No personal income docs; deal must DSCR.
Hard money
10% down · 12.0% · 12mo
- Down + closing
- —
- Monthly P&I
- —
- Monthly cashflow
- —
- DSCR
- —
- Eligible?
- —
Short-term bridge; refi at stabilization.
Listing history 17 events
-
2026-06-19days on market $150,000 Active 31 DOM
-
2026-06-18statusdays on market $150,000 Active 30 DOM
-
2026-06-17days on market $150,000 Price Change 29 DOM
-
2026-06-16pricestatusdays on market $150,000 Price Change 28 DOM
-
2026-06-15days on market $175,000 Active 27 DOM
-
2026-06-14days on market $175,000 Active 25 DOM
-
2026-06-13days on market $175,000 Active 24 DOM
-
2026-06-10days on market $175,000 Active 22 DOM
-
2026-06-09days on market $175,000 Active 21 DOM
-
2026-06-08days on market $175,000 Active 20 DOM
-
2026-06-07statusdays on market $175,000 Active 19 DOM
-
2026-06-02pricestatusdays on market $175,000 Price Change 14 DOM
-
2026-06-01days on market $190,000 New 13 DOM
-
2026-05-31days on market $190,000 New 12 DOM
-
2026-05-30days on market $190,000 New 11 DOM
-
2026-05-19$190,000 New
-
2008-08-28soldstatus $37,000
ⓘ Source: listings_history table (triggers on properties + properties_extension) + one-shot
backfill from property_details.listing_events for pre-trigger history.
Tax reassessment forecast GA · Resets to sale price
- Current annual tax
- $929 · $77/mo
- Projected year-2 tax
- $1,380 · $115/mo
- Expected delta
- +$451/yr (+$38/mo · 48.6%)
ⓘ Screening estimate from a state-policy table — verify with the county assessor before closing.
Climate risk First Street
- Flood 1/10 Low FEMA zone X (unshaded) · 0% chance over 30 yrs
- Wildfire 4/10 Moderate
- Heat 6/10 Major 7 d/yr ≥105°F today · 17 d/yr by 30 yrs out
- Wind 4/10 Moderate 18% chance of damaging wind over 30 yrs
- Air quality 4/10 Moderate 4 unhealthy d/yr today · 5 by 30 yrs out
Nearby sold comps map
Loading sold comps map…
Walkable amenities ~0.75 mi
Loading nearby amenities…
Taxation est. · year 1
- Rental income
- $19,006
- − Mortgage interest
- −$8,402
- − Property taxes
- −$929
- − Insurance
- −$750
- − Repairs & maintenance
- −$1,520
- − Management
- −$1,520
- − Depreciation
- −$4,364
- Taxable income
- $1,520
- Est. tax owed @ 24.0%
- −$365
- After-tax cash flow
- $3,532/yr
For passive investors: Depreciation is non-cash, so a rental often shows a tax loss while cash-flowing — sheltering income. Rental losses are passive: they offset passive income freely, and up to $25,000/yr can offset ordinary (W-2) income if you actively participate and your MAGI is under $100k (phasing out to $0 by $150k); unused losses carry forward. On sale, claimed depreciation is recaptured at up to 25%, and gains may owe capital-gains tax (a 1031 exchange can defer both). Figures are a year-1 estimate at your 24.0% rate — not tax advice; consult a CPA.
Schools (NCES district)
- District
- Madison County
- NCES district ID
- 1303480
- Math proficiency
- 46% ▼ -10.00%
- Reading proficiency
- 42% ▼ -9.00%
- Median HH income
- $43,465
- Composite
- 37.21/100
- National rank
- #4469
- State rank
- #29 of 174 in GA
Livability — Danielsville
- Score
- 71/100
- State rank
- #83
- US rank
- #7029
Category grades
Schools grade is shown separately in the Schools card above.
Census & demographics
- Census place
- Danielsville, GA
- Population (ZIP)
- 8,706
Population outlook (Madison County) Hauer SSP2
- Today (2025)
- 28,986 people
- By 2030
- 28,972 · +-0.0%
- By 2040
- 28,711 · -0.9%
- By 2050
- 28,282 · -2.4%
- By 2075
- 28,346 · -2.2%
- By 2100
- 28,189 · -2.7%
Race, ethnicity, and origin ACS 2023
- Neighborhood character
- Predominantly White (86%)
- Race & ethnicity
- White 86% Two or more races 11% Hispanic / Latino 8%
- Hispanic origin (detail)
- Common ancestry
- Serbian 2% Italian 1% Iranian 1%
- Foreign-born
- 4% · Canada
- Languages at home
- 95% English-only · Spanish 5%
Political lean MEDSL · Madison
- 2024 margin
- Solid R (+54.8) · D 22.4% · R 77.2%
- 2008→2024 swing
- -8.4pp toward R · 2008: -46.4pp · 2024: -54.8pp
- All cycles
- 2024: R+54.8 2020: R+53.0 2016: R+56.7 2012: R+53.8 2008: R+46.4
Not yet ingested
- Civics
- —
Market trends
- HPI YoY
- ▲ 10.65%
- Current HPI
- 274.92
- Rent YoY
- —
- Metro
- —
- State GDP YoY
- ▲ 2.66%
- F500 in state
- 28
Industry mix (Fortune 500 HQ in GA)
| Industry | F500 HQs | Revenue |
|---|---|---|
| Paper / Packaging | 2 | $29B |
|
||
| Retail | 1 | $160B |
|
||
| Transportation / Logistics | 1 | $91B |
|
||
| Airlines | 1 | $62B |
|
||
| Consumer Goods | 1 | $47B |
|
||
| Utilities | 1 | $25B |
|
||
Price history
+413.5% since first listed2 events — show timeline
- 2026-05-19 Listed $190,000 GAMLS
- 2008-08-28 Sold (Public Records) $37,000 Public Records
Property tax history
+6.1%/yrLatest (2025): $929 · +1.4% YoY. Source: county tax records.
Cash-flow waterfall
monthlySold comps — $/sqft
last 12 mo · ≤1 miLoading sold comps…