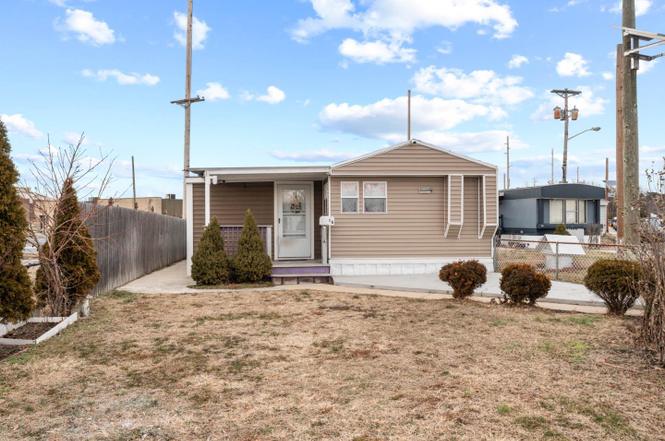
1-A Ashwood Ave · Gloucester City, NJ
Flood risk No data
- FEMA flood zone
- —
- Chance of flooding over 30 yrs
- —
- Est. flood insurance / yr
- —
Fire risk No data
- Est. fire insurance / yr
- —
Heat risk No data
- Hot days now (above threshold)
- —
- Hot days in 30 yrs
- —
Wind risk No data
- Chance of severe wind over 30 yrs
- —
Air-quality risk No data
- Unhealthy air days now
- —
- Unhealthy air days in 30 yrs
- —
Risk factors via First Street. Map © Google.
Why this score? — see what drove the B- grade
The composite is a weighted blend of 9 inputs, each scored 0–100. Each bar is that input's sub-score; the figure is the points it added to the 100-point composite (weight × sub-score).
- Cash flow +30.0/30.0
- 1% rule +10.0/10.0
- DSCR +10.0/10.0
- ARV discount +7.5/15.0
- Livability +3.6/5.0
- Rent growth +2.5/5.0
- Condition / age +2.5/5.0
- Schools +2.0/10.0
- Appreciation +0.0/10.0
$119,900
🖨 Deal sheet (PDF) 📄 Offer letter ✓ Due diligence
Listing remarks
Welcome to this spacious and beautifully updated manufactured home at 1-A Ashwood Avenue! Built in 1985 and thoughtfully upgraded, this home offers comfort, functionality, and modern appeal. Featuring 3 bedrooms, 2 full bathrooms, plus a den/office, there’s plenty of room for living, working, and entertaining. Enjoy the open-concept living room and kitchen, creating a bright and inviting space perfect for everyday living and gatherings. With approximately 1,108 square feet, the layout feels open, airy, and practical. Major improvements have been completed in recent years, including a roof replaced just 4 years ago, providing peace of mind for the next owner. This property is situated
Key facts
- Major improvements
- Roof replaced
- 3,485 sq ft lot
Tags
Property features AI
Finance
- Financial info: Lease not considered
- HOA & community: Land lease: $775 monthly; Approximately 1 year of land lease remaining; Property manager present
Exterior
- Parking: On-street parking
- Utilities: Public water; Public sewer; Propane service; Electric service
- Home design: Manufactured home; Modular/Manufactured construction; Above-grade living space (estimated 1,180 finished square feet); Land lease community
- Construction: Manufactured/modular construction; Above grade structure
- Exterior features: Located in Crescent Mobile Home Park; Not in a federal flood zone; Pets allowed (dogs OK; number and size/weight restrictions apply)
Interior
- Bedrooms: Three bedrooms on the main level
- Bathrooms: Two full bathrooms (both on the main level)
- Heating & cooling: Forced air heating; Propane (owned) for heating; Electric hot water; Wall unit cooling (electric)
- Interior features: Estimated living area; No basement
- Laundry & utility: Washer/dryer hookup
Neighborhood map
What this means for you Summary
Snapshot
- This is a 3-bed/2.0-bath single-family listed at $120k.
Deal economics
- At list price, monthly cash flow is $759 ($9k/yr) — positive.
- The deal already cash-flows at list — no discount required.
- Meets the 1% rule at list price ($2k rent vs $120k).
- Recommended offer: $109k (9.0% below list) — sets the bar for market timing.
- Cap rate 13.9% vs local median 5.5% in Gloucester City — top-decile yield for the area; either an underpriced asset or a hidden risk that comps aren't pricing in. Stress-test before assuming the spread holds.
Location & tenants
- Location reads 72/100 on livability (#215 in NJ) — a middle-class / working-renter tenant base. Strengths: housing A+, health & safety B+; Watch: amenities F, commute F.
- Gloucester City Public School District (suburban): math 11% / reading 34% proficiency, ranked #413 of 472 in NJ (top 88%) — low school quality limits family demand, transient renter base, plan for 1-2y turnover.
- Market conditions: 90 active listings in the ZIP; 21 comparable units currently listed for rent nearby; rentals at typical pace (median 19d on market — plan ~3-4 weeks tenant-placement turnaround); 1,018 units permitted in Camden County in 2024 (509 in 5+ unit buildings).
- This rent runs 38% of the median local income ($63k/yr) — at the standard rent-burdened threshold; future hikes will face affordability resistance.
Forward outlook
- Local home prices are declining (-3.0%/yr); year-one equity from $829 of loan paydown is wiped out by about $4k of value loss. Plan a longer hold.
- Camden County population projected to shrink 8% by 2050 — rents likely to lag national; underwrite the cash flow, not the appreciation.
- At projected returns (-3.0% appreciation + 3.0% rent growth), your $34k cash investment doubles in ~5 years — after that, you're playing with house money.
Negotiation context
- It's been on market 98 days — a 9% lower offer ($109k) is reasonable based on typical stale-listing flexibility.
- 3 sale attempts; this cycle's ask has dropped $30k (20%) from the opening price — seller is motivated, your offer sets the floor, not the list.
Questions for the listing agent
- It's been on market 98 days. Have you received any prior offers? Is the seller open to a 9% concession, seller financing, or rate buy-down credit?
- Why hasn't it sold? Are there any deal-killer items the seller is aware of (foundation, flood, title, zoning, code violations)?
- Is there a deadline driving the sale (1031 exchange, divorce, estate, relocation)? That informs how much negotiation room exists.
- What's the average days-on-market for RENTAL listings here right now (not sales)? A rising rental-DOM trend means longer vacancies and softer asking-rent achievability than the comps imply.
- What's the recent tenant-quality profile in this submarket — average credit score on applications, eviction rate, late-payment / NSF rate, and stable-employment percentage? A property-management company in the area should have these aggregated.
- How much new for-sale + rental construction is in the pipeline within 1–3 miles? Heavy new supply typically softens prices + rents 12–24 months out; constrained supply supports both.
Investment metrics
- 1% rule
- 1.68% ✓
- Cap rate
- 13.89%
- Cash-on-cash
- 27.14%
- DSCR
- 2.21
- GRM
- 5.0
CMA / ARV
- ARV (on-the-fly)
- $316,240
- Comps found
- 12
Show comp detail 12 sales within ~0.75 mi
| Address | Dist | Beds/Ba | Sqft | Sold | Price | $/sf | Match |
|---|---|---|---|---|---|---|---|
| 110 5th St | 0.37mi | 3/1.0 | 1,228 (+4%) | 2mo | $260,000 | $212 | 70 |
| 132 Hickman Ave | 0.48mi | 2/2.0 (-1) | 1,226 (+4%) | 2mo | $295,000 | $241 | 65 |
| 334 Rosalind Ave | 0.35mi | 3/1.5 | 1,304 (+10%) | 3mo | $349,900 | $268 | 62 |
| 205 Union Ave | 0.75mi | 3/2.0 | 1,152 (-2%) | 1mo | $335,000 | $291 | 61 |
| 51 Warren Ave | 0.64mi | 2/1.0 (-1) | 1,150 (-2%) | 6mo | $265,000 | $230 | 52 |
| 1152 Jefferson Ave | 0.48mi | 3/1.0 | 1,038 (-12%) | 4mo | $290,000 | $279 | 51 |
| 850 Market St | 0.74mi | 4/1.0 (+1) | 1,160 (-2%) | 5mo | $325,000 | $280 | 50 |
| 918 Highland Blvd | 0.57mi | 3/1.0 | 1,054 (-11%) | 2mo | $331,275 | $314 | 50 |
| 909 Highland Blvd | 0.60mi | 2/1.0 (-1) | 1,274 (+8%) | 1mo | $315,000 | $247 | 49 |
| 122 N Wilson Ave | 0.64mi | 3/1.5 | 1,062 (-10%) | 4mo | $250,000 | $235 | 48 |
| 940 Carter Ave | 0.58mi | 3/1.0 | 1,008 (-15%) | 3mo | $325,000 | $322 | 42 |
| 62 Warren Ave | 0.63mi | 3/1.0 | 1,008 (-15%) | 3mo | $192,500 | $191 | 40 |
Match score weights: distance 35% · size 25% · config 20% · recency 20%. Top-matched comps best support the ARV.
Projected returns pro-forma
-3.0% appreciation · 3.0% rent growth · sell at horizon
- IRR
- 21.1%
- Equity multiple
- 1.86×
- Total profit
- $28,967
- Equity at exit
- $17,877
- IRR
- 29.3%
- Equity multiple
- 3.61×
- Total profit
- $87,625
- Equity at exit
- $10,367
Cash invested: $33,572 (down + closing). Projections, not guarantees.
Landlord ↔ Tenant lean methodology
- Overall (STATE)
- 21 Tenant-Leaning
- State New Jersey
- 21 Tenant-Leaning · D+6
- County
- — inherits STATE
- City
- — inherits STATE
ZIP-level market 08030
- Home prices YoY
- -27.9%
- Active inventory
- 90
- Price-to-rent
- 5.0×
Monthly cashflow live
- Estimated rent
- $2,010 high interval (Pro) →
- Mortgage (P&I)
- −$629
- Tax est. 1.5%
- −$150 /mo · $1,798/yr
- Insurance
- −$50
- HOA
- −$0
- Vacancy / Maint / Mgmt
- −$422
- Net cashflow
- $759
Break-even live
Sensitivity live
| Price | -10% $842 | -5% $801 | +0% $759 | +5% $718 | +10% $677 |
|---|---|---|---|---|---|
| Rent | -10% $601 | -5% $680 | +0% $759 | +5% $839 | +10% $918 |
| Rate | -1.0pp $820 | -0.5pp $790 | base $759 | +0.5pp $728 | +1.0pp $697 |
UW: 25.0% down · 7.5% · 30yr · 1.5% tax · 5.0% vac · 8.0% maint · 8.0% mgmt
Financing live
Cash to close
- Down payment
- $29,975
- Closing costs
- $3,597
- Reserves months
- —
- Total cash needed
- —
Loan-product check · same deal, 3 products live
Conventional
25% down · 7.5% · 30yr
- Down + closing
- —
- Monthly P&I
- —
- Monthly cashflow
- —
- DSCR
- —
- Eligible?
- —
Personal DTI + credit; lowest rate.
DSCR
20% down · 8.5% · 30yr
- Down + closing
- —
- Monthly P&I
- —
- Monthly cashflow
- —
- DSCR
- —
- Eligible?
- —
No personal income docs; deal must DSCR.
Hard money
10% down · 12.0% · 12mo
- Down + closing
- —
- Monthly P&I
- —
- Monthly cashflow
- —
- DSCR
- —
- Eligible?
- —
Short-term bridge; refi at stabilization.
Rent comps 21 comps
| Address | Beds | Baths | Sqft | Rent | $/sqft | DOM | Units | Dist |
|---|---|---|---|---|---|---|---|---|
| 1120 Howard Ave Unit A Bellmawr, NJ | 2.0 | 1.0 | 1425 | $1,800 | $1.26 | 18d | 1 | 0.62mi |
| 917 Koehler St Gloucester City, NJ | 3.0 | 1.0 | 916 | $1,800 | $1.97 | 19d | 1 | 0.65mi |
| 5 Meadow Ln Gloucester City, NJ | 1.0–2.0 | 1.0–2.0 | 833 | $2,385 | $2.86 | 24d | 8 | 0.67mi |
| 50 Princeton Ave Bellmawr, NJ | 2.0 | 1.0 | 720 | $2,000 | $2.78 | 1d | 1 | 0.69mi |
| 108 New Broadway Unit 120 Brooklawn, NJ | 2.0 | 1.0 | 800 | $1,800 | $2.25 | 24d | 1 | 0.71mi |
| 227 S Broadway Gloucester City, NJ | 3.0 | 1.0 | 1123 | $1,775 | $1.58 | 24d | 1 | 0.83mi |
| 604 Hunter St Gloucester City, NJ | 3.0 | 1.0 | 1066 | $1,900 | $1.78 | 5d | 1 | 0.98mi |
| 602 Powell St Gloucester City, NJ | 3.0 | 1.0 | 1170 | $1,850 | $1.58 | 24d | 1 | 0.98mi |
| 534 Bergen St Gloucester City, NJ | 3.0 | 1.0 | 1246 | $2,000 | $1.61 | 19d | 1 | 1.04mi |
| 928 Creek Rd Bellmawr, NJ | 2.0 | 1.0 | 1100 | $1,550 | $1.41 | 4d | 1 | 1.14mi |
| 430 W Browning Rd Bellmawr, NJ | 1.0–2.0 | 1.0 | 773 | $1,970 | $2.55 | 1d | 17 | 1.22mi |
| 231 3rd St Gloucester City, NJ | 3.0 | 2.0 | 1376 | $2,150 | $1.56 | 24d | 1 | 1.22mi |
| 13 Pine St Westville, NJ | 3.0 | 1.0 | 1300 | $2,000 | $1.54 | 1d | 1 | 1.23mi |
| 334 Middlesex St Gloucester City, NJ | 3.0 | 1.0 | 896 | $1,800 | $2.01 | 24d | 1 | 1.27mi |
| 1063 S Merrimac Rd Camden, NJ | 4.0 | 1.0 | 1024 | $1,900 | $1.86 | 24d | 1 | 1.34mi |
| 13 S Black Horse Pike Unit 1B Haddon Heights, NJ | 2.0 | 1.0 | 1000 | $1,795 | $1.79 | 18d | 1 | 1.35mi |
| 3136 Tuckahoe Rd Camden, NJ | 2.0 | 1.0 | 800 | $1,350 | $1.69 | 24d | 1 | 1.42mi |
| 1021 Monitor Rd Camden, NJ | 3.0 | 1.0 | 1012 | $1,710 | $1.69 | 24d | 1 | 1.43mi |
| 408 Broadway Westville, NJ | 2.0 | 1.0 | 750 | $1,375 | $1.83 | 1d | 1 | 1.44mi |
| 289 James St Unit 2 Mt Ephraim, NJ | 2.0 | 1.0 | 1150 | $2,350 | $2.04 | 3d | 1 | 1.44mi |
| 107 E Kings Hwy Unit 2ND FLOOR Mt Ephraim, NJ | 2.0 | 1.0 | 900 | $1,800 | $2.00 | 24d | 1 | 1.49mi |
Listing history 9 events
-
2026-05-22status Pending
-
2026-05-18status Active
-
2026-05-11status Pending
-
2026-04-23price $119,900
-
2026-04-14status Active
-
2026-04-03historical Active Under Contract
-
2026-03-17price $129,900
-
2026-02-22price $139,900
-
2026-01-25$150,000 Active
ⓘ Source: listings_history table (triggers on properties + properties_extension) + one-shot
backfill from property_details.listing_events for pre-trigger history.
Nearby sold comps map
Loading sold comps map…
Walkable amenities ~0.75 mi
Loading nearby amenities…
Taxation est. · year 1
- Rental income
- $24,121
- − Mortgage interest
- −$6,716
- − Property taxes
- −$1,798
- − Insurance
- −$600
- − Repairs & maintenance
- −$1,930
- − Management
- −$1,930
- − Depreciation
- −$3,488
- Taxable income
- $7,660
- Est. tax owed @ 24.0%
- −$1,838
- After-tax cash flow
- $7,274/yr
For passive investors: Depreciation is non-cash, so a rental often shows a tax loss while cash-flowing — sheltering income. Rental losses are passive: they offset passive income freely, and up to $25,000/yr can offset ordinary (W-2) income if you actively participate and your MAGI is under $100k (phasing out to $0 by $150k); unused losses carry forward. On sale, claimed depreciation is recaptured at up to 25%, and gains may owe capital-gains tax (a 1031 exchange can defer both). Figures are a year-1 estimate at your 24.0% rate — not tax advice; consult a CPA.
Schools (NCES district)
- District
- Gloucester City Public School District
- NCES district ID
- 3406000
- Math proficiency
- 11% ▼ -21.00%
- Reading proficiency
- 34% ▼ -15.00%
- Median HH income
- $51,231
- Composite
- 20.01/100
- National rank
- #8664
- State rank
- #413 of 472 in NJ
Livability — Gloucester City
- Score
- 72/100
- State rank
- #215
- US rank
- #5984
Category grades
Schools grade is shown separately in the Schools card above.
Census & demographics
- Census place
- Gloucester City, NJ
- County
- Camden County · 407,624 people
- City population
- 13,217
- Metro
- Philadelphia-Camden-Wilmington, PA-NJ-DE-MD
- Population (ZIP)
- 13,217
- Household income
- $63,384
- Rent vs Own
- Severe rent burden
- 431.0
Population outlook (Camden County) Hauer SSP2
- Today (2025)
- 507,964 people
- By 2030
- 502,182 · -1.1%
- By 2040
- 485,602 · -4.4%
- By 2050
- 465,630 · -8.3%
- By 2075
- 419,986 · -17.3%
- By 2100
- 369,492 · -27.3%
Race, ethnicity, and origin ACS 2023
- Neighborhood character
- Predominantly White (68%)
- Race & ethnicity
- White 68% Hispanic / Latino 18% Black 7% Asian 5% Two or more races 5%
- Hispanic origin (detail)
- Mexican 4% Puerto Rican 10%
- Common ancestry
- Romanian 4% Lithuanian 3% Hispanic 2%
- Foreign-born
- 8% · Canada, Jamaica, China
- Languages at home
- 81% English-only · Spanish 13% Other Indo-European 4% Arabic 1%
Political lean MEDSL · Camden
- 2024 margin
- Strong D (+27.4) · D 63.0% · R 35.5% · Other 1.5%
- 2008→2024 swing
- -8.8pp toward R · 2008: 36.2pp · 2024: 27.4pp
- All cycles
- 2024: D+27.4 2020: D+33.5 2016: D+32.4 2012: D+36.6 2008: D+36.2
Not yet ingested
- Civics
- —
Market trends
- HPI YoY
- ▼ -115.59%
- Current HPI
- 298.9139
- Rent YoY
- —
- Metro
- Philadelphia-Camden-Wilmington, PA-NJ-DE-MD
- State GDP YoY
- ▲ 2.05%
- F500 in state
- 34
Industry mix (Fortune 500 HQ in NJ)
| Industry | F500 HQs | Revenue |
|---|---|---|
| Consumer Goods | 3 | $31B |
|
||
| Pharmaceuticals | 2 | $153B |
|
||
| Technology | 2 | $21B |
|
||
| Insurance | 2 | $20B |
|
||
| Healthcare | 2 | $19B |
|
||
| Financial Services | 1 | $70B |
|
||
Price history
-20.1% since first listed9 events — show timeline
- 2026-05-22 Pending — BRIGHT MLS
- 2026-05-18 Relisted — BRIGHT MLS
- 2026-05-11 Pending — BRIGHT MLS
- 2026-04-23 Price Changed $119,900 BRIGHT MLS
- 2026-04-14 Relisted — BRIGHT MLS
- 2026-04-03 Contingent — BRIGHT MLS
- 2026-03-17 Price Changed $129,900 BRIGHT MLS
- 2026-02-22 Price Changed $139,900 BRIGHT MLS
- 2026-01-25 Listed $150,000 BRIGHT MLS
Cash-flow waterfall
monthlySold comps — $/sqft
last 12 mo · ≤1 miLoading sold comps…