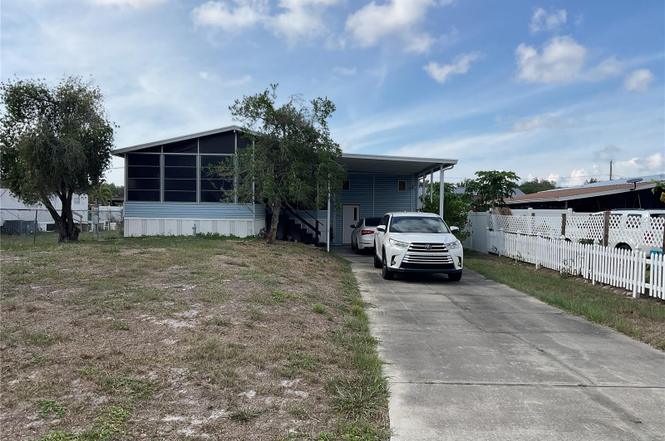
2607 Universal Dr · Ruskin, FL
Flood risk 1/10 · Minimal
- FEMA flood zone
- X (unshaded)
- Chance of flooding over 30 yrs
- 0.0%
- Est. flood insurance / yr
- $507 – $1,088
Fire risk 3/10 · Minor
- Est. fire insurance / yr
- $947 – $1,759
Heat risk 10/10 · Severe
- Hot days now (above 107°F)
- 7 days/yr
- Hot days in 30 yrs
- 28 days/yr
Wind risk 10/10 · Severe
- Chance of severe wind over 30 yrs
- 99.0%
Air-quality risk 3/10 · Minor
- Unhealthy air days now
- 3 days/yr
- Unhealthy air days in 30 yrs
- 4 days/yr
Risk factors via First Street. Map © Google.
Why this score? — see what drove the C+ grade
The composite is a weighted blend of 9 inputs, each scored 0–100. Each bar is that input's sub-score; the figure is the points it added to the 100-point composite (weight × sub-score).
- Cash flow +27.2/30.0
- DSCR +9.5/10.0
- ARV discount +7.5/15.0
- 1% rule +7.0/10.0
- Schools +4.2/10.0
- Livability +3.6/5.0
- Rent growth +2.7/5.0
- Condition / age +2.5/5.0
- Appreciation +0.0/10.0
$150,000
🖨 Deal sheet (PDF) 📄 Offer letter ✓ Due diligence
Listing remarks
TURN-KEY & MOVE-IN READY! Come tour this 2-bedroom, 2-bathroom, 1,144 sq. ft. 1990 double-wide mobile home. It offers a nicely stocked kitchen with various appliances remaining for buyer's convenience, a gas stove, eat-in island, and convenient walk-thru to dining area. The INDOOR washer/dryer is right off the kitchen, and the primary suite is quite spacious and equipped with an en-suite bath walk and walk-in shower. The second bedroom is currently being utilized as an office, and the guest bath has a bathtub. Enjoy additional living space in the 13x15 Florida Room, or head outside to the backyard patio slab, perfect for outdoor seating. The property is fenced on three sides, making i
Key facts
- Eat-in island
- Gas stove
- En-suite bath
Tags
Property features AI
Finance
- Other: Turnkey furnished; Lot about 0.17 acres (approx. 60 x 126)
- Financial info: Homestead exemption applied
- HOA & community: No association fees
Exterior
- Parking: Carport (1 space); Garage space approximately 40 x 13
- Utilities: Well water; Sewer: Other; Cable available; High-speed/BB Internet available; Electricity connected; Natural gas connected; Solar energy generation
- Home design: Manufactured double-wide home; Single-story (one level); South-facing
- Construction: Vinyl siding; Shingle roof; Crawlspace foundation; Redman make
- Exterior features: Awning(s); Workshop on property; Asphalt road access
Interior
- Kitchen: Electric water heater
- Bedrooms: 2 bedrooms
- Flooring: Carpet; Linoleum
- Bathrooms: 2 full bathrooms
- Heating & cooling: Central heating; Central air conditioning
- Interior features: Ceiling fans; Eat-in kitchen; Living room / dining room combo; Walk-in closets; Blinds and drapes
- Laundry & utility: Laundry room; Washer and dryer included; Inside utility room
Neighborhood map
What this means for you Summary
Snapshot
- This is a 2-bed/2.0-bath manufactured listed at $150k.
Deal economics
- At list price, monthly cash flow is $430 ($5k/yr) — positive.
- The deal already cash-flows at list — no discount required.
- Meets the 1% rule at list price ($2k rent vs $150k).
- Cap rate 9.7% vs local median 4.7% in Ruskin — top-decile yield for the area; either an underpriced asset or a hidden risk that comps aren't pricing in. Stress-test before assuming the spread holds.
Location & tenants
- Location reads 71/100 on livability (#392 in FL) — a middle-class / working-renter tenant base. Strengths: cost of living A+, housing A+, commute B+; Watch: amenities F, health & safety F.
- Hillsborough (suburban): math 47% / reading 50% proficiency, ranked #41 of 73 in FL (top 56%) — families likely to look elsewhere, expect single-tenant / working-renter base with shorter leases.
- Zoned schools: Lennard High School (math 30% / reading 46%, grade F, #328 of 667 statewide, top 50%, 2,404 students, 47% FRL).
- Market conditions: Rents flat; 489 active listings in the ZIP; 1 comparable units currently listed for rent nearby; 9,053 units permitted in Hillsborough County in 2024 (4,555 in 5+ unit buildings).
Forward outlook
- Local home prices are declining (-3.0%/yr); year-one equity from $1k of loan paydown is wiped out by about $4k of value loss. Plan a longer hold.
- Hillsborough County population projected at +37% by 2050 — long-run rental-demand tailwind backs the buy-and-hold thesis.
Negotiation context
- Only 1 days on market — expect competitive offers; lowballing is unlikely to land.
- Current owner paid $52k; list at $150k implies a 188% gain — meaningful room to come down on a strong offer.
Risks & watch-outs
- Climate carrying-cost: severe wind risk, 99% chance of damaging wind over 30y; extreme-heat days projected 7→28/yr by 2055 (HVAC capex compounding) — expect insurance premiums to compound above CPI over the hold.
Questions for the listing agent
- Is there a deadline driving the sale (1031 exchange, divorce, estate, relocation)? That informs how much negotiation room exists.
- Schools are F-rated, which usually means shorter tenancies and higher turnover. Who's the typical renter profile here, and what's been the actual vacancy rate?
- What's the average days-on-market for RENTAL listings here right now (not sales)? A rising rental-DOM trend means longer vacancies and softer asking-rent achievability than the comps imply.
- What's the recent tenant-quality profile in this submarket — average credit score on applications, eviction rate, late-payment / NSF rate, and stable-employment percentage? A property-management company in the area should have these aggregated.
- How much new for-sale + rental construction is in the pipeline within 1–3 miles? Heavy new supply typically softens prices + rents 12–24 months out; constrained supply supports both.
Investment metrics
- 1% rule
- 1.20% ✓
- Cap rate
- 9.73%
- Cash-on-cash
- 12.29%
- DSCR
- 1.55
- GRM
- 7.0
CMA / ARV
No comps found within radius.
Projected returns pro-forma
-3.0% appreciation · 0.9% rent growth · sell at horizon
- IRR
- -0.4%
- Equity multiple
- 0.99×
- Total profit
- $-625
- Equity at exit
- $22,365
- IRR
- 7.0%
- Equity multiple
- 1.48×
- Total profit
- $20,116
- Equity at exit
- $12,969
Cash invested: $42,000 (down + closing). Projections, not guarantees.
Landlord ↔ Tenant lean methodology
- Overall (STATE)
- 87 Strongly Landlord-Friendly
- State Florida
- 87 Strongly Landlord-Friendly · R+3
- County
- — inherits STATE
- City
- — inherits STATE
ZIP-level market 33570
- Home prices YoY
- -28.8%
- Rents YoY
- 0.9%
- Active inventory
- 489
- Price-to-rent
- 7.0×
Monthly cashflow live
- Estimated rent
- $1,794 medium interval (Pro) →
- Mortgage (P&I)
- −$787
- Tax from tax record
- −$138 /mo · $1,651/yr
- Insurance
- −$62
- HOA
- −$0
- Vacancy / Maint / Mgmt
- −$377
- Net cashflow
- $430
Break-even live
Sensitivity live
| Price | -10% $515 | -5% $473 | +0% $430 | +5% $388 | +10% $345 |
|---|---|---|---|---|---|
| Rent | -10% $288 | -5% $359 | +0% $430 | +5% $501 | +10% $572 |
| Rate | -1.0pp $506 | -0.5pp $468 | base $430 | +0.5pp $391 | +1.0pp $352 |
UW: 25.0% down · 7.5% · 30yr · 1.5% tax · 5.0% vac · 8.0% maint · 8.0% mgmt
Financing live
Cash to close
- Down payment
- $37,500
- Closing costs
- $4,500
- Reserves months
- —
- Total cash needed
- —
Loan-product check · same deal, 3 products live
Conventional
25% down · 7.5% · 30yr
- Down + closing
- —
- Monthly P&I
- —
- Monthly cashflow
- —
- DSCR
- —
- Eligible?
- —
Personal DTI + credit; lowest rate.
DSCR
20% down · 8.5% · 30yr
- Down + closing
- —
- Monthly P&I
- —
- Monthly cashflow
- —
- DSCR
- —
- Eligible?
- —
No personal income docs; deal must DSCR.
Hard money
10% down · 12.0% · 12mo
- Down + closing
- —
- Monthly P&I
- —
- Monthly cashflow
- —
- DSCR
- —
- Eligible?
- —
Short-term bridge; refi at stabilization.
Rent comps 1 comps
| Address | Beds | Baths | Sqft | Rent | $/sqft | DOM | Units | Dist |
|---|---|---|---|---|---|---|---|---|
| 419 Frances Cir Ruskin, FL | 2.0 | 2.0 | 1421 | $1,300 | $0.91 | 25d | 1 | 1.49mi |
Listing history 2 events
-
2026-06-17remarks 695-char remark
-
2026-06-17$150,000 Active 1 DOM
ⓘ Source: listings_history table (triggers on properties + properties_extension) + one-shot
backfill from property_details.listing_events for pre-trigger history.
Tax reassessment forecast FL · Resets to sale price
- Current annual tax
- $1,651 · $138/mo
- Projected year-2 tax
- $1,651 · $138/mo
- Expected delta
- $0/yr ($0/mo · 0.0%)
ⓘ Screening estimate from a state-policy table — verify with the county assessor before closing.
Climate risk First Street
- Flood 1/10 Low FEMA zone X (unshaded) · 0% chance over 30 yrs
- Wildfire 3/10 Moderate
- Heat 10/10 Extreme 7 d/yr ≥107°F today · 28 d/yr by 30 yrs out
- Wind 10/10 Extreme 99% chance of damaging wind over 30 yrs
- Air quality 3/10 Moderate 3 unhealthy d/yr today · 4 by 30 yrs out
Nearby sold comps map
Loading sold comps map…
Walkable amenities ~0.75 mi
Loading nearby amenities…
Taxation est. · year 1
- Rental income
- $21,522
- − Mortgage interest
- −$8,402
- − Property taxes
- −$1,651
- − Insurance
- −$750
- − Repairs & maintenance
- −$1,722
- − Management
- −$1,722
- − Depreciation
- −$4,364
- Taxable income
- $2,911
- Est. tax owed @ 24.0%
- −$699
- After-tax cash flow
- $4,463/yr
For passive investors: Depreciation is non-cash, so a rental often shows a tax loss while cash-flowing — sheltering income. Rental losses are passive: they offset passive income freely, and up to $25,000/yr can offset ordinary (W-2) income if you actively participate and your MAGI is under $100k (phasing out to $0 by $150k); unused losses carry forward. On sale, claimed depreciation is recaptured at up to 25%, and gains may owe capital-gains tax (a 1031 exchange can defer both). Figures are a year-1 estimate at your 24.0% rate — not tax advice; consult a CPA.
Schools (NCES district)
- District
- Hillsborough
- NCES district ID
- 1200870
- Math proficiency
- 47% ▼ -8.00%
- Reading proficiency
- 50% ▼ -4.00%
- Median HH income
- $50,622
- Composite
- 41.6/100
- National rank
- #3435
- State rank
- #41 of 73 in FL
Livability — Ruskin
- Score
- 71/100
- State rank
- #392
- US rank
- #6879
Category grades
Schools grade is shown separately in the Schools card above.
Census & demographics
- County
- Hillsborough County · 1,540,968 people
- City population
- 33,319
- Metro
- Tampa-St. Petersburg-Clearwater, FL
- Population (ZIP)
- 33,319
- Household income
- $72,172
- Rent vs Own
- Severe rent burden
- 611.0
Population outlook (Hillsborough County) Hauer SSP2
- Today (2025)
- 1,607,022 people
- By 2030
- 1,733,968 · +7.9%
- By 2040
- 1,979,565 · +23.2%
- By 2050
- 2,203,427 · +37.1%
- By 2075
- 2,667,893 · +66.0%
- By 2100
- 2,891,558 · +79.9%
Race, ethnicity, and origin ACS 2023
- Neighborhood character
- Diverse neighborhood (Simpson 0.69)
- Race & ethnicity
- White 40% Hispanic / Latino 32% Black 23% Two or more races 13% Asian 2%
- Hispanic origin (detail)
- Mexican 16% Puerto Rican 6% Cuban 1% Dominican 4%
- Common ancestry
- Italian 2% Romanian 2% Hispanic 2%
- Foreign-born
- 13% · Canada, Jamaica
- Languages at home
- 72% English-only · Spanish 23% French/Haitian/Cajun 2%
Political lean MEDSL · Hillsborough
- 2024 margin
- Toss-up / Even · D 47.8% · R 50.9% · Other 1.3%
- 2008→2024 swing
- -10.2pp toward R · 2008: 7.1pp · 2024: -3.1pp
- All cycles
- 2024: R+3.1 2020: D+6.9 2016: D+6.8 2012: D+6.7 2008: D+7.1
Not yet ingested
- Civics
- —
Market trends
- HPI YoY
- ▼ -112.10%
- Current HPI
- 277.8257
- Rent YoY
- ▲ 0.90%
- Metro
- Tampa-St. Petersburg-Clearwater, FL
- State GDP YoY
- ▲ 3.28%
- F500 in state
- 36
Industry mix (Fortune 500 HQ in FL)
| Industry | F500 HQs | Revenue |
|---|---|---|
| Industrial Technology | 2 | $29B |
|
||
| Insurance | 2 | $17B |
|
||
| Retail | 1 | $60B |
|
||
| Technology Distribution | 1 | $58B |
|
||
| Homebuilding | 1 | $35B |
|
||
| Technology Manufacturing | 1 | $35B |
|
||
Price history
+1775.0% since first listed3 events — show timeline
- 2026-06-17 Listed $150,000 Stellar MLS as Distributed by MLS Grid
- 1996-10-01 Sold (Public Records) $52,000 Public Records
- 1990-03-01 Sold (Public Records) $8,000 Public Records
Property tax history
+9.5%/yrLatest (2025): $1,651 · +9.7% YoY. Source: county tax records.
Cash-flow waterfall
monthlySold comps — $/sqft
last 12 mo · ≤1 miLoading sold comps…