10503 Winchester Ct · Iona, FL
Flood risk 9/10 · Severe
- FEMA flood zone
- AE
- Chance of flooding over 30 yrs
- 0.99%
- Est. flood insurance / yr
- $1,737 – $8,500
Fire risk 3/10 · Minor
- Est. fire insurance / yr
- $947 – $1,759
Heat risk 10/10 · Severe
- Hot days now (above 107°F)
- 7 days/yr
- Hot days in 30 yrs
- 29 days/yr
Wind risk 10/10 · Severe
- Chance of severe wind over 30 yrs
- 99.0%
Air-quality risk 2/10 · Minimal
- Unhealthy air days now
- 1 days/yr
- Unhealthy air days in 30 yrs
- 1 days/yr
Risk factors via First Street. Map © Google.
Why this score? — see what drove the C+ grade
The composite is a weighted blend of 9 inputs, each scored 0–100. Each bar is that input's sub-score; the figure is the points it added to the 100-point composite (weight × sub-score).
- Cash flow +24.6/30.0
- ARV discount +8.5/15.0
- DSCR +7.9/10.0
- 1% rule +7.5/10.0
- Schools +4.1/10.0
- Livability +3.6/5.0
- Condition / age +2.5/5.0
- Rent growth +2.2/5.0
- Appreciation +0.0/10.0
$169,500
🖨 Deal sheet 📄 Offer letter ✓ Due diligence
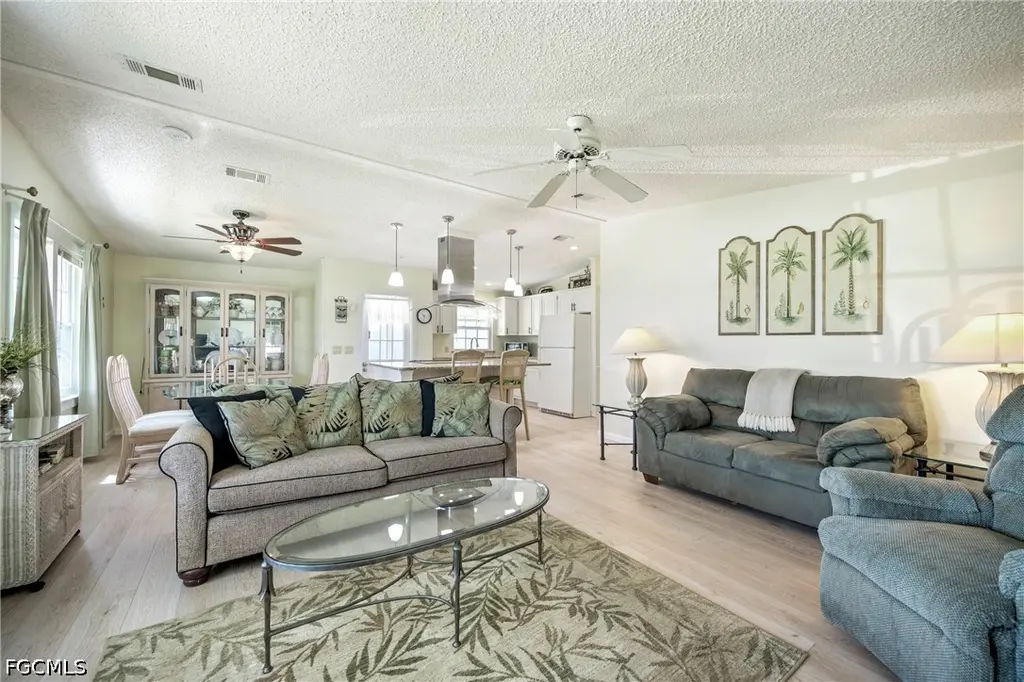
Listing remarks MLS
This turnkey unit in Lee Plantation has lots of upgrades, and a huge lot. It has new thermopane windows, siding and insulation on the exterior walls, fesh paint on the driveway, vaulted ceilings, plumbing and exterior wiring. Located near both Sanibel and Captiva, you can bring your toothbrush and clothing and move right in. Lee Plantation has a beautiful clubhouse along with pool, spa, tennis, lake, billiards, card room, sauna, and library.
Key facts
- Gated community
- Move-in ready
- Private oasis
Tags
Property features AI
Finance
- Financial info: Pets allowed conditionally (call); maximum 1 pet up to 25 lbs
- HOA & community: Homeowners association (quarterly fee); Association fee includes management, irrigation water, grounds maintenance, recreation facilities, reserve fund, road maintenance, street lights, and trash; Community amenities include clubhouse, fitness center, pool, spa/hot tub, tennis courts, pickleball, shuffleboard, bocce, billiards/hobby room, barbecue/picnic area, and management; Gated senior community with street lights; Approximately 150 units in the community
Exterior
- Parking: Attached carport with 2 covered spaces; Driveway (paved)
- Security: Gated community; Security gate; Key card entry
- Utilities: Public water; Public sewer; Cable available
- Home design: Manufactured home; Single-story; Entry level: 1; Faces southwest
- Construction: Vinyl siding; Shingle roof; Manufactured construction
- Exterior features: Storage; Shutters (manual); Community pool; Paved road; Rectangular lot; Northeast exposure; Irrigation from municipal source
Interior
- Kitchen: Electric cooktop; Self-cleaning oven; Microwave; Refrigerator; Freezer
- Bedrooms: Bedroom on main level; Florida room
- Flooring: Tile; Vinyl
- Bathrooms: 2 full bathrooms
- Heating & cooling: Central heating (electric); Ceiling fan(s)
- Interior features: Furnished; Family/Dining room; Living/Dining room combination; Kitchen island; Cable TV available; High-speed internet available; Window coverings; Tinted windows; Single hung and sliding windows; Shower only / separate shower
- Laundry & utility: Washer; Dryer
Neighborhood map
What this means for you Summary
Snapshot
- This is a 2-bed/2.0-bath manufactured listed at $170k.
Deal economics
- At list price, monthly cash flow is $-77 ($-924/yr) — negative.
- To cash-flow at today's rent, offer at most $156k (8.0% below list).
- Meets the 1% rule at list price ($2k rent vs $170k).
- Recommended offer: $156k (8.0% below list) — sets the bar for cash-flow.
- Cap rate 8.8% vs local median 2.1% in Iona — top-decile yield for the area; either an underpriced asset or a hidden risk that comps aren't pricing in. Stress-test before assuming the spread holds.
Location & tenants
- Location reads 72/100 on livability (#359 in FL) — a middle-class / working-renter tenant base. Strengths: crime A+, housing A, health & safety A; Watch: schools D-, amenities F, commute F.
- Lee (suburban): math 47% / reading 50% proficiency, ranked #42 of 73 in FL (top 58%) — families likely to look elsewhere, expect single-tenant / working-renter base with shorter leases.
- Market conditions: Rents soft (-1.2%/yr); 1244 active listings in the ZIP; 40 comparable units currently listed for rent nearby; rentals at typical pace (median 21d on market — plan ~3-4 weeks tenant-placement turnaround); solid renter incomes; 15,411 units permitted in Lee County in 2024 (4,686 in 5+ unit buildings).
- This rent runs 34% of the median local income ($75k/yr) — at the standard rent-burdened threshold; future hikes will face affordability resistance.
Forward outlook
- Local home prices are declining (-3.0%/yr); year-one equity from $1k of loan paydown is wiped out by about $5k of value loss. Plan a longer hold.
- Lee County population projected at +44% by 2050 — long-run rental-demand tailwind backs the buy-and-hold thesis.
Negotiation context
- Only 6 days on market — expect competitive offers; lowballing is unlikely to land.
- Current owner paid $112k; list at $170k implies a 51% gain — meaningful room to come down on a strong offer.
Risks & watch-outs
- Watch-outs: flood insurance adds $427/mo.
- Climate carrying-cost: in FEMA flood zone AE (mandatory federal flood insurance); severe wind risk, 99% chance of damaging wind over 30y; extreme-heat days projected 7→29/yr by 2055 (HVAC capex compounding) — expect insurance premiums to compound above CPI over the hold.
Questions for the listing agent
- What do current leases actually rent for vs. the listed asking? Can we see a recent rent roll and the last 12 months of T-12 income?
- What's the actual annual flood-insurance premium (NFIP or private), and is the property in a SFHA with mandatory coverage?
- What does the HOA fee cover, when was the last increase, and are there any pending special assessments or reserve-fund shortfalls?
- Is there a deadline driving the sale (1031 exchange, divorce, estate, relocation)? That informs how much negotiation room exists.
- Schools are D-rated, which usually means shorter tenancies and higher turnover. Who's the typical renter profile here, and what's been the actual vacancy rate?
- What's the average days-on-market for RENTAL listings here right now (not sales)? A rising rental-DOM trend means longer vacancies and softer asking-rent achievability than the comps imply.
- What's the recent tenant-quality profile in this submarket — average credit score on applications, eviction rate, late-payment / NSF rate, and stable-employment percentage? A property-management company in the area should have these aggregated.
- How much new for-sale + rental construction is in the pipeline within 1–3 miles? Heavy new supply typically softens prices + rents 12–24 months out; constrained supply supports both.
Investment metrics
- 1% rule
- 1.25% ✓
- Cap rate
- 8.77%
- Cash-on-cash
- 8.84%
- DSCR
- 1.39
- GRM
- 6.7
CMA / ARV
- ARV (on-the-fly)
- $173,178
- Comps found
- 5
Show comp detail 5 sales within ~0.75 mi
| Address | Dist | Beds/Ba | Sqft | Sold | Price | $/sf | Match |
|---|---|---|---|---|---|---|---|
| 10503 Winchester Ct | 0.00mi | 2/2.0 | 1,069 (0%) | 1mo | $169,500 | $159 | 99 |
| 318 Rosa Lee Ave | 0.44mi | 2/2.0 | 1,080 (+1%) | 7mo | $239,500 | $222 | 72 |
| 287 Dillard Ave | 0.41mi | 2/2.0 | 921 (-14%) | 2mo | $190,000 | $206 | 56 |
| 11 Derwent Blvd | 0.68mi | 2/2.0 | 1,176 (+10%) | 4mo | $110,000 | $94 | 48 |
| 16070 Siesta Dr | 0.72mi | 2/2.0 | 950 (-11%) | 18mo | $154,000 | $162 | 32 |
Match score weights: distance 35% · size 25% · config 20% · recency 20%. Top-matched comps best support the ARV.
Projected returns pro-forma
-3.0% appreciation · 0.0% rent growth · sell at horizon
- IRR
- -24.5%
- Equity multiple
- 0.20×
- Total profit
- $-38,188
- Equity at exit
- $25,273
- IRR
- -44.3%
- Equity multiple
- -0.31×
- Total profit
- $-61,968
- Equity at exit
- $14,655
Cash invested: $47,460 (down + closing). Projections, not guarantees.
Landlord ↔ Tenant lean methodology
- Overall (STATE)
- 87 Strongly Landlord-Friendly
- State Florida
- 87 Strongly Landlord-Friendly · R+3
- County
- — inherits STATE
- City
- — inherits STATE
ZIP-level market 33908
- Home prices YoY
- -32.8%
- Rents YoY
- -1.2%
- Active inventory
- 1244
- Price-to-rent
- 6.7×
Monthly cashflow live
- Estimated rent
- $2,116 high interval (Pro) →
- Mortgage (P&I)
- −$889
- Tax from tax record
- −$188 /mo · $2,255/yr
- Insurance
- −$71
- Flood insurance flood zone
- −$427 /mo · $5,118/yr
- HOA
- −$175
- Vacancy / Maint / Mgmt
- −$444
- Net cashflow
- $-77
Break-even live
UW: 25.0% down · 7.5% · 30yr · 1.5% tax · 5.0% vac · 8.0% maint · 8.0% mgmt
Financing live
Cash to close
- Down payment
- $42,375
- Closing costs
- $5,085
- Reserves months
- —
- Total cash needed
- —
Loan-product check · same deal, 3 products live
Conventional
25% down · 7.5% · 30yr
- Down + closing
- —
- Monthly P&I
- —
- Monthly cashflow
- —
- DSCR
- —
- Eligible?
- —
Personal DTI + credit; lowest rate.
DSCR
20% down · 8.5% · 30yr
- Down + closing
- —
- Monthly P&I
- —
- Monthly cashflow
- —
- DSCR
- —
- Eligible?
- —
No personal income docs; deal must DSCR.
Hard money
10% down · 12.0% · 12mo
- Down + closing
- —
- Monthly P&I
- —
- Monthly cashflow
- —
- DSCR
- —
- Eligible?
- —
Short-term bridge; refi at stabilization.
Rent comps 40 comps
| Address | Beds | Baths | Sqft | Rent | $/sqft | DOM | Units | Dist |
|---|---|---|---|---|---|---|---|---|
| 16645 Lake Circle Dr #732 Fort Myers, FL | 2.0 | 2.0 | 1154 | $4,000 | $3.47 | 23d | 1 | 0.23mi |
| 16635 Lake Circle Dr Fort Myers, FL | 2.0 | 2.0 | 1277 | $2,150 | $1.68 | 16d | 2 | 0.24mi |
| 16625 Lake Circle Dr #523 Fort Myers, FL | 2.0 | 2.0 | 1154 | $2,100 | $1.82 | 23d | 1 | 0.29mi |
| 16685 Lake Circle Dr Fort Myers, FL | 2.0 | 2.0 | 1228 | $2,000 | $1.63 | 23d | 2 | 0.31mi |
| 11021 Gulf Reflections Dr Fort Myers, FL | 2.0–3.0 | 2.0 | 1674 | $2,600 | $1.55 | 23d | 2 | 0.44mi |
| 11021 Gulf Reflections Dr #303 Fort Myers, FL | 2.0 | 2.0 | 1500 | $4,200 | $2.80 | 3d | 1 | 0.44mi |
| 11041 Gulf Reflections Dr #305 Fort Myers, FL | 2.0 | 2.0 | 1500 | $1,800 | $1.20 | 23d | 1 | 0.49mi |
| 11093 Kelly Rd Fort Myers, FL | 2.0 | 1.0 | 830 | $2,000 | $2.41 | 21d | 1 | 0.58mi |
| 11262 Summerwinds Ct Fort Myers, FL | 2.0 | 1.0 | 1049 | $1,699 | $1.62 | 21d | 1 | 0.63mi |
| 11298 Summerwinds Ct Fort Myers, FL | 2.0 | 1.0 | 861 | $1,599 | $1.86 | 21d | 1 | 0.66mi |
| 11389 Summerwinds Ct Fort Myers, FL | 2.0 | 1.0 | 927 | $1,599 | $1.72 | 21d | 1 | 0.73mi |
| 16841 Juanita Ave Unit B Fort Myers, FL | 2.0 | 1.0 | 840 | $1,845 | $2.20 | 23d | 1 | 0.77mi |
| 11460 Summerwinds Ct Fort Myers, FL | 2.0 | 1.0 | 912 | $1,699 | $1.86 | 21d | 1 | 0.79mi |
| 16901 Juanita Ave Fort Myers, FL | 2.0 | 1.0 | 780 | $1,500 | $1.92 | 23d | 1 | 0.80mi |
| 11430 Kimble Dr Unit 11432 front Fort Myers, FL | 2.0 | 1.0 | 700 | $1,300 | $1.86 | 3d | 1 | 0.87mi |
| 11430 Kimble Dr Unit 11430 front Fort Myers, FL | 2.0 | 1.0 | 700 | $1,295 | $1.85 | 3d | 1 | 0.87mi |
| 11451 Char Ann Dr Fort Myers, FL | 2.0 | 1.0 | 1300 | $1,950 | $1.50 | 1d | 1 | 0.91mi |
| 15773 Beachcomber Ave Unit 1264830P Fort Myers, FL | 3.0 | 2.0 | 1496 | $3,133 | $2.09 | 13d | 1 | 0.92mi |
| 11470 Char Ann Dr Fort Myers, FL | 2.0 | 1.0 | 834 | $1,200 | $1.44 | 3d | 1 | 0.92mi |
| 16890 Carmen Ave Unit 16902 Fort Myers, FL | 2.0 | 1.0 | 800 | $1,295 | $1.62 | 3d | 1 | 0.94mi |
| 15449 Bellamar Cir #1225 Fort Myers, FL | 3.0 | 2.0 | 1043 | $1,700 | $1.63 | 13d | 1 | 0.94mi |
| 16214 Via Solera Cir #5 Fort Myers, FL | 2.0 | 2.5 | 1300 | $1,750 | $1.35 | 23d | 1 | 0.95mi |
| 16910 Carmen Ave #16922 Fort Myers, FL | 2.0 | 1.0 | 780 | $1,400 | $1.79 | 23d | 1 | 0.95mi |
| 16920 Carmen Ave Fort Myers, FL | 2.0 | 1.0 | 800 | $1,300 | $1.62 | 23d | 1 | 0.95mi |
| 10743 Robinson St Fort Myers, FL | 3.0 | 2.0 | 1216 | $2,000 | $1.64 | 23d | 1 | 0.98mi |
| 15433 Bellamar Cir Fort Myers, FL | 3.0 | 2.0 | 1021 | $2,575 | $2.52 | 23d | 2 | 0.99mi |
| 15655 Ocean Walk Cir Fort Myers, FL | 1.0–2.0 | 1.0–2.0 | 856 | $3,200 | $3.74 | 14d | 2 | 1.00mi |
| 15645 Ocean Walk Cir Fort Myers, FL | 3.0 | 2.0 | 1287 | $3,699 | $2.87 | 2d | 2 | 1.00mi |
| 15645 Ocean Walk Cir Fort Myers, FL | 3.0 | 2.0 | 1227 | $2,774 | $2.26 | 3d | 3 | 1.00mi |
| 15430 Bellamar Cir Fort Myers, FL | 3.0 | 2.0 | 1043 | $2,400 | $2.30 | 16d | 2 | 1.00mi |
| 15430 Bellamar Cir #3023 Fort Myers, FL | 3.0 | 2.0 | 1043 | $3,500 | $3.36 | 3d | 1 | 1.01mi |
| 15430 Bellamar Cir Unit 1546283P Fort Myers, FL | 3.0 | 2.0 | 1033 | $1,873 | $1.81 | 14d | 1 | 1.01mi |
| 16580 Ginger Ln #3242 Fort Myers, FL | 2.0 | 2.0 | 982 | $1,800 | $1.83 | 23d | 1 | 1.02mi |
| 15585 Ocean Walk Cir #302 Fort Myers, FL | 1.0 | 1.0 | 828 | $1,700 | $2.05 | 23d | 1 | 1.03mi |
| 15417 Bellamar Cir #823 Fort Myers, FL | 3.0 | 2.0 | 1043 | $1,650 | $1.58 | 21d | 1 | 1.05mi |
| 15417 Bellamar Cir #823 Fort Myers, FL | 3.0 | 2.0 | 1043 | $1,650 | $1.58 | 23d | 1 | 1.05mi |
| 11400 Ocean Walk Ln Fort Myers, FL | 1.0–2.0 | 1.0–2.0 | 856 | $1,500 | $1.75 | 3d | 2 | 1.07mi |
| 15401 Bellamar Cir #621 Fort Myers, FL | 3.0 | 2.0 | 1040 | $1,700 | $1.63 | 11d | 1 | 1.09mi |
| 11540 Caravel Cir #3012 Fort Myers, FL | 2.0 | 2.0 | 1050 | $1,250 | $1.19 | 21d | 1 | 1.10mi |
| 15385 Bellamar Cir #413 Fort Myers, FL | 3.0 | 2.0 | 1043 | $1,600 | $1.53 | 23d | 1 | 1.10mi |
HOA detail
- Monthly dues
- $175 · $2,100/yr
- Likely covers
- pool
Listing history 10 events
-
2026-05-02status Pending
-
2026-04-26$169,500 Active
-
2013-05-16soldstatus $112,000
-
2013-05-09soldstatus $112,000 445-char remark
Show marketing remark (445 chars)
This turnkey unit in Lee Plantation has lots of upgrades, and a huge lot. It has new thermopane windows, siding and insulation on the exterior walls, fesh paint on the driveway, vaulted ceilings, plumbing and exterior wiring. Located near both Sanibel and Captiva, you can bring your toothbrush and clothing and move right in. Lee Plantation has a beautiful clubhouse along with pool, spa, tennis, lake, billiards, card room, sauna, and library.
-
2013-04-25price $124,900 445-char remark
Show marketing remark (445 chars)
This turnkey unit in Lee Plantation has lots of upgrades, and a huge lot. It has new thermopane windows, siding and insulation on the exterior walls, fesh paint on the driveway, vaulted ceilings, plumbing and exterior wiring. Located near both Sanibel and Captiva, you can bring your toothbrush and clothing and move right in. Lee Plantation has a beautiful clubhouse along with pool, spa, tennis, lake, billiards, card room, sauna, and library.
-
2003-01-03soldstatus $94,000
-
2002-12-19soldstatus $94,000
-
2002-11-07price $102,900
-
1999-08-11soldstatus $67,500
-
1994-07-12soldstatus $74,000
ⓘ Source: listings_history table (triggers on properties + properties_extension) + one-shot
backfill from property_details.listing_events for pre-trigger history.
Tax reassessment forecast FL · Resets to sale price
- Current annual tax
- $2,255 · $188/mo
- Projected year-2 tax
- $2,255 · $188/mo
- Expected delta
- $0/yr ($0/mo · 0.0%)
ⓘ Screening estimate from a state-policy table — verify with the county assessor before closing.
Climate risk First Street
- Flood 9/10 Extreme FEMA zone AE · 99% chance over 30 yrs
- Wildfire 3/10 Moderate
- Heat 10/10 Extreme 7 d/yr ≥107°F today · 29 d/yr by 30 yrs out
- Wind 10/10 Extreme 99% chance of damaging wind over 30 yrs
- Air quality 2/10 Low 1 unhealthy d/yr today · 1 by 30 yrs out
Nearby sold comps map
Loading sold comps map…
Walkable amenities ~0.75 mi
Loading nearby amenities…
Taxation est. · year 1
- Rental income
- $25,396
- − Mortgage interest
- −$9,495
- − Property taxes
- −$2,255
- − Insurance
- −$5,966
- − Repairs & maintenance
- −$2,032
- − Management
- −$2,032
- − HOA
- −$2,100
- − Depreciation
- −$4,931
- Taxable loss
- −$3,414
- Est. tax savings @ 24.0%
- +$819
- After-tax cash flow
- $-105/yr
For passive investors: Depreciation is non-cash, so a rental often shows a tax loss while cash-flowing — sheltering income. Rental losses are passive: they offset passive income freely, and up to $25,000/yr can offset ordinary (W-2) income if you actively participate and your MAGI is under $100k (phasing out to $0 by $150k); unused losses carry forward. On sale, claimed depreciation is recaptured at up to 25%, and gains may owe capital-gains tax (a 1031 exchange can defer both). Figures are a year-1 estimate at your 24.0% rate — not tax advice; consult a CPA.
Schools (NCES district)
- District
- Lee
- NCES district ID
- 1201080
- Math proficiency
- 47% ▼ -11.00%
- Reading proficiency
- 50% ▼ -4.00%
- Median HH income
- $49,518
- Composite
- 41.49/100
- National rank
- #3458
- State rank
- #42 of 73 in FL
Livability — Iona
- Score
- 72/100
- State rank
- #359
- US rank
- #6253
Category grades
Schools grade is shown separately in the Schools card above.
Census & demographics
- County
- Lee County · 788,662 people
- Metro
- Cape Coral-Fort Myers, FL
- Population (ZIP)
- 37,423
- Household income
- $75,396
- Rent vs Own
- Severe rent burden
- 1944.0
Population outlook (Lee County) Hauer SSP2
- Today (2025)
- 871,946 people
- By 2030
- 955,468 · +9.6%
- By 2040
- 1,113,587 · +27.7%
- By 2050
- 1,256,891 · +44.1%
- By 2075
- 1,560,270 · +78.9%
- By 2100
- 1,726,848 · +98.0%
Race, ethnicity, and origin ACS 2023
- Neighborhood character
- Predominantly White (88%)
- Race & ethnicity
- White 88% Hispanic / Latino 6% Two or more races 5% Black 3% Asian 1%
- Hispanic origin (detail)
- Mexican 1% Puerto Rican 2%
- Common ancestry
- Romanian 5% Lithuanian 4% Slovak 3%
- Foreign-born
- 10% · Canada, Jamaica
- Languages at home
- 90% English-only · Spanish 4% Russian/Polish/Slavic 1% Other Indo-European 1%
Political lean MEDSL · Lee
- 2024 margin
- Strong R (+28.4) · D 35.5% · R 63.9%
- 2008→2024 swing
- -18.0pp toward R · 2008: -10.4pp · 2024: -28.4pp
- All cycles
- 2024: R+28.4 2020: R+19.2 2016: R+20.4 2012: R+16.6 2008: R+10.4
Not yet ingested
- Civics
- —
Market trends
- HPI YoY
- ▼ -102.22%
- Current HPI
- 209.7595
- Rent YoY
- ▼ -1.18%
- Metro
- Cape Coral-Fort Myers, FL
- State GDP YoY
- ▲ 3.28%
- F500 in state
- 36
Industry mix (Fortune 500 HQ in FL)
| Industry | F500 HQs | Revenue |
|---|---|---|
| Industrial Technology | 2 | $29B |
|
||
| Insurance | 2 | $17B |
|
||
| Retail | 1 | $60B |
|
||
| Technology Distribution | 1 | $58B |
|
||
| Homebuilding | 1 | $35B |
|
||
| Technology Manufacturing | 1 | $35B |
|
||
Price history
+129.1% since first listed10 events — show timeline
- 2026-05-02 Pending — FORTMLS
- 2026-04-26 Listed $169,500 FORTMLS
- 2013-05-16 Sold (Public Records) $112,000 Public Records
- 2013-05-09 Sold (MLS) $112,000 FORTMLS
- 2013-04-25 Price Changed $124,900 FORTMLS
- 2003-01-03 Sold (Public Records) $94,000 Public Records
- 2002-12-19 Sold (MLS) $94,000 FORTMLS
- 2002-11-07 Price Changed $102,900 FORTMLS
- 1999-08-11 Sold (Public Records) $67,500 Public Records
- 1994-07-12 Sold (Public Records) $74,000 Public Records
Property tax history
+3.5%/yrLatest (2025): $2,255 · -10.2% YoY. Source: county tax records.
Cash-flow waterfall
monthlySold comps — $/sqft
last 12 mo · ≤1 miLoading sold comps…