8433 Hearth Dr · Houston, TX
Flood risk 8/10 · Major
- FEMA flood zone
- X (unshaded)
- Chance of flooding over 30 yrs
- 0.99%
- Est. flood insurance / yr
- $507 – $1,088
Fire risk 1/10 · Minimal
- Est. fire insurance / yr
- $1,222 – $2,270
Heat risk 9/10 · Severe
- Hot days now (above 109°F)
- 7 days/yr
- Hot days in 30 yrs
- 25 days/yr
Wind risk 9/10 · Severe
- Chance of severe wind over 30 yrs
- 99.0%
Air-quality risk 2/10 · Minimal
- Unhealthy air days now
- 2 days/yr
- Unhealthy air days in 30 yrs
- 2 days/yr
Risk factors via First Street. Map © Google.
Why this score? — see what drove the B grade
The composite is a weighted blend of 9 inputs, each scored 0–100. Each bar is that input's sub-score; the figure is the points it added to the 100-point composite (weight × sub-score).
- Cash flow +30.0/30.0
- 1% rule +10.0/10.0
- DSCR +10.0/10.0
- ARV discount +7.5/15.0
- Livability +3.7/5.0
- Appreciation +2.7/10.0
- Schools +2.7/10.0
- Condition / age +2.5/5.0
- Rent growth +1.8/5.0
$70,000
🖨 Deal sheet 📄 Offer letter ✓ Due diligence
Listing remarks
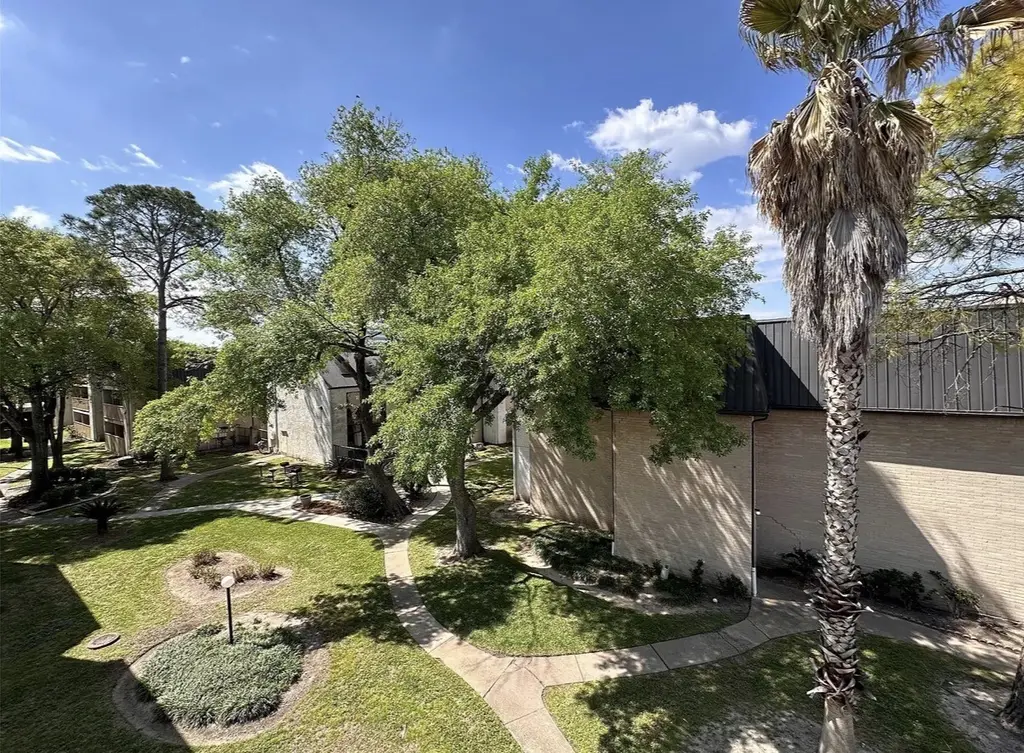
Prime location is the defining feature of this fantastic 2/1 condo! Enjoy the convenience of walking to NRG Stadium for major events, with easy access to the Galleria (15-minute drive), the vibrant Rice Village (10-minute drive), and the professional hub of Greenway Plaza (15-minute drive). This condo is ideal for young professionals, new residents, or anyone seeking an unbeatable city location. Plus, enjoy the peace and quiet with no upstairs neighbors! Submit all and best offers by June 11th!
Key facts
- Prime location
- $40 HOA
- Parking
Tags
Property features AI
Finance
- HOA & community: Community managed by PMG; Annual association fee; Association fee covers common areas, grounds maintenance, structure maintenance, recreation facilities, sewer, trash, and water; Community pool
Exterior
- Parking: Assigned parking
- Security: Gated community
- Utilities: Public water
- Home design: Residential property; Single-story; Built in 1979; Slab foundation
- Construction: Brick and wood siding construction
- Exterior features: Composition roof; Brick and wood siding exterior
Interior
- Kitchen: Dishwasher; Electric cooktop; Electric oven; Microwave
- Bedrooms: Two bedrooms — primary bedroom on the first floor, both approximately 12x10
- Bathrooms: One full bathroom
- Heating & cooling: Central heating (electric); Central air conditioning (electric)
- Interior features: Laundry in utility room, stacked configuration; Seller disclosure available
- Laundry & utility: Washer/dryer stacked in utility room
Neighborhood map
What this means for you Summary
Snapshot
- This is a 2-bed/1.0-bath condo listed at $70k.
Deal economics
- At list price, monthly cash flow is $224 ($3k/yr) — positive.
- The deal already cash-flows at list — no discount required.
- Meets the 1% rule at list price ($1k rent vs $70k).
- Cap rate 11.3% vs local median 3.2% in Houston — top-decile yield for the area; either an underpriced asset or a hidden risk that comps aren't pricing in. Stress-test before assuming the spread holds.
Location & tenants
- Location reads 74/100 on livability (#184 in TX, #4,771 nationally) — a middle-class / working-renter tenant base. Strengths: amenities A+, cost of living A+, housing A+; Watch: crime F.
- Houston ISD (urban): math 27% / reading 35% proficiency, ranked #593 of 826 in TX (top 72%) — families likely to look elsewhere, expect single-tenant / working-renter base with shorter leases; 71% free/reduced lunch — lower-income household profile, screen leases tightly.
- Zoned schools: Longfellow El (math 12% / reading 27%, grade F, #3,583 of 4,322 statewide, top 86%, 682 students, 75% FRL); Pershing Middle (math 36% / reading 49%, grade D-, #553 of 1,662 statewide, top 34%, 1,390 students, 60% FRL); Bellaire H S (math 45% / reading 62%, grade C-, #428 of 1,632 statewide, top 27%, 3,170 students, 48% FRL).
- Market conditions: Rents soft (-2.8%/yr); 268 active listings in the ZIP; 40 comparable units currently listed for rent nearby; rentals leasing fast (median 14d on market — plan ~1-2 weeks tenant-placement turnaround); 29,883 units permitted in Harris County in 2024 (8,621 in 5+ unit buildings).
Forward outlook
- Local home prices are declining (-3.0%/yr); year-one equity from $484 of loan paydown is wiped out by about $2k of value loss. Plan a longer hold.
- Harris County population projected at +47% by 2050 — long-run rental-demand tailwind backs the buy-and-hold thesis.
Negotiation context
- Only 7 days on market — expect competitive offers; lowballing is unlikely to land.
- 6 sale attempts since 20y ago with the ask held roughly flat each time — persistent listings suggest the price (not the market) is what's stuck; bring a comps-based counter.
Risks & watch-outs
- Watch-outs: flood insurance adds $66/mo.
- Climate carrying-cost: severe flood risk; severe wind risk, 99% chance of damaging wind over 30y; extreme-heat days projected 7→25/yr by 2055 (HVAC capex compounding) — expect insurance premiums to compound above CPI over the hold.
Questions for the listing agent
- Built in 1979 — when were the roof, HVAC, electrical panel, plumbing, and water heater last replaced?
- What's the actual annual flood-insurance premium (NFIP or private), and is the property in a SFHA with mandatory coverage?
- What does the HOA fee cover, when was the last increase, and are there any pending special assessments or reserve-fund shortfalls?
- Any open or pending special assessments — roof, HVAC, plumbing, elevator, façade? What's the per-unit balance and payoff schedule, and is the seller paying it off at close or rolling it to the buyer?
- Is there a deadline driving the sale (1031 exchange, divorce, estate, relocation)? That informs how much negotiation room exists.
- Schools are D-rated, which usually means shorter tenancies and higher turnover. Who's the typical renter profile here, and what's been the actual vacancy rate?
- Crime grade is F in this area — have there been break-ins, vandalism, or insurance claims at this property in the last 3 years? What carrier currently insures it and at what premium?
- What's the average days-on-market for RENTAL listings here right now (not sales)? A rising rental-DOM trend means longer vacancies and softer asking-rent achievability than the comps imply.
- What's the recent tenant-quality profile in this submarket — average credit score on applications, eviction rate, late-payment / NSF rate, and stable-employment percentage? A property-management company in the area should have these aggregated.
- How much new apartment / multifamily construction is in the pipeline within 1–3 miles? Heavy new supply (>2% of stock underway) typically softens rents 12–24 months out; light construction supports rent growth.
Investment metrics
- 1% rule
- 1.56% ✓
- Cap rate
- 11.27%
- Cash-on-cash
- 17.78%
- DSCR
- 1.79
- GRM
- 5.3
CMA / ARV
No comps found within radius.
Projected returns pro-forma
-3.0% appreciation · 0.0% rent growth · sell at horizon
- IRR
- -0.2%
- Equity multiple
- 0.99×
- Total profit
- $-174
- Equity at exit
- $10,437
- IRR
- 5.2%
- Equity multiple
- 1.32×
- Total profit
- $6,279
- Equity at exit
- $6,052
Cash invested: $19,600 (down + closing). Projections, not guarantees.
Landlord ↔ Tenant lean methodology
- Overall (STATE)
- 87 Strongly Landlord-Friendly
- State Texas
- 87 Strongly Landlord-Friendly · R+5
- County
- — inherits STATE
- City
- — inherits STATE
ZIP-level market 77054
- Home prices YoY
- -2.6%
- Rents YoY
- -2.8%
- Active inventory
- 268
- Price-to-rent
- 5.3×
Monthly cashflow live
- Estimated rent
- $1,095 high interval (Pro) →
- Mortgage (P&I)
- −$367
- Tax from tax record
- −$138 /mo · $1,657/yr
- Insurance
- −$29
- Flood insurance flood zone
- −$66 /mo · $798/yr
- HOA
- −$40
- Vacancy / Maint / Mgmt
- −$230
- Net cashflow
- $224
Break-even live
UW: 25.0% down · 7.5% · 30yr · 1.5% tax · 5.0% vac · 8.0% maint · 8.0% mgmt
Financing live
Cash to close
- Down payment
- $17,500
- Closing costs
- $2,100
- Reserves months
- —
- Total cash needed
- —
Loan-product check · same deal, 3 products live
Conventional
25% down · 7.5% · 30yr
- Down + closing
- —
- Monthly P&I
- —
- Monthly cashflow
- —
- DSCR
- —
- Eligible?
- —
Personal DTI + credit; lowest rate.
DSCR
20% down · 8.5% · 30yr
- Down + closing
- —
- Monthly P&I
- —
- Monthly cashflow
- —
- DSCR
- —
- Eligible?
- —
No personal income docs; deal must DSCR.
Hard money
10% down · 12.0% · 12mo
- Down + closing
- —
- Monthly P&I
- —
- Monthly cashflow
- —
- DSCR
- —
- Eligible?
- —
Short-term bridge; refi at stabilization.
Rent comps 40 comps
| Address | Beds | Baths | Sqft | Rent | $/sqft | DOM | Units | Dist |
|---|---|---|---|---|---|---|---|---|
| 8435 Hearth Dr Houston, TX | 2.0 | 2.0 | 1040 | $950 | $0.91 | 43d | 1 | 0.01mi |
| 8521 Hearth Dr Houston, TX | 2.0 | 2.0 | 1092 | $1,195 | $1.09 | 43d | 1 | 0.05mi |
| 2501 Westridge St Houston, TX | 1.0 | 1.0 | 545 | $773 | $1.42 | 12d | 1 | 0.07mi |
| 2501 Westridge St Unit 2522 Houston, TX | 1.0 | 1.0 | 545 | $819 | $1.50 | 13d | 1 | 0.09mi |
| 2501 Westridge St Unit 1162 Houston, TX | 1.0 | 1.0 | 545 | $784 | $1.44 | 5d | 1 | 0.09mi |
| 2501 Westridge St Unit 2558 Houston, TX | 2.0 | 2.0 | 1005 | $1,231 | $1.22 | 3d | 1 | 0.09mi |
| 2501 Westridge St Unit 2575 Houston, TX | 1.0 | 1.0 | 545 | $781 | $1.43 | 2d | 1 | 0.09mi |
| 2501 Westridge St Unit 424 Houston, TX | 2.0 | 2.0 | 1005 | $1,239 | $1.23 | 5d | 1 | 0.09mi |
| 2501 Westridge St Unit 422 Houston, TX | 2.0 | 2.0 | 1005 | $1,239 | $1.23 | 7d | 1 | 0.09mi |
| 2501 Westridge St Unit 321 Houston, TX | 1.0 | 1.0 | 545 | $784 | $1.44 | 7d | 1 | 0.09mi |
| 2501 Westridge St Unit 1047 Houston, TX | 1.0 | 1.0 | 545 | $824 | $1.51 | 11d | 1 | 0.10mi |
| 2501 Westridge St Unit 2047 Houston, TX | 2.0 | 2.0 | 1005 | $1,274 | $1.27 | 11d | 1 | 0.10mi |
| 2820 S Bartell Dr Houston, TX | 1.0 | 1.0 | 780 | $850 | $1.09 | 43d | 3 | 0.13mi |
| 2600 Westridge St Houston, TX | 1.0–2.0 | 1.0–2.0 | 790 | $1,349 | $1.71 | 1d | 73 | 0.14mi |
| 2401 Westridge St Houston, TX | 1.0 | 1.0 | 602 | $924 | $1.53 | 12d | 1 | 0.16mi |
| 2401 Westridge St Houston, TX | 1.0–2.0 | 1.0–2.0 | 723 | $1,250 | $1.73 | 7d | 30 | 0.16mi |
| 2407 Westridge St Houston, TX | 2.0 | 2.0 | 975 | $1,199 | $1.23 | 43d | 1 | 0.16mi |
| 2401 Westridge St Unit 425 Houston, TX | 2.0 | 2.0 | 812 | $1,013 | $1.25 | 11d | 1 | 0.17mi |
| 2401 Westridge St Unit 2-2008 Houston, TX | 2.0 | 2.0 | 844 | $950 | $1.13 | 44d | 1 | 0.17mi |
| 2401 Westridge St Unit 2112 Houston, TX | 2.0 | 2.0 | 812 | $1,019 | $1.25 | 7d | 1 | 0.17mi |
| 2401 Westridge St Unit 2422 Houston, TX | 1.0 | 1.0 | 602 | $974 | $1.62 | 10d | 1 | 0.17mi |
| 2401 Westridge St Unit 422 Houston, TX | 2.0 | 2.0 | 812 | $989 | $1.22 | 7d | 1 | 0.17mi |
| 2401 Westridge St Unit 2-2610 Houston, TX | 2.0 | 1.0 | 812 | $824 | $1.01 | 24d | 1 | 0.17mi |
| 2401 Westridge St Unit 1-1013 Houston, TX | 2.0 | 2.0 | 844 | $1,250 | $1.48 | 43d | 1 | 0.17mi |
| 2401 Westridge St Unit 2422 Houston, TX | 1.0 | 1.0 | 602 | $970 | $1.61 | 13d | 1 | 0.17mi |
| 2401 Westridge St Unit 2-2605 Houston, TX | 1.0 | 1.0 | 644 | $1,500 | $2.33 | 43d | 1 | 0.17mi |
| 2401 Westridge St Unit 325 Houston, TX | 1.0 | 1.0 | 602 | $970 | $1.61 | 7d | 1 | 0.17mi |
| 2401 Westridge St Unit 2-2314 Houston, TX | 2.0 | 1.0 | 812 | $999 | $1.23 | 43d | 1 | 0.17mi |
| 2401 Westridge St Unit 321 Houston, TX | 1.0 | 1.0 | 602 | $935 | $1.55 | 7d | 1 | 0.17mi |
| 2401 Westridge St Unit 1-1009 Houston, TX | 2.0 | 2.0 | 841 | $998 | $1.19 | 24d | 1 | 0.17mi |
| 2401 Westridge St Unit 1-1009 Houston, TX | 2.0 | 2.0 | 844 | $1,000 | $1.18 | 43d | 1 | 0.17mi |
| 2400 South Loop W Houston, TX | 1.0–2.0 | 1.0–2.0 | 723 | $1,250 | $1.73 | 5d | 24 | 0.18mi |
| 2818 S Bartell Dr Houston, TX | 1.0 | 1.0 | 780 | $795 | $1.02 | 43d | 1 | 0.19mi |
| 2400 South Loop W Unit 1-1617 Houston, TX | 1.0 | 1.0 | 598 | $899 | $1.50 | 24d | 1 | 0.19mi |
| 2400 South Loop W Unit 1-1617 Houston, TX | 1.0 | 1.0 | 602 | $950 | $1.58 | 44d | 1 | 0.19mi |
| 8416 W Bartell Dr Houston, TX | 1.0 | 1.0 | 622 | $1,007 | $1.62 | 22d | 1 | 0.24mi |
| 8416 W Bartell Dr Houston, TX | 2.0 | 2.0 | 892 | $1,195 | $1.34 | 24d | 1 | 0.24mi |
| 8416 W Bartell Dr Houston, TX | 1.0 | 1.0 | 622 | $1,007 | $1.62 | 43d | 1 | 0.24mi |
| 8410 W Bartell Dr Unit 2047 Houston, TX | 2.0 | 2.0 | 892 | $1,069 | $1.20 | 11d | 1 | 0.24mi |
| 8800 Lakes at 610 Dr Houston, TX | 2.0 | 2.0 | 951 | $1,280 | $1.35 | 24d | 1 | 0.25mi |
HOA detail condo
- Monthly dues
- $40 · $480/yr
- Assessments
- None detected in remarks — confirm with the listing agent.
Listing history 13 events
-
2026-05-22$70,000 Active
-
2026-02-28historical $1,395
-
2026-02-22historical $1,395
-
2026-02-20$1,395
-
2026-02-20price $1,395
-
2026-01-28$1,495
-
2021-11-14historical
-
2021-05-20$79,500 Active
-
2021-05-20historical
-
2021-05-15$79,500 Active
-
2006-07-15historical
-
2006-06-01$51,000
-
1997-11-21soldstatus
ⓘ Source: listings_history table (triggers on properties + properties_extension) + one-shot
backfill from property_details.listing_events for pre-trigger history.
Tax reassessment forecast TX · Resets to sale price
- Current annual tax
- $1,657 · $138/mo
- Projected year-2 tax
- $1,657 · $138/mo
- Expected delta
- $0/yr ($0/mo · 0.0%)
ⓘ Screening estimate from a state-policy table — verify with the county assessor before closing.
Climate risk First Street
- Flood 8/10 Severe FEMA zone X (unshaded) · 99% chance over 30 yrs
- Wildfire 1/10 Low
- Heat 9/10 Extreme 7 d/yr ≥109°F today · 25 d/yr by 30 yrs out
- Wind 9/10 Extreme 99% chance of damaging wind over 30 yrs
- Air quality 2/10 Low 2 unhealthy d/yr today · 2 by 30 yrs out
Nearby sold comps map
Loading sold comps map…
Walkable amenities ~0.75 mi
Loading nearby amenities…
Taxation est. · year 1
- Rental income
- $13,135
- − Mortgage interest
- −$3,921
- − Property taxes
- −$1,657
- − Insurance
- −$1,148
- − Repairs & maintenance
- −$1,051
- − Management
- −$1,051
- − HOA
- −$480
- − Depreciation
- −$2,036
- Taxable income
- $1,792
- Est. tax owed @ 24.0%
- −$430
- After-tax cash flow
- $2,257/yr
For passive investors: Depreciation is non-cash, so a rental often shows a tax loss while cash-flowing — sheltering income. Rental losses are passive: they offset passive income freely, and up to $25,000/yr can offset ordinary (W-2) income if you actively participate and your MAGI is under $100k (phasing out to $0 by $150k); unused losses carry forward. On sale, claimed depreciation is recaptured at up to 25%, and gains may owe capital-gains tax (a 1031 exchange can defer both). Figures are a year-1 estimate at your 24.0% rate — not tax advice; consult a CPA.
Schools (NCES district)
- District
- Houston ISD
- NCES district ID
- 4823640
- Math proficiency
- 27% ▼ -18.00%
- Reading proficiency
- 35% ▼ -6.00%
- Median HH income
- $46,054
- Composite
- 26.63/100
- National rank
- #7173
- State rank
- #593 of 826 in TX
Livability — Houston
- Score
- 74/100
- State rank
- #184
- US rank
- #4771
Category grades
Schools grade is shown separately in the Schools card above.
Census & demographics
- Census place
- Houston, TX
- County
- Harris County · 4,702,590 people
- City population
- 3,226,434
- Metro
- Houston-The Woodlands-Sugar Land, TX
- Population (ZIP)
- 28,272
- Household income
- $62,106
- Rent vs Own
- Severe rent burden
- 2814.0
Population outlook (Harris County) Hauer SSP2
- Today (2025)
- 5,571,493 people
- By 2030
- 6,089,821 · +9.3%
- By 2040
- 7,142,806 · +28.2%
- By 2050
- 8,185,864 · +46.9%
- By 2075
- 10,574,329 · +89.8%
- By 2100
- 12,109,958 · +117.4%
Race, ethnicity, and origin ACS 2023
- Neighborhood character
- Highly diverse neighborhood (Simpson 0.72)
- Race & ethnicity
- Black 41% Asian 22% White 20% Hispanic / Latino 14% Two or more races 10%
- Hispanic origin (detail)
- Mexican 7%
- Common ancestry
- Slovak 2% Romanian 1% Italian 1%
- Foreign-born
- 29% · China, Canada, Jamaica
- Languages at home
- 67% English-only · Spanish 9% Chinese 7% Other Indo-European 5%
Political lean MEDSL · Harris
- 2024 margin
- Lean D (+5.5) · D 52.0% · R 46.4% · Other 1.6%
- 2008→2024 swing
- +3.9pp toward D · 2008: 1.6pp · 2024: 5.5pp
- All cycles
- 2024: D+5.5 2020: D+13.3 2016: D+12.4 2012: D+0.1 2008: D+1.6
Not yet ingested
- Civics
- —
Market trends
- HPI YoY
- ▼ -4.51%
- Current HPI
- 170.4017
- Rent YoY
- ▼ -2.82%
- Metro
- Houston-The Woodlands-Sugar Land, TX
- State GDP YoY
- ▲ 3.95%
- F500 in state
- 110
Industry mix (Fortune 500 HQ in TX)
| Industry | F500 HQs | Revenue |
|---|---|---|
| Energy | 16 | $1,198B |
|
||
| Technology | 5 | $198B |
|
||
| Engineering / Construction | 4 | $72B |
|
||
| Energy Services | 3 | $60B |
|
||
| Utilities | 3 | $41B |
|
||
| Healthcare | 2 | $330B |
|
||
Price history
+37.3% since first listed13 events — show timeline
- 2026-05-22 Listed $70,000 HARMLS
- 2026-02-28 Rental Removed $1,395 RenterWarehouse
- 2026-02-22 Rental Removed $1,395 RenterWarehouse
- 2026-02-20 Listed for Rent $1,395 RenterWarehouse
- 2026-02-20 Price Changed $1,395 RenterWarehouse
- 2026-01-28 Listed for Rent $1,495 RenterWarehouse
- 2021-11-14 Listing Removed — HARMLS
- 2021-05-20 Listing Removed — HARMLS
- 2021-05-20 Listed $79,500 HARMLS
- 2021-05-15 Listed $79,500 HARMLS
- 2006-07-15 Listing Removed — HARMLS
- 2006-06-01 Listed $51,000 HARMLS
- 1997-11-21 Sold (Public Records) — Public Records
Property tax history
+4.5%/yrLatest (2025): $1,657 · +8.6% YoY. Source: county tax records.
Cash-flow waterfall
monthlySold comps — $/sqft
last 12 mo · ≤1 miLoading sold comps…