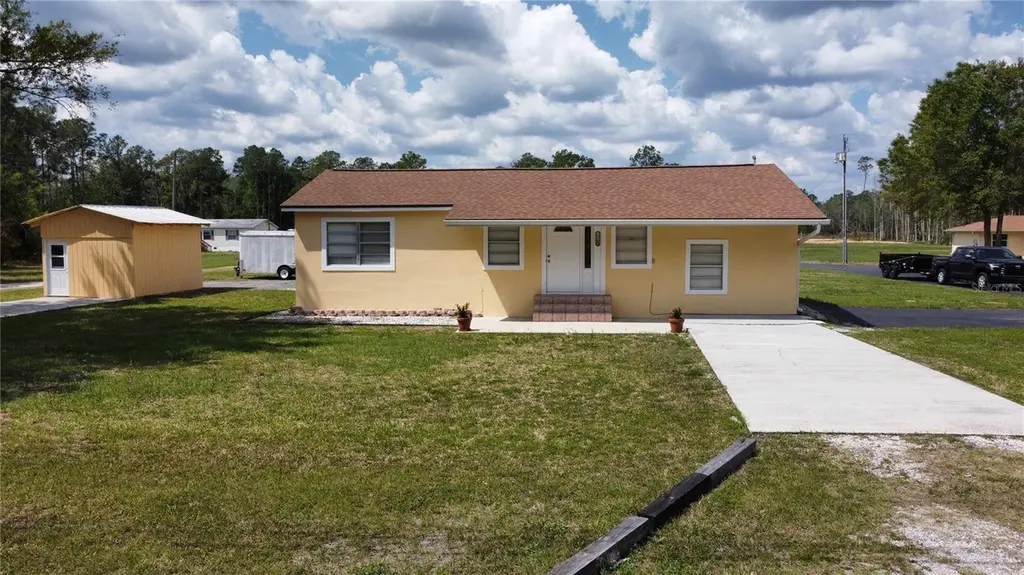
2305 State Road 33 Hwy · Four Corners, FL
Flood risk 1/10 · Minimal
- FEMA flood zone
- X (unshaded)
- Chance of flooding over 30 yrs
- 0.0%
- Est. flood insurance / yr
- $507 – $1,088
Fire risk 8/10 · Major
- Est. fire insurance / yr
- $947 – $1,759
Heat risk 8/10 · Major
- Hot days now (above 108°F)
- 7 days/yr
- Hot days in 30 yrs
- 23 days/yr
Wind risk 9/10 · Severe
- Chance of severe wind over 30 yrs
- 99.0%
Air-quality risk 2/10 · Minimal
- Unhealthy air days now
- 1 days/yr
- Unhealthy air days in 30 yrs
- 1 days/yr
Risk factors via First Street. Map © Google.
Why this score? — see what drove the F grade
The composite is a weighted blend of 9 inputs, each scored 0–100. Each bar is that input's sub-score; the figure is the points it added to the 100-point composite (weight × sub-score).
- Cash flow +11.4/30.0
- Appreciation +4.8/10.0
- Schools +4.2/10.0
- Livability +3.5/5.0
- DSCR +3.4/10.0
- Condition / age +2.5/5.0
- 1% rule +2.1/10.0
- Rent growth +1.6/5.0
- ARV discount +0.0/15.0
$319,900
🖨 Deal sheet 📄 Offer letter ✓ Due diligence
Listing remarks MLS
PRICE REDUCED TO SELL! Great country home. Over one acre fenced with barn, side pasture, shed with outdoor grill, and large oak trees. Home remodled, new ceramic tiled floors, new kitchen and appliances, new septic system, new electrial, new paint inside and outside. The fenced in pasture on side of property is all part of this 1.25 acre lot. Small deck on back of home. New blinds. Makes a great place to live or a great rental property. 220 Feet of property has full exposure on busy Hwy 33 in South Lake County just 1/2 mile north of CR 474. Easy access to HWY 27 near grocery stores, Walmart, Walgreens, gas stations, etc.
Key facts
- 1.25 acre lot
- Built 1959
- Listed 84 days
Property features AI
Finance
- Other: Homestead exemption indicated; Property zoned RES; Other structures include shed(s), storage and workshop; Lot is level and paved with oak trees; Approximately 1.25 acres
- HOA & community: No HOA association indicated; Pets allowed
Exterior
- Parking: Paved access
- Utilities: Well water; Septic tank; Broadband/high-speed internet available; Cable available; Electricity available; Phone available
- Home design: Single family residence; Residential property; One story; East-facing
- Construction: Block, brick and stucco construction; Shingle roof; Slab foundation; Built on one level
- Exterior features: Front porch; Porch; Exterior lighting; Storage
Interior
- Kitchen: Dishwasher; Microwave; Range; Refrigerator
- Bedrooms: 3 bedrooms
- Flooring: Tile
- Bathrooms: 2 full bathrooms
- Heating & cooling: Central heating; Central air conditioning
- Interior features: Ceiling fans; Eat-in kitchen; Open floorplan; Solid wood cabinets; Walk-in closet(s)
- Laundry & utility: Inside laundry
Neighborhood map
What this means for you Summary
Snapshot
- This is a 3-bed/1.0-bath single-family listed at $320k.
Deal economics
- At list price, monthly cash flow is $-109 ($-1k/yr) — negative.
- To cash-flow at today's rent, offer at most $301k (6.0% below list).
- To meet the 1% rule (rent ≥ 1% of price), the offer needs to be $229k (28.5% below list).
- Recommended offer: $229k (28.5% below list) — sets the bar for 1% rule.
- Cap rate 5.9% vs local median 3.2% in Four Corners — top-decile yield for the area; either an underpriced asset or a hidden risk that comps aren't pricing in. Stress-test before assuming the spread holds.
Location & tenants
- Location reads 69/100 on livability (#453 in FL) — a middle-class / working-renter tenant base. Strengths: housing A+, cost of living A-; Watch: amenities F, health & safety F.
- Lake (suburban): math 49% / reading 50% proficiency, ranked #37 of 73 in FL (top 51%) — families likely to look elsewhere, expect single-tenant / working-renter base with shorter leases.
- Zoned schools: Pine Ridge Elementary School (math 61% / reading 61%, grade B, #653 of 2,144 statewide, top 31%, 773 students, 37% FRL); South Lake High School (math 36% / reading 39%, grade F, #336 of 667 statewide, top 51%, 2,169 students, 40% FRL).
- Market conditions: Rents falling (-3.5%/yr); 716 active listings in the ZIP; solid renter incomes; 4,799 units permitted in Lake County in 2024 (814 in 5+ unit buildings).
- This rent runs 36% of the median local income ($75k/yr) — at the standard rent-burdened threshold; future hikes will face affordability resistance.
Forward outlook
- In year one you build about $1k of equity ($2k loan paydown + $-1k appreciation (-0.3% local appreciation)).
- Lake County population projected at +37% by 2050 — long-run rental-demand tailwind backs the buy-and-hold thesis.
Negotiation context
- It's been on market 84 days — a 6% lower offer ($301k) is reasonable based on typical stale-listing flexibility.
- 7 sale attempts since 20y ago with the ask held roughly flat each time — persistent listings suggest the price (not the market) is what's stuck; bring a comps-based counter.
- Current owner paid $67k; list at $320k implies a 377% gain — meaningful room to come down on a strong offer.
Risks & watch-outs
- Watch-outs: built in 1959 — expect roof / HVAC / electrical / plumbing capex.
- Climate carrying-cost: severe wind risk, 99% chance of damaging wind over 30y; severe wildfire risk; extreme-heat days projected 7→23/yr by 2055 (HVAC capex compounding) — expect insurance premiums to compound above CPI over the hold.
Questions for the listing agent
- What do current leases actually rent for vs. the listed asking? Can we see a recent rent roll and the last 12 months of T-12 income?
- It's been on market 84 days. Have you received any prior offers? Is the seller open to a 29% concession, seller financing, or rate buy-down credit?
- Built in 1959 — when were the roof, HVAC, electrical panel, plumbing, and water heater last replaced?
- Why hasn't it sold? Are there any deal-killer items the seller is aware of (foundation, flood, title, zoning, code violations)?
- Is there a deadline driving the sale (1031 exchange, divorce, estate, relocation)? That informs how much negotiation room exists.
- Schools are F-rated, which usually means shorter tenancies and higher turnover. Who's the typical renter profile here, and what's been the actual vacancy rate?
- The area grade is low — what's the realistic commute time and amenity access for the typical tenant pool here? Any planned neighborhood developments (good or bad) we should know about?
- What's the average days-on-market for RENTAL listings here right now (not sales)? A rising rental-DOM trend means longer vacancies and softer asking-rent achievability than the comps imply.
- What's the recent tenant-quality profile in this submarket — average credit score on applications, eviction rate, late-payment / NSF rate, and stable-employment percentage? A property-management company in the area should have these aggregated.
- How much new for-sale + rental construction is in the pipeline within 1–3 miles? Heavy new supply typically softens prices + rents 12–24 months out; constrained supply supports both.
Investment metrics
- 1% rule
- 0.71% ✗
- Cap rate
- 5.89%
- Cash-on-cash
- -1.46%
- DSCR
- 0.94
- GRM
- 11.7
CMA / ARV
- ARV (on-the-fly)
- $232,170
- Comps found
- 1
Show comp detail 1 sale within ~0.75 mi
| Address | Dist | Beds/Ba | Sqft | Sold | Price | $/sf | Match |
|---|---|---|---|---|---|---|---|
| 2323 State Road 33 | 0.04mi | 3/1.0 | 1,104 (+1%) | 2mo | $235,000 | $213 | 94 |
Match score weights: distance 35% · size 25% · config 20% · recency 20%. Top-matched comps best support the ARV.
Projected returns pro-forma
-0.33% appreciation · 0.0% rent growth · sell at horizon
- IRR
- -7.0%
- Equity multiple
- 0.69×
- Total profit
- $-28,055
- Equity at exit
- $87,645
- IRR
- -2.7%
- Equity multiple
- 0.74×
- Total profit
- $-23,348
- Equity at exit
- $101,256
Cash invested: $89,572 (down + closing). Projections, not guarantees.
Landlord ↔ Tenant lean methodology
- Overall (STATE)
- 87 Strongly Landlord-Friendly
- State Florida
- 87 Strongly Landlord-Friendly · R+3
- County
- — inherits STATE
- City
- — inherits STATE
ZIP-level market 34714
- Home prices YoY
- -0.1%
- Rents YoY
- -3.5%
- Active inventory
- 716
- Price-to-rent
- 11.7×
Monthly cashflow live
- Estimated rent
- $2,286 medium interval (Pro) →
- Mortgage (P&I)
- −$1,678
- Tax from tax record
- −$104 /mo · $1,243/yr
- Insurance
- −$133
- HOA
- −$0
- Vacancy / Maint / Mgmt
- −$480
- Net cashflow
- $-109
Break-even live
UW: 25.0% down · 7.5% · 30yr · 1.5% tax · 5.0% vac · 8.0% maint · 8.0% mgmt
Financing live
Cash to close
- Down payment
- $79,975
- Closing costs
- $9,597
- Reserves months
- —
- Total cash needed
- —
Loan-product check · same deal, 3 products live
Conventional
25% down · 7.5% · 30yr
- Down + closing
- —
- Monthly P&I
- —
- Monthly cashflow
- —
- DSCR
- —
- Eligible?
- —
Personal DTI + credit; lowest rate.
DSCR
20% down · 8.5% · 30yr
- Down + closing
- —
- Monthly P&I
- —
- Monthly cashflow
- —
- DSCR
- —
- Eligible?
- —
No personal income docs; deal must DSCR.
Hard money
10% down · 12.0% · 12mo
- Down + closing
- —
- Monthly P&I
- —
- Monthly cashflow
- —
- DSCR
- —
- Eligible?
- —
Short-term bridge; refi at stabilization.
Listing history 32 events
-
2026-06-18days on market $319,900 Active 84 DOM
-
2026-06-17days on market $319,900 Active 83 DOM
-
2026-06-16days on market $319,900 Active 82 DOM
-
2026-06-15days on market $319,900 Active 81 DOM
-
2026-06-13days on market $319,900 Active 79 DOM
-
2026-06-09days on market $319,900 Active 75 DOM
-
2026-06-08days on market $319,900 Active 74 DOM
-
2026-06-07days on market $319,900 Active 73 DOM
-
2026-06-04days on market $319,900 Active 70 DOM
-
2026-06-03days on market $319,900 Active 69 DOM
-
2026-06-02days on market $319,900 Active 68 DOM
-
2026-06-01days on market $319,900 Active 67 DOM
-
2026-05-31days on market $319,900 Active 66 DOM
-
2026-05-04price $319,900
-
2026-03-26$329,900 Active
-
2025-05-28historical
-
2025-05-03status Active
-
2025-04-30historical
-
2025-04-24status Active
-
2025-04-20historical
-
2025-03-22price $329,000
-
2025-03-10price $349,000
-
2025-02-10$375,000 Active
-
2012-04-09soldstatus $67,000
-
2012-04-05soldstatus $67,000 629-char remark
Show marketing remark (629 chars)
PRICE REDUCED TO SELL! Great country home. Over one acre fenced with barn, side pasture, shed with outdoor grill, and large oak trees. Home remodled, new ceramic tiled floors, new kitchen and appliances, new septic system, new electrial, new paint inside and outside. The fenced in pasture on side of property is all part of this 1.25 acre lot. Small deck on back of home. New blinds. Makes a great place to live or a great rental property. 220 Feet of property has full exposure on busy Hwy 33 in South Lake County just 1/2 mile north of CR 474. Easy access to HWY 27 near grocery stores, Walmart, Walgreens, gas stations, etc.
-
2011-07-06$69,900 629-char remark
Show marketing remark (629 chars)
PRICE REDUCED TO SELL! Great country home. Over one acre fenced with barn, side pasture, shed with outdoor grill, and large oak trees. Home remodled, new ceramic tiled floors, new kitchen and appliances, new septic system, new electrial, new paint inside and outside. The fenced in pasture on side of property is all part of this 1.25 acre lot. Small deck on back of home. New blinds. Makes a great place to live or a great rental property. 220 Feet of property has full exposure on busy Hwy 33 in South Lake County just 1/2 mile north of CR 474. Easy access to HWY 27 near grocery stores, Walmart, Walgreens, gas stations, etc.
-
2010-02-25soldstatus $32,000
-
2009-12-22$32,900
-
2007-04-16soldstatus $220,000
-
2006-10-23historical
-
2006-09-07$249,900
-
1975-01-01soldstatus $17,000
ⓘ Source: listings_history table (triggers on properties + properties_extension) + one-shot
backfill from property_details.listing_events for pre-trigger history.
Tax reassessment forecast FL · Resets to sale price
- Current annual tax
- $1,243 · $104/mo
- Projected year-2 tax
- $2,655 · $221/mo
- Expected delta
- +$1,412/yr (+$118/mo · 113.6%)
ⓘ Screening estimate from a state-policy table — verify with the county assessor before closing.
Climate risk First Street
- Flood 1/10 Low FEMA zone X (unshaded) · 0% chance over 30 yrs
- Wildfire 8/10 Severe
- Heat 8/10 Severe 7 d/yr ≥108°F today · 23 d/yr by 30 yrs out
- Wind 9/10 Extreme 99% chance of damaging wind over 30 yrs
- Air quality 2/10 Low 1 unhealthy d/yr today · 1 by 30 yrs out
Nearby sold comps map
Loading sold comps map…
Walkable amenities ~0.75 mi
Loading nearby amenities…
Taxation est. · year 1
- Rental income
- $27,430
- − Mortgage interest
- −$17,919
- − Property taxes
- −$1,243
- − Insurance
- −$1,600
- − Repairs & maintenance
- −$2,194
- − Management
- −$2,194
- − Depreciation
- −$9,306
- Taxable loss
- −$7,027
- Est. tax savings @ 24.0%
- +$1,686
- After-tax cash flow
- $382/yr
For passive investors: Depreciation is non-cash, so a rental often shows a tax loss while cash-flowing — sheltering income. Rental losses are passive: they offset passive income freely, and up to $25,000/yr can offset ordinary (W-2) income if you actively participate and your MAGI is under $100k (phasing out to $0 by $150k); unused losses carry forward. On sale, claimed depreciation is recaptured at up to 25%, and gains may owe capital-gains tax (a 1031 exchange can defer both). Figures are a year-1 estimate at your 24.0% rate — not tax advice; consult a CPA.
Schools (NCES district)
- District
- Lake
- NCES district ID
- 1201050
- Math proficiency
- 49% ▼ -7.00%
- Reading proficiency
- 50% ▼ -4.00%
- Median HH income
- $46,632
- Composite
- 42.05/100
- National rank
- #3327
- State rank
- #37 of 73 in FL
Livability — Four Corners
- Score
- 69/100
- State rank
- #453
- US rank
- #8218
Category grades
Schools grade is shown separately in the Schools card above.
Census & demographics
- County
- Lake County · 364,602 people
- City population
- 27,422
- Metro
- Orlando-Kissimmee-Sanford, FL
- Population (ZIP)
- 28,200
- Household income
- $75,392
- Rent vs Own
- Severe rent burden
- 953.0
Population outlook (Lake County) Hauer SSP2
- Today (2025)
- 386,640 people
- By 2030
- 417,107 · +7.9%
- By 2040
- 476,676 · +23.3%
- By 2050
- 531,296 · +37.4%
- By 2075
- 648,303 · +67.7%
- By 2100
- 698,530 · +80.7%
Race, ethnicity, and origin ACS 2023
- Neighborhood character
- Diverse neighborhood (Simpson 0.59)
- Race & ethnicity
- White 56% Hispanic / Latino 30% Two or more races 25% Black 6% Asian 1%
- Hispanic origin (detail)
- Mexican 2% Puerto Rican 17% Dominican 2%
- Common ancestry
- Romanian 3% Lithuanian 3% Italian 2%
- Foreign-born
- 13% · Canada, Jamaica
- Languages at home
- 76% English-only · Spanish 19% Other Indo-European 1% Other Asian/Pacific 1%
Political lean MEDSL · Lake
- 2024 margin
- Strong R (+24.7) · D 37.3% · R 62.0%
- 2008→2024 swing
- -11.2pp toward R · 2008: -13.5pp · 2024: -24.7pp
- All cycles
- 2024: R+24.7 2020: R+20.0 2016: R+23.1 2012: R+17.1 2008: R+13.5
Not yet ingested
- Civics
- —
Market trends
- HPI YoY
- ▼ -0.33%
- Current HPI
- 256.1331
- Rent YoY
- ▼ -3.46%
- Metro
- Orlando-Kissimmee-Sanford, FL
- State GDP YoY
- ▲ 3.28%
- F500 in state
- 36
Industry mix (Fortune 500 HQ in FL)
| Industry | F500 HQs | Revenue |
|---|---|---|
| Industrial Technology | 2 | $29B |
|
||
| Insurance | 2 | $17B |
|
||
| Retail | 1 | $60B |
|
||
| Technology Distribution | 1 | $58B |
|
||
| Homebuilding | 1 | $35B |
|
||
| Technology Manufacturing | 1 | $35B |
|
||
Price history
+1781.8% since first listed19 events — show timeline
- 2026-05-04 Price Changed $319,900 Stellar MLS as Distributed by MLS Grid
- 2026-03-26 Listed $329,900 Stellar MLS as Distributed by MLS Grid
- 2025-05-28 Listing Removed — Stellar MLS as Distributed by MLS Grid
- 2025-05-03 Relisted — Stellar MLS as Distributed by MLS Grid
- 2025-04-30 Listing Removed — Stellar MLS as Distributed by MLS Grid
- 2025-04-24 Relisted — Stellar MLS as Distributed by MLS Grid
- 2025-04-20 Listing Removed — Stellar MLS as Distributed by MLS Grid
- 2025-03-22 Price Changed $329,000 Stellar MLS as Distributed by MLS Grid
- 2025-03-10 Price Changed $349,000 Stellar MLS as Distributed by MLS Grid
- 2025-02-10 Listed $375,000 Stellar MLS as Distributed by MLS Grid
- 2012-04-09 Sold (Public Records) $67,000 Public Records
- 2012-04-05 Sold (MLS) $67,000 Stellar MLS as Distributed by MLS Grid
- 2011-07-06 Listed $69,900 Stellar MLS as Distributed by MLS Grid
- 2010-02-25 Sold (MLS) $32,000 Stellar MLS as Distributed by MLS Grid
- 2009-12-22 Listed $32,900 Stellar MLS as Distributed by MLS Grid
- 2007-04-16 Sold (Public Records) $220,000 Public Records
- 2006-10-23 Listing Removed — Stellar MLS as Distributed by MLS Grid
- 2006-09-07 Listed $249,900 Stellar MLS as Distributed by MLS Grid
- 1975-01-01 Sold (Public Records) $17,000 Public Records
Property tax history
+3.4%/yrLatest (2025): $1,243 · +2.6% YoY. Source: county tax records.
Cash-flow waterfall
monthlySold comps — $/sqft
last 12 mo · ≤1 miLoading sold comps…