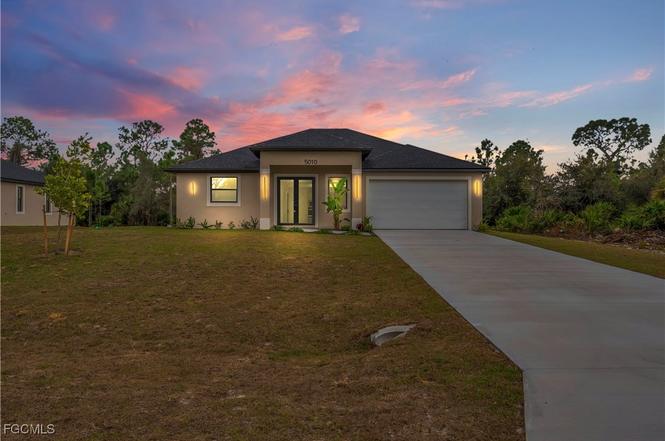
5010 SE Tradewinds Cir · Port LaBelle, FL
Flood risk 1/10 · Minimal
- FEMA flood zone
- X (unshaded)
- Chance of flooding over 30 yrs
- 0.0%
- Est. flood insurance / yr
- $507 – $1,088
Fire risk 4/10 · Minor
- Est. fire insurance / yr
- $947 – $1,759
Heat risk 9/10 · Severe
- Hot days now (above 108°F)
- 7 days/yr
- Hot days in 30 yrs
- 25 days/yr
Wind risk 10/10 · Severe
- Chance of severe wind over 30 yrs
- 99.0%
Air-quality risk 2/10 · Minimal
- Unhealthy air days now
- 0 days/yr
- Unhealthy air days in 30 yrs
- 1 days/yr
Risk factors via First Street. Map © Google.
Why this score? — see what drove the D- grade
The composite is a weighted blend of 9 inputs, each scored 0–100. Each bar is that input's sub-score; the figure is the points it added to the 100-point composite (weight × sub-score).
- Appreciation +10.0/10.0
- ARV discount +7.5/15.0
- Cash flow +6.0/30.0
- Schools +3.1/10.0
- Livability +3.1/5.0
- Rent growth +2.5/5.0
- Condition / age +2.5/5.0
- 1% rule +1.3/10.0
- DSCR +0.4/10.0
$349,000
🖨 Deal sheet (PDF) 📄 Offer letter ✓ Due diligence
Listing remarks MLS
Under contract-accepting backup offers. Location opportunity to build your dream home. NO HOA or CDD. Water and electricity all available. Adjacent lot available for sale - same size and same price at 5012 SE Tradewinds Circle. Lots of development happening and perfect time to secure your piece of beautiful Labelle, FL! Prime location that is seeing exponential growth! Conveniently located just 2 hours to Miami and 1 hour to Naples, you're never far from the beach. Come enjoy the Florida lifestyle!.
Key facts
- Close to schools
- Versatile den
- New construction
Tags
Property features AI
Finance
- Financial info: Pets allowed
- HOA & community: Non-gated community; No association fee listed
Exterior
- Parking: Attached garage; 2 covered garage spaces (2-car)
- Security: High-impact/security doors
- Utilities: Septic tank; Well water; Cable not available
- Home design: Single-story property; Entry level: 1; New construction; Faces north
- Construction: Block, concrete, and stucco construction; Shingle roof; Built as new construction
- Exterior features: Security / high-impact doors; Rectangular lot; South exposure; Has view
Interior
- Kitchen: Dishwasher; Microwave; Range; Refrigerator
- Bedrooms: Den (flex room)
- Flooring: Tile flooring
- Bathrooms: 2 full bathrooms; 1 half bathroom
- Heating & cooling: Central heating (electric); Central air conditioning (electric)
- Interior features: Display windows and impact glass; Dual sinks; Kitchen island; Combined living and dining area; Shower-only bathroom with separate shower; Unfurnished
Neighborhood map
What this means for you Summary
Snapshot
- This is a 3-bed/2.5-bath land listed at $349k.
Deal economics
- At list price, monthly cash flow is $-662 ($-8k/yr) — negative.
- To cash-flow at today's rent, offer at most $253k (27.5% below list).
- To meet the 1% rule (rent ≥ 1% of price), the offer needs to be $221k (36.5% below list).
- Recommended offer: $221k (36.5% below list) — sets the bar for 1% rule.
- Cap rate 4.0% vs local median 5.1% in Port LaBelle — below-typical yield; the buyer is paying a premium for something (appreciation thesis, condition, location) that the cap rate doesn't capture.
Location & tenants
- Location reads 62/100 on livability (#750 in FL) — a middle-class / working-renter tenant base. Strengths: cost of living A+, housing A+; Watch: amenities F, commute F, employment F.
- Hendry (town): math 35% / reading 40% proficiency, ranked #65 of 73 in FL (top 89%) — families likely to look elsewhere, expect single-tenant / working-renter base with shorter leases; 75% free/reduced lunch — lower-income household profile, screen leases tightly.
- Zoned schools: Country Oaks Elementary School (math 48% / reading 45%, grade D-, #1,223 of 2,144 statewide, top 57%, 893 students, 75% FRL); Labelle Middle School (math 37% / reading 38%, grade F, #395 of 571 statewide, top 70%, 817 students, 72% FRL); Labelle High School (math 42% / reading 41%, grade F, #284 of 667 statewide, top 43%, 1,451 students, 62% FRL).
- Market conditions: 950 active listings in the ZIP; 13 comparable units currently listed for rent nearby; rentals at typical pace (median 26d on market — plan ~3-4 weeks tenant-placement turnaround); 557 units permitted in Hendry County in 2024 (45 in 5+ unit buildings).
- At $2,215/mo this rent would consume 47% of the median local household income ($57k/yr) (locally 498% of renters already pay >50% of income on rent) — very limited rent-growth headroom before tenants either downsize or default.
Forward outlook
- In year one you build about $37k of equity ($2k loan paydown + $35k appreciation (10.0% local appreciation)).
- Hendry County population projected to shrink 7% by 2050 — rents likely to lag national; underwrite the cash flow, not the appreciation.
- By year 2, paydown + projected appreciation supports a ~$60k cash-out refi (75% LTV) — recoverable capital for the next deal without selling this one.
Negotiation context
- It's been on market 149 days — a 12% lower offer ($307k) is reasonable based on typical stale-listing flexibility.
- 2 sale attempts since 3y ago with the ask held roughly flat each time — persistent listings suggest the price (not the market) is what's stuck; bring a comps-based counter.
- Current owner paid $22k; list at $349k implies a 1486% gain — meaningful room to come down on a strong offer.
Risks & watch-outs
- Climate carrying-cost: severe wind risk, 99% chance of damaging wind over 30y; extreme-heat days projected 7→25/yr by 2055 (HVAC capex compounding) — expect insurance premiums to compound above CPI over the hold.
Questions for the listing agent
- What do current leases actually rent for vs. the listed asking? Can we see a recent rent roll and the last 12 months of T-12 income?
- It's been on market 149 days. Have you received any prior offers? Is the seller open to a 37% concession, seller financing, or rate buy-down credit?
- Why hasn't it sold? Are there any deal-killer items the seller is aware of (foundation, flood, title, zoning, code violations)?
- Is there a deadline driving the sale (1031 exchange, divorce, estate, relocation)? That informs how much negotiation room exists.
- Schools are F-rated, which usually means shorter tenancies and higher turnover. Who's the typical renter profile here, and what's been the actual vacancy rate?
- The area grade is low — what's the realistic commute time and amenity access for the typical tenant pool here? Any planned neighborhood developments (good or bad) we should know about?
- What's the average days-on-market for RENTAL listings here right now (not sales)? A rising rental-DOM trend means longer vacancies and softer asking-rent achievability than the comps imply.
- What's the recent tenant-quality profile in this submarket — average credit score on applications, eviction rate, late-payment / NSF rate, and stable-employment percentage? A property-management company in the area should have these aggregated.
- How much new for-sale + rental construction is in the pipeline within 1–3 miles? Heavy new supply typically softens prices + rents 12–24 months out; constrained supply supports both.
Investment metrics
- 1% rule
- 0.63% ✗
- Cap rate
- 4.02%
- Cash-on-cash
- -8.13%
- DSCR
- 0.64
- GRM
- 13.1
CMA / ARV
No comps found within radius.
Projected returns pro-forma
10.0% appreciation · 3.0% rent growth · sell at horizon
- IRR
- 18.6%
- Equity multiple
- 2.51×
- Total profit
- $147,938
- Equity at exit
- $314,407
- IRR
- 17.2%
- Equity multiple
- 5.80×
- Total profit
- $468,882
- Equity at exit
- $678,030
Cash invested: $97,720 (down + closing). Projections, not guarantees.
Landlord ↔ Tenant lean methodology
- Overall (STATE)
- 87 Strongly Landlord-Friendly
- State Florida
- 87 Strongly Landlord-Friendly · R+3
- County
- — inherits STATE
- City
- — inherits STATE
ZIP-level market 33935
- Home prices YoY
- 16.3%
- Active inventory
- 950
- Price-to-rent
- 13.1×
Monthly cashflow live
- Estimated rent
- $2,215 high interval (Pro) →
- Mortgage (P&I)
- −$1,830
- Tax est. 1.5%
- −$436 /mo · $5,235/yr
- Insurance
- −$145
- HOA
- −$0
- Vacancy / Maint / Mgmt
- −$465
- Net cashflow
- $-662
Break-even live
Sensitivity live
| Price | -10% $-421 | -5% $-542 | +0% $-662 | +5% $-783 | +10% $-903 |
|---|---|---|---|---|---|
| Rent | -10% $-837 | -5% $-750 | +0% $-662 | +5% $-575 | +10% $-487 |
| Rate | -1.0pp $-486 | -0.5pp $-573 | base $-662 | +0.5pp $-753 | +1.0pp $-845 |
UW: 25.0% down · 7.5% · 30yr · 1.5% tax · 5.0% vac · 8.0% maint · 8.0% mgmt
Financing live
Cash to close
- Down payment
- $87,250
- Closing costs
- $10,470
- Reserves months
- —
- Total cash needed
- —
Loan-product check · same deal, 3 products live
Conventional
25% down · 7.5% · 30yr
- Down + closing
- —
- Monthly P&I
- —
- Monthly cashflow
- —
- DSCR
- —
- Eligible?
- —
Personal DTI + credit; lowest rate.
DSCR
20% down · 8.5% · 30yr
- Down + closing
- —
- Monthly P&I
- —
- Monthly cashflow
- —
- DSCR
- —
- Eligible?
- —
No personal income docs; deal must DSCR.
Hard money
10% down · 12.0% · 12mo
- Down + closing
- —
- Monthly P&I
- —
- Monthly cashflow
- —
- DSCR
- —
- Eligible?
- —
Short-term bridge; refi at stabilization.
Rent comps 13 comps
| Address | Beds | Baths | Sqft | Rent | $/sqft | DOM | Units | Dist |
|---|---|---|---|---|---|---|---|---|
| 801 SW Raintree Blvd Labelle, FL | 3.0 | 2.0 | 1285 | $1,700 | $1.32 | 25d | 1 | 0.51mi |
| 5029 S Rosebud Cir Labelle, FL | 3.0 | 2.0 | 1389 | $1,780 | $1.28 | 25d | 1 | 0.53mi |
| 7038 Lotus Cir Labelle, FL | 4.0 | 3.0 | 1680 | $2,200 | $1.31 | 18d | 1 | 0.66mi |
| 5029 W Hummingbird Dr Labelle, FL | 3.0 | 2.0 | 1212 | $2,450 | $2.02 | 5d | 1 | 0.66mi |
| 5012 Gunn Pl Labelle, FL | 3.0 | 2.5 | 1783 | $2,500 | $1.40 | 4d | 1 | 0.75mi |
| 7016 Palpano Cir Labelle, FL | 3.0 | 2.5 | 1507 | $2,100 | $1.39 | 18d | 1 | 0.92mi |
| 7061 Tide Cir Labelle, FL | 4.0 | 2.0 | 1500 | $1,695 | $1.13 | 25d | 1 | 1.15mi |
| 3051 NW Beechwood Cir Labelle, FL | 4.0 | 2.0 | 1499 | $2,200 | $1.47 | 25d | 1 | 1.16mi |
| 9013 Ike Ct Labelle, FL | 3.0 | 2.0 | 1367 | $2,100 | $1.54 | 4d | 1 | 1.20mi |
| 9001 Penny Cir Labelle, FL | 3.0 | 2.0 | 1472 | $2,300 | $1.56 | 18d | 1 | 1.25mi |
| 9001 Penny Cir Labelle, FL | 3.0 | 2.0 | 1472 | $2,300 | $1.56 | 25d | 1 | 1.25mi |
| 9011 Penny Cir Labelle, FL | 3.0 | 2.0 | 1731 | $2,400 | $1.39 | 25d | 1 | 1.27mi |
| 6210 Forest Ct Labelle, FL | 3.0 | 2.5 | 1503 | $2,200 | $1.46 | 25d | 1 | 1.29mi |
Listing history 23 events
-
2026-06-22days on market $349,000 Active 149 DOM
-
2026-06-18days on market $349,000 Active 146 DOM
-
2026-06-17days on market $349,000 Active 145 DOM
-
2026-06-16days on market $349,000 Active 144 DOM
-
2026-06-15days on market $349,000 Active 143 DOM
-
2026-06-13days on market $349,000 Active 141 DOM
-
2026-06-13days on market $349,000 Active 140 DOM
-
2026-06-10days on market $349,000 Active 138 DOM
-
2026-06-09days on market $349,000 Active 137 DOM
-
2026-06-08days on market $349,000 Active 136 DOM
-
2026-06-07days on market $349,000 Active 135 DOM
-
2026-06-03days on market $349,000 Active 131 DOM
-
2026-06-02days on market $349,000 Active 130 DOM
-
2026-06-01days on market $349,000 Active 129 DOM
-
2026-05-31days on market $349,000 Active 128 DOM
-
2026-03-17price $349,000
-
2026-01-23$349,900 Active
-
2023-07-24soldstatus $22,000 Closed 504-char remark
Show marketing remark (504 chars)
Under contract-accepting backup offers. Location opportunity to build your dream home. NO HOA or CDD. Water and electricity all available. Adjacent lot available for sale - same size and same price at 5012 SE Tradewinds Circle. Lots of development happening and perfect time to secure your piece of beautiful Labelle, FL! Prime location that is seeing exponential growth! Conveniently located just 2 hours to Miami and 1 hour to Naples, you're never far from the beach. Come enjoy the Florida lifestyle!.
-
2023-07-20soldstatus $42,500
-
2023-07-05status Pending 504-char remark
Show marketing remark (504 chars)
Under contract-accepting backup offers. Location opportunity to build your dream home. NO HOA or CDD. Water and electricity all available. Adjacent lot available for sale - same size and same price at 5012 SE Tradewinds Circle. Lots of development happening and perfect time to secure your piece of beautiful Labelle, FL! Prime location that is seeing exponential growth! Conveniently located just 2 hours to Miami and 1 hour to Naples, you're never far from the beach. Come enjoy the Florida lifestyle!.
-
2023-06-26$22,000 Active 504-char remark
Show marketing remark (504 chars)
Under contract-accepting backup offers. Location opportunity to build your dream home. NO HOA or CDD. Water and electricity all available. Adjacent lot available for sale - same size and same price at 5012 SE Tradewinds Circle. Lots of development happening and perfect time to secure your piece of beautiful Labelle, FL! Prime location that is seeing exponential growth! Conveniently located just 2 hours to Miami and 1 hour to Naples, you're never far from the beach. Come enjoy the Florida lifestyle!.
-
2005-04-01soldstatus $68,000
-
2004-10-22soldstatus $21,000
ⓘ Source: listings_history table (triggers on properties + properties_extension) + one-shot
backfill from property_details.listing_events for pre-trigger history.
Climate risk First Street
- Flood 1/10 Low FEMA zone X (unshaded) · 0% chance over 30 yrs
- Wildfire 4/10 Moderate
- Heat 9/10 Extreme 7 d/yr ≥108°F today · 25 d/yr by 30 yrs out
- Wind 10/10 Extreme 99% chance of damaging wind over 30 yrs
- Air quality 2/10 Low 0 unhealthy d/yr today · 1 by 30 yrs out
Nearby sold comps map
Loading sold comps map…
Walkable amenities ~0.75 mi
Loading nearby amenities…
Taxation est. · year 1
- Rental income
- $26,579
- − Mortgage interest
- −$19,549
- − Property taxes
- −$5,235
- − Insurance
- −$1,745
- − Repairs & maintenance
- −$2,126
- − Management
- −$2,126
- − Depreciation
- −$10,153
- Taxable loss
- −$14,356
- Est. tax savings @ 24.0%
- +$3,445
- After-tax cash flow
- $-4,500/yr
For passive investors: Depreciation is non-cash, so a rental often shows a tax loss while cash-flowing — sheltering income. Rental losses are passive: they offset passive income freely, and up to $25,000/yr can offset ordinary (W-2) income if you actively participate and your MAGI is under $100k (phasing out to $0 by $150k); unused losses carry forward. On sale, claimed depreciation is recaptured at up to 25%, and gains may owe capital-gains tax (a 1031 exchange can defer both). Figures are a year-1 estimate at your 24.0% rate — not tax advice; consult a CPA.
Schools (NCES district)
- District
- Hendry
- NCES district ID
- 1200780
- Math proficiency
- 35% ▼ -11.00%
- Reading proficiency
- 40% ▼ -4.00%
- Median HH income
- $37,043
- Composite
- 31.16/100
- National rank
- #6054
- State rank
- #65 of 73 in FL
Livability — Port LaBelle
- Score
- 62/100
- State rank
- #750
- US rank
- #16264
Category grades
Schools grade is shown separately in the Schools card above.
Census & demographics
- Census place
- Port LaBelle, FL
- County
- Hendry County · 23,186 people
- Metro
- Clewiston, FL
- Population (ZIP)
- 23,186
- Household income
- $57,009
- Rent vs Own
- Severe rent burden
- 498.0
Population outlook (Hendry County) Hauer SSP2
- Today (2025)
- 38,866 people
- By 2030
- 38,558 · -0.8%
- By 2040
- 37,743 · -2.9%
- By 2050
- 36,117 · -7.1%
- By 2075
- 30,070 · -22.6%
- By 2100
- 21,966 · -43.5%
Race, ethnicity, and origin ACS 2023
- Neighborhood character
- Majority Hispanic (56%)
- Race & ethnicity
- Hispanic / Latino 56% White 39% Two or more races 21% Black 2% Native American 2%
- Hispanic origin (detail)
- Mexican 40% Puerto Rican 3% Cuban 5%
- Common ancestry
- Lithuanian 2% Serbian 2% Slovak 1%
- Foreign-born
- 27% · Canada, Jamaica
- Languages at home
- 50% English-only · Spanish 50%
Political lean MEDSL · Hendry
- 2024 margin
- Solid R (+38.3) · D 30.4% · R 68.7%
- 2008→2024 swing
- -31.1pp toward R · 2008: -7.2pp · 2024: -38.3pp
- All cycles
- 2024: R+38.3 2020: R+23.0 2016: R+14.2 2012: R+5.9 2008: R+7.2
Not yet ingested
- Civics
- —
Market trends
- HPI YoY
- ▲ 75.20%
- Current HPI
- 537.4928
- Rent YoY
- —
- Metro
- Clewiston, FL
- State GDP YoY
- ▲ 3.28%
- F500 in state
- 36
Industry mix (Fortune 500 HQ in FL)
| Industry | F500 HQs | Revenue |
|---|---|---|
| Industrial Technology | 2 | $29B |
|
||
| Insurance | 2 | $17B |
|
||
| Retail | 1 | $60B |
|
||
| Technology Distribution | 1 | $58B |
|
||
| Homebuilding | 1 | $35B |
|
||
| Technology Manufacturing | 1 | $35B |
|
||
Price history
+1561.9% since first listed8 events — show timeline
- 2026-03-17 Price Changed $349,000 FORTMLS
- 2026-01-23 Listed $349,900 FORTMLS
- 2023-07-24 Sold (MLS) $22,000 Stellar MLS as Distributed by MLS Grid
- 2023-07-20 Sold (Public Records) $42,500 Public Records
- 2023-07-05 Pending — Stellar MLS as Distributed by MLS Grid
- 2023-06-26 Listed $22,000 Stellar MLS as Distributed by MLS Grid
- 2005-04-01 Sold (Public Records) $68,000 Public Records
- 2004-10-22 Sold (Public Records) $21,000 Public Records
Property tax history
+13.5%/yrLatest (2025): $569 · +14.0% YoY. Source: county tax records.
Cash-flow waterfall
monthlySold comps — $/sqft
last 12 mo · ≤1 miLoading sold comps…